ChartVerse: Scaling Chart Reasoning via Reliable Programmatic Synthesis from Scratch
Pith reviewed 2026-05-16 13:08 UTC · model grok-4.3
The pith
A programmatic synthesis framework creates reliable complex chart data that trains an 8B vision-language model to surpass its 30B teacher.
A machine-rendered reading of the paper's core claim, the machinery that carries it, and where it could break.
Core claim
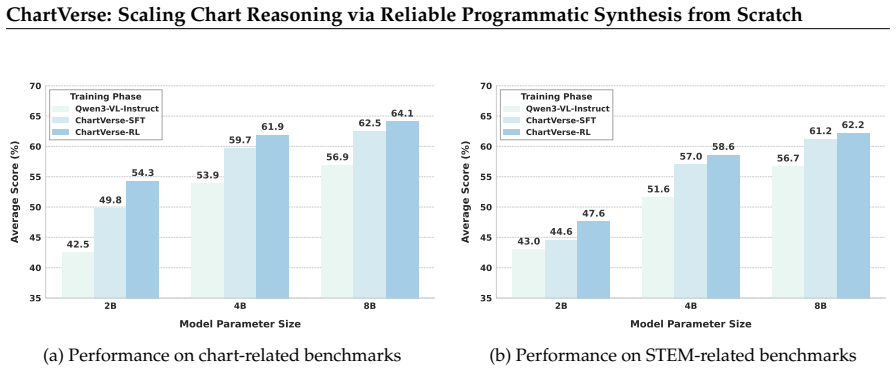
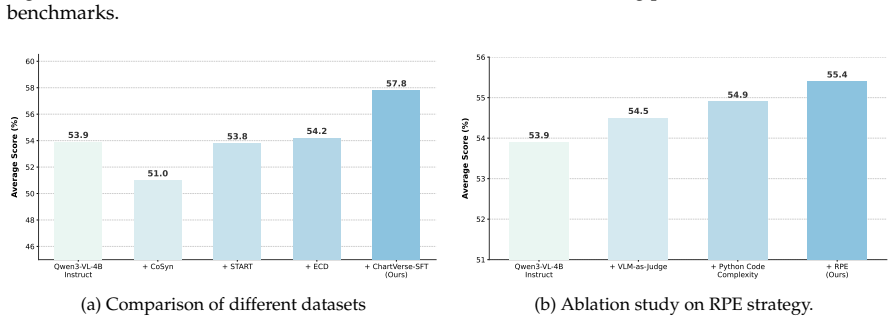
ChartVerse synthesizes diverse high-complexity charts using an RPE-guided chart coder that writes executable programs, then applies truth-anchored inverse QA synthesis to generate questions from deterministic answers pulled directly from the code, followed by filtering on model fail-rate and distillation of chain-of-thought reasoning. This produces ChartVerse-SFT-600K and ChartVerse-RL-40K datasets. The resulting ChartVerse-8B model achieves state-of-the-art chart reasoning performance, surpassing the Qwen3-VL-30B-A3B-Thinking teacher model and rivaling the stronger Qwen3-VL-32B-Thinking.
What carries the argument
Rollout Posterior Entropy (RPE) guided complexity-aware chart coder combined with truth-anchored inverse QA synthesis, which extracts answers from source code before generating questions to ensure consistency.
If this is right
- Produces scalable datasets of 600K supervised fine-tuning samples and 40K reinforcement learning samples.
- Trains an 8B model to exceed the performance of its 30B teacher on chart reasoning benchmarks.
- Generalizes the approach to create reliable reasoning data without human annotation.
- Releases code, weights, and datasets for further use in vision-language model training.
Where Pith is reading between the lines
- Similar synthesis pipelines could address data scarcity in other visual reasoning tasks such as diagram or table interpretation.
- Models might eventually use this method to generate their own training data in a self-improving loop.
- The emphasis on code-executable charts suggests potential for automatic verification in broader multimodal tasks.
Load-bearing premise
The synthesized charts and reasoning chains capture the essential complexities and logical structures found in real-world chart reasoning problems.
What would settle it
If a new test set of human-designed complex charts shows the 8B model underperforming the teacher model, that would indicate the synthetic data does not fully transfer.
Figures


read the original abstract
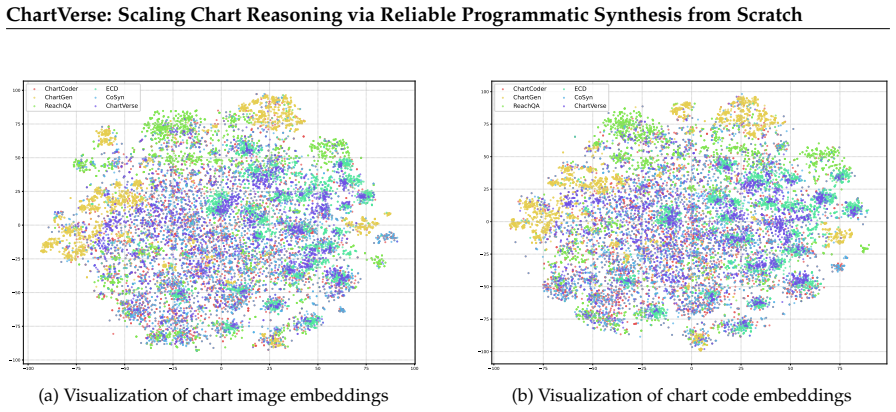
Chart reasoning is a critical capability for Vision Language Models (VLMs). However, the development of open-source models is severely hindered by the lack of high-quality training data. Existing datasets suffer from a dual challenge: synthetic charts are often simplistic and repetitive, while the associated QA pairs are prone to hallucinations and lack the reasoning depth required for complex tasks. To bridge this gap, we propose ChartVerse, a scalable framework designed to synthesize complex charts and reliable reasoning data from scratch. (1) To address the bottleneck of simple patterns, we first introduce Rollout Posterior Entropy (RPE), a novel metric that quantifies chart complexity. Guided by RPE, we develop complexity-aware chart coder to autonomously synthesize diverse, high-complexity charts via executable programs. (2) To guarantee reasoning rigor, we develop truth-anchored inverse QA synthesis. Diverging from standard generation, we adopt an answer-first paradigm: we extract deterministic answers directly from the source code, generate questions conditional on these anchors, and enforce strict consistency verification. To further elevate difficulty and reasoning depth, we filter samples based on model fail-rate and distill high-quality Chain-of-Thought (CoT) reasoning. We curate ChartVerse-SFT-600K and ChartVerse-RL-40K using Qwen3-VL-30B-A3B-Thinking as the teacher. Experimental results demonstrate that ChartVerse-8B achieves state-of-the-art performance, notably surpassing its teacher and rivaling the stronger Qwen3-VL-32B-Thinking. We release our code, model weights, and datasets in https://chartverse.github.io.
Editorial analysis
A structured set of objections, weighed in public.
Referee Report
Summary. The paper introduces ChartVerse, a framework for scalable synthesis of complex charts and reliable reasoning data from scratch to address data scarcity in VLM chart reasoning. It proposes Rollout Posterior Entropy (RPE) to guide complexity-aware programmatic chart generation, truth-anchored inverse QA synthesis (answer-first extraction from code with consistency verification), model fail-rate filtering, and CoT distillation from Qwen3-VL-30B-A3B-Thinking. This yields ChartVerse-SFT-600K and ChartVerse-RL-40K datasets; the resulting ChartVerse-8B model reportedly achieves SOTA performance, surpassing the teacher and rivaling Qwen3-VL-32B-Thinking.
Significance. If the performance claims hold under rigorous verification, the work would be significant for the field: it offers a programmatic route to high-complexity, hallucination-resistant chart reasoning data that scales beyond existing simplistic synthetic sets, directly supporting open-source VLM progress on visual reasoning tasks. The public release of code, weights, and datasets strengthens reproducibility and downstream utility.
major comments (3)
- [Abstract] Abstract: The headline claim that ChartVerse-8B surpasses its teacher Qwen3-VL-30B-A3B-Thinking and rivals Qwen3-VL-32B-Thinking is stated without any numerical metrics, error rates, ablation tables, or verification statistics on the consistency checks; this absence makes the central empirical result impossible to assess from the given text.
- [§3] §3 (RPE-guided synthesis and filtering): The RPE metric is presented as the key innovation for selecting high-complexity charts, yet no quantitative correlation is shown between RPE scores and downstream reasoning depth, nor any ablation comparing RPE-guided vs. random or heuristic filtering on held-out chart distributions.
- [Experiments] Experimental section: The pipeline uses the same teacher both to filter hard examples and to distill CoT, but no ablations are reported on real-world (non-synthetic) charts, alternative teacher models, or distribution-shift tests; this leaves the transferability assumption untested and load-bearing for the generalization claim.
minor comments (2)
- [§3.1] The formal definition and rollout procedure for RPE would benefit from an explicit equation or algorithm box to support independent re-implementation.
- [Figures/Tables] Table captions and axis labels in the results figures should explicitly state the evaluation benchmarks and whether numbers are reported on synthetic or real charts.
Simulated Author's Rebuttal
We thank the referee for the constructive feedback. We address each major comment below and will incorporate revisions to improve clarity and empirical support.
read point-by-point responses
-
Referee: [Abstract] The headline claim that ChartVerse-8B surpasses its teacher Qwen3-VL-30B-A3B-Thinking and rivals Qwen3-VL-32B-Thinking is stated without any numerical metrics, error rates, ablation tables, or verification statistics on the consistency checks.
Authors: We agree that the abstract should be self-contained with key numbers. In revision we will add specific metrics (e.g., absolute accuracy gains on ChartQA, PlotQA, and DocVQA), the pass rate of consistency verification (>92%), and a one-sentence summary of the main ablation outcomes. revision: yes
-
Referee: [§3] The RPE metric is presented as the key innovation yet no quantitative correlation is shown between RPE scores and downstream reasoning depth, nor any ablation comparing RPE-guided vs. random or heuristic filtering on held-out chart distributions.
Authors: We will add a correlation analysis (RPE vs. teacher fail-rate and reasoning-step count) and a new ablation table in §3.3 that compares RPE-guided synthesis against random sampling and heuristic baselines on held-out chart distributions, reporting downstream accuracy deltas. revision: yes
-
Referee: [Experiments] The pipeline uses the same teacher both to filter hard examples and to distill CoT, but no ablations are reported on real-world (non-synthetic) charts, alternative teacher models, or distribution-shift tests.
Authors: We will expand the experimental section with direct evaluations on real-world chart benchmarks (ChartQA, PlotQA) to demonstrate transfer. Alternative-teacher and explicit distribution-shift ablations will be added where computationally feasible; remaining cases will be discussed as limitations with supporting evidence from the current teacher-controlled setting. revision: partial
Circularity Check
No significant circularity detected in claimed derivation
full rationale
The paper presents an empirical pipeline for data synthesis (RPE-guided chart generation, answer-first QA extraction from code, fail-rate filtering, and teacher CoT distillation) followed by training and benchmarking of ChartVerse-8B. No equations, definitions, or steps reduce the reported performance numbers to the synthetic inputs by construction; the final SOTA claim is an external measurement against independent test distributions rather than a tautological restatement of the teacher outputs or fitted parameters. The use of the same teacher for data curation is a standard distillation choice and does not create a self-definitional or load-bearing self-citation loop within the derivation itself.
Axiom & Free-Parameter Ledger
axioms (1)
- domain assumption Executable chart generation code yields deterministic, hallucination-free answers
invented entities (1)
-
Rollout Posterior Entropy (RPE)
no independent evidence
Forward citations
Cited by 2 Pith papers
-
ConeSep: Cone-based Robust Noise-Unlearning Compositional Network for Composed Image Retrieval
ConeSep tackles noisy triplet correspondences in composed image retrieval by introducing geometric fidelity quantization to locate noise, negative boundary learning for semantic opposites, and targeted unlearning via ...
-
Air-Know: Arbiter-Calibrated Knowledge-Internalizing Robust Network for Composed Image Retrieval
Air-Know decouples MLLM-based external arbitration from proxy learning via knowledge internalization and dual-stream training to overcome noisy triplet correspondence in composed image retrieval.
Reference graph
Works this paper leans on
-
[1]
Anthropic. Claude 3.5 technical report. Technical report, Anthropic, 2025. URL https://www.anthropic. com/news/claude-3-family
work page 2025
-
[2]
Shuai Bai, Yuxuan Cai, Ruizhe Chen, Keqin Chen, Xionghui Chen, Zesen Cheng, Lianghao Deng, Wei Ding, Chang Gao, Chunjiang Ge, Wenbin Ge, Zhifang Guo, Qidong Huang, Jie Huang, Fei Huang, Binyuan Hui, Shutong Jiang, Zhaohai Li, Mingsheng Li, Mei Li, Kaixin Li, Zicheng Lin, Junyang Lin, Xuejing Liu, Jiawei Liu, Chenglong Liu, Yang Liu, Dayiheng Liu, Shixuan ...
-
[3]
URLhttps://arxiv.org/abs/2511.21631
work page internal anchor Pith review Pith/arXiv arXiv
-
[4]
Opendataarena: A fair and open arena for benchmarking post-training dataset value, 2025
Mengzhang Cai, Xin Gao, Yu Li, Honglin Lin, Zheng Liu, Zhuoshi Pan, Qizhi Pei, Xiaoran Shang, Mengyuan Sun, Zinan Tang, Xiaoyang Wang, Zhanping Zhong, Yun Zhu, Dahua Lin, Conghui He, and Lijun Wu. Opendataarena: A fair and open arena for benchmarking post-training dataset value, 2025. URL https: //arxiv.org/abs/2512.14051
-
[5]
Lei Chen, Xuanle Zhao, Zhixiong Zeng, Jing Huang, Yufeng Zhong, and Lin Ma. Chart-r1: Chain-of-thought supervision and reinforcement for advanced chart reasoner, 2025. URL https://arxiv.org/abs/2507.15509
-
[6]
Vlmevalkit: An open-source toolkit for evaluating large multi-modality models, 2024
Haodong Duan, Xinyu Fang, Junming Yang, Xiangyu Zhao, Yuxuan Qiao, Mo Li, Amit Agarwal, Zhe Chen, Lin Chen, Yuan Liu, Yubo Ma, Hailong Sun, Yifan Zhang, Shiyin Lu, Tack Hwa Wong, Weiyun Wang, Peiheng Zhou, Xiaozhe Li, Chaoyou Fu, Junbo Cui, Jixuan Chen, Enxin Song, Song Mao, Shengyuan Ding, Tianhao Liang, Zicheng Zhang, Xiaoyi Dong, Yuhang Zang, Pan Zhang...
-
[7]
Google DeepMind. Gemini 3 technical report. Technical report, Google, 2025. URL https://storage. googleapis.com/deepmind-media/Model-Cards/Gemini-3-Pro-Model-Card.pdf
work page 2025
-
[8]
Yucheng Han, Chi Zhang, Xin Chen, Xu Yang, Zhibin Wang, Gang Yu, Bin Fu, and Hanwang Zhang. Chartllama: A multimodal llm for chart understanding and generation, 2023. URL https://arxiv.org/abs/ 2311.16483
-
[9]
Distill visual chart reasoning ability from llms to mllms, 2025
Wei He, Zhiheng Xi, Wanxu Zhao, Xiaoran Fan, Yiwen Ding, Zifei Shan, Tao Gui, Qi Zhang, and Xuanjing Huang. Distill visual chart reasoning ability from llms to mllms, 2025. URL https://arxiv.org/abs/2410. 18798
work page 2025
-
[10]
Evochart: A benchmark and a self-training approach towards real-world chart understanding, 2025
Muye Huang, Han Lai, Xinyu Zhang, Wenjun Wu, Jie Ma, Lingling Zhang, and Jun Liu. Evochart: A benchmark and a self-training approach towards real-world chart understanding, 2025. URL https://arxiv. org/abs/2409.01577
-
[11]
Qwen2.5-Coder Technical Report
Binyuan Hui, Jian Yang, Zeyu Cui, Jiaxi Yang, Dayiheng Liu, Lei Zhang, Tianyu Liu, Jiajun Zhang, Bowen Yu, Keming Lu, Kai Dang, Yang Fan, Yichang Zhang, An Yang, Rui Men, Fei Huang, Bo Zheng, Yibo Miao, Shanghaoran Quan, Yunlong Feng, Xingzhang Ren, Xuancheng Ren, Jingren Zhou, and Junyang Lin. Qwen2.5-coder technical report, 2024. URLhttps://arxiv.org/ab...
work page internal anchor Pith review Pith/arXiv arXiv 2024
-
[12]
Caijun Jia, Nan Xu, Jingxuan Wei, Qingli Wang, Lei Wang, Bihui Yu, and Junnan Zhu. Chartreasoner: Code-driven modality bridging for long-chain reasoning in chart question answering, 2025. URL https: //arxiv.org/abs/2506.10116
-
[13]
Gongyao Jiang and Qiong Luo. Chart-coca: Self-improving chart understanding of vision lms via code-driven synthesis and candidate-conditioned answering, 2025. URLhttps://arxiv.org/abs/2508.11975
-
[14]
DVQA: Understanding Data Visualizations via Question Answering
Kushal Kafle, Brian Price, Scott Cohen, and Christopher Kanan. Dvqa: Understanding data visualizations via question answering, 2018. URLhttps://arxiv.org/abs/1801.08163
work page internal anchor Pith review Pith/arXiv arXiv 2018
-
[15]
FigureQA: An Annotated Figure Dataset for Visual Reasoning
Samira Ebrahimi Kahou, Vincent Michalski, Adam Atkinson, Akos Kadar, Adam Trischler, and Yoshua Bengio. Figureqa: An annotated figure dataset for visual reasoning, 2018. URL https://arxiv.org/abs/ 1710.07300. 12 ChartVerse: Scaling Chart Reasoning via Reliable Programmatic Synthesis from Scratch
work page internal anchor Pith review Pith/arXiv arXiv 2018
-
[16]
Chartgen: Scaling chart understanding via code-guided synthetic chart generation, 2025
Jovana Kondic, Pengyuan Li, Dhiraj Joshi, Zexue He, Shafiq Abedin, Jennifer Sun, Ben Wiesel, Eli Schwartz, Ahmed Nassar, Bo Wu, Assaf Arbelle, Aude Oliva, Dan Gutfreund, Leonid Karlinsky, and Rogerio Feris. Chartgen: Scaling chart understanding via code-guided synthetic chart generation, 2025. URL https: //arxiv.org/abs/2507.19492
-
[17]
Efficient Memory Management for Large Language Model Serving with PagedAttention
Woosuk Kwon, Zhuohan Li, Siyuan Zhuang, Ying Sheng, Lianmin Zheng, Cody Hao Yu, Joseph E. Gon- zalez, Hao Zhang, and Ion Stoica. Efficient memory management for large language model serving with pagedattention, 2023. URLhttps://arxiv.org/abs/2309.06180
work page internal anchor Pith review Pith/arXiv arXiv 2023
-
[18]
Mmc: Advancing multimodal chart understand- ing with large-scale instruction tuning
Fuxiao Liu, Xiaoyang Wang, Wenlin Yao, Jianshu Chen, Kaiqiang Song, Sangwoo Cho, Yaser Yacoob, and Dong Yu. Mmc: Advancing multimodal chart understanding with large-scale instruction tuning, 2024. URL https://arxiv.org/abs/2311.10774
-
[19]
Wong, Songyang Zhang, and Kai Chen
Shudong Liu, Hongwei Liu, Junnan Liu, Linchen Xiao, Songyang Gao, Chengqi Lyu, Yuzhe Gu, Wenwei Zhang, Derek F. Wong, Songyang Zhang, and Kai Chen. Compassverifier: A unified and robust verifier for llms evaluation and outcome reward, 2025. URLhttps://arxiv.org/abs/2508.03686
-
[20]
Synthvlm: High-efficiency and high-quality syn- thetic data for vision language models
Zheng Liu, Hao Liang, Bozhou Li, Wentao Xiong, Chong Chen, Conghui He, Wentao Zhang, and Bin Cui. Synthvlm: Towards high-quality and efficient synthesis of image-caption datasets for vision-language models, 2025. URLhttps://arxiv.org/abs/2407.20756
-
[21]
FLARE: Fully Integration of Vision-Language Representations for Deep Cross-Modal Understanding
Zheng Liu, Mengjie Liu, Jingzhou Chen, Jingwei Xu, Bin Cui, Conghui He, and Wentao Zhang. Fusion: Fully integration of vision-language representations for deep cross-modal understanding, 2025. URL https://arxiv.org/abs/2504.09925
work page internal anchor Pith review Pith/arXiv arXiv 2025
-
[22]
Start: Spatial and textual learning for chart understanding, 2025
Zhuoming Liu, Xiaofeng Gao, Feiyang Niu, Qiaozi Gao, Liu Liu, and Robinson Piramuthu. Start: Spatial and textual learning for chart understanding, 2025. URLhttps://arxiv.org/abs/2512.07186
-
[23]
MathVista: Evaluating Mathematical Reasoning of Foundation Models in Visual Contexts
Pan Lu, Hritik Bansal, Tony Xia, Jiacheng Liu, Chunyuan Li, Hannaneh Hajishirzi, Hao Cheng, Kai-Wei Chang, Michel Galley, and Jianfeng Gao. Mathvista: Evaluating mathematical reasoning of foundation models in visual contexts.arXiv preprint arXiv:2310.02255, 2023
work page internal anchor Pith review Pith/arXiv arXiv 2023
-
[24]
Chartqa: A benchmark for question answering about charts with visual and logical reasoning, 2022
Ahmed Masry, Do Xuan Long, Jia Qing Tan, Shafiq Joty, and Enamul Hoque. Chartqa: A benchmark for question answering about charts with visual and logical reasoning, 2022. URL https://arxiv.org/abs/2203. 10244
work page 2022
-
[25]
Chartinstruct: Instruction tuning for chart comprehension and reasoning
Ahmed Masry, Mehrad Shahmohammadi, Md Rizwan Parvez, Enamul Hoque, and Shafiq Joty. Chartinstruct: Instruction tuning for chart comprehension and reasoning, 2024. URL https://arxiv.org/abs/2403.09028
-
[26]
Chart- gemma: Visual instruction-tuning for chart reasoning in the wild, 2024
Ahmed Masry, Megh Thakkar, Aayush Bajaj, Aaryaman Kartha, Enamul Hoque, and Shafiq Joty. Chart- gemma: Visual instruction-tuning for chart reasoning in the wild, 2024. URL https://arxiv.org/abs/2407. 04172
work page 2024
-
[27]
Ahmed Masry, Mohammed Saidul Islam, Mahir Ahmed, Aayush Bajaj, Firoz Kabir, Aaryaman Kartha, Md Tahmid Rahman Laskar, Mizanur Rahman, Shadikur Rahman, Mehrad Shahmohammadi, Megh Thakkar, Md Rizwan Parvez, Enamul Hoque, and Shafiq Joty. Chartqapro: A more diverse and challenging benchmark for chart question answering, 2025. URLhttps://arxiv.org/abs/2504.05506
-
[28]
Fanqing Meng, Wenqi Shao, Quanfeng Lu, Peng Gao, Kaipeng Zhang, Yu Qiao, and Ping Luo. Chartassisstant: A universal chart multimodal language model via chart-to-table pre-training and multitask instruction tuning,
- [29]
-
[30]
Nitesh Methani, Pritha Ganguly, Mitesh M. Khapra, and Pratyush Kumar. Plotqa: Reasoning over scientific plots, 2020. URLhttps://arxiv.org/abs/1909.00997
-
[31]
MinerU2.5: A Decoupled Vision-Language Model for Efficient High-Resolution Document Parsing
Junbo Niu, Zheng Liu, Zhuangcheng Gu, Bin Wang, Linke Ouyang, Zhiyuan Zhao, Tao Chu, Tianyao He, Fan Wu, Qintong Zhang, Zhenjiang Jin, Guang Liang, Rui Zhang, Wenzheng Zhang, Yuan Qu, Zhifei Ren, Yuefeng Sun, Yuanhong Zheng, Dongsheng Ma, Zirui Tang, Boyu Niu, Ziyang Miao, Hejun Dong, Siyi Qian, Junyuan Zhang, Jingzhou Chen, Fangdong Wang, Xiaomeng Zhao, ...
work page internal anchor Pith review arXiv 2025
-
[32]
OpenAI. Gpt-5 system card. Technical report, OpenAI, 2025. URL https://cdn.openai.com/ gpt-5-system-card.pdf
work page 2025
-
[33]
Learning Transferable Visual Models From Natural Language Supervision
Alec Radford, Jong Wook Kim, Chris Hallacy, Aditya Ramesh, Gabriel Goh, Sandhini Agarwal, Girish Sastry, Amanda Askell, Pamela Mishkin, Jack Clark, Gretchen Krueger, and Ilya Sutskever. Learning transferable visual models from natural language supervision, 2021. URLhttps://arxiv.org/abs/2103.00020
work page internal anchor Pith review Pith/arXiv arXiv 2021
-
[34]
Hybridflow: A flexible and efficient rlhf framework
Guangming Sheng, Chi Zhang, Zilingfeng Ye, Xibin Wu, Wang Zhang, Ru Zhang, Yanghua Peng, Haibin Lin, and Chuan Wu. Hybridflow: A flexible and efficient rlhf framework. InProceedings of the Twentieth European Conference on Computer Systems, EuroSys ’25, page 1279–1297. ACM, March 2025. doi: 10.1145/ 3689031.3696075. URLhttp://dx.doi.org/10.1145/3689031.3696075
-
[35]
Chartmuseum: Testing visual reasoning capabilities of large vision-language models, 2025
Liyan Tang, Grace Kim, Xinyu Zhao, Thom Lake, Wenxuan Ding, Fangcong Yin, Prasann Singhal, Manya Wadhwa, Zeyu Leo Liu, Zayne Sprague, Ramya Namuduri, Bodun Hu, Juan Diego Rodriguez, Puyuan Peng, and Greg Durrett. Chartmuseum: Testing visual reasoning capabilities of large vision-language models, 2025. URLhttps://arxiv.org/abs/2505.13444
-
[36]
Internvl3.5: Advancing open-source multimodal models in versatility, reasoning, and efficiency,
Weiyun Wang, Zhangwei Gao, Lixin Gu, Hengjun Pu, Long Cui, Xingguang Wei, Zhaoyang Liu, Linglin Jing, Shenglong Ye, Jie Shao, Zhaokai Wang, Zhe Chen, Hongjie Zhang, Ganlin Yang, Haomin Wang, Qi Wei, Jinhui Yin, Wenhao Li, Erfei Cui, Guanzhou Chen, Zichen Ding, Changyao Tian, Zhenyu Wu, Jingjing Xie, Zehao Li, Bowen Yang, Yuchen Duan, Xuehui Wang, Zhi Hou,...
-
[37]
URLhttps://arxiv.org/abs/2508.18265
work page internal anchor Pith review Pith/arXiv arXiv
-
[38]
Zirui Wang, Mengzhou Xia, Luxi He, Howard Chen, Yitao Liu, Richard Zhu, Kaiqu Liang, Xindi Wu, Haotian Liu, Sadhika Malladi, Alexis Chevalier, Sanjeev Arora, and Danqi Chen. Charxiv: Charting gaps in realistic chart understanding in multimodal llms, 2024. URLhttps://arxiv.org/abs/2406.18521
-
[39]
Chartx & chartvlm: A versatile bench- mark and foundation model for complicated chart reasoning
Renqiu Xia, Bo Zhang, Hancheng Ye, Xiangchao Yan, Qi Liu, Hongbin Zhou, Zijun Chen, Peng Ye, Min Dou, Botian Shi, Junchi Yan, and Yu Qiao. Chartx & chartvlm: A versatile benchmark and foundation model for complicated chart reasoning, 2025. URLhttps://arxiv.org/abs/2402.12185
-
[40]
LogicVista: Multimodal LLM Logical Reasoning Benchmark in Visual Contexts
Yijia Xiao, Edward Sun, Tianyu Liu, and Wei Wang. Logicvista: Multimodal llm logical reasoning benchmark in visual contexts.arXiv preprint arXiv:2407.04973, 2024
work page internal anchor Pith review Pith/arXiv arXiv 2024
-
[41]
Duo Xu, Hao Cheng, Xin Lin, Zhen Xie, and Hao Wang. Chartm3: A multi-stage code-driven pipeline for constructing multi-dimensional and multi-step visual reasoning data in chart comprehension, 2025. URL https://arxiv.org/abs/2511.02415
-
[42]
Weiye Xu, Jiahao Wang, Weiyun Wang, Zhe Chen, Wengang Zhou, Aijun Yang, Lewei Lu, Houqiang Li, Xiaohua Wang, Xizhou Zhu, et al. Visulogic: A benchmark for evaluating visual reasoning in multi-modal large language models.arXiv preprint arXiv:2504.15279, 2025
-
[43]
Chartbench: A benchmark for complex visual reasoning in charts.arXiv preprint arXiv:2312.15915,
Zhengzhuo Xu, Sinan Du, Yiyan Qi, Chengjin Xu, Chun Yuan, and Jian Guo. Chartbench: A benchmark for complex visual reasoning in charts, 2024. URLhttps://arxiv.org/abs/2312.15915
-
[44]
Scaling text-rich image understanding via code-guided synthetic multimodal data generation, 2025
Yue Yang, Ajay Patel, Matt Deitke, Tanmay Gupta, Luca Weihs, Andrew Head, Mark Yatskar, Chris Callison- Burch, Ranjay Krishna, Aniruddha Kembhavi, and Christopher Clark. Scaling text-rich image understanding via code-guided synthetic multimodal data generation, 2025. URLhttps://arxiv.org/abs/2502.14846
-
[45]
Effective training data synthesis for improving mllm chart understanding, 2025
Yuwei Yang, Zeyu Zhang, Yunzhong Hou, Zhuowan Li, Gaowen Liu, Ali Payani, Yuan-Sen Ting, and Liang Zheng. Effective training data synthesis for improving mllm chart understanding, 2025. URL https://arxiv.org/abs/2508.06492. 14 ChartVerse: Scaling Chart Reasoning via Reliable Programmatic Synthesis from Scratch
-
[46]
Kaichen Zhang, Keming Wu, Zuhao Yang, Kairui Hu, Bin Wang, Ziwei Liu, Xingxuan Li, and Lidong Bing. Openmmreasoner: Pushing the frontiers for multimodal reasoning with an open and general recipe.arXiv preprint arXiv:2511.16334, 2025
-
[47]
Liang Zhang, Anwen Hu, Haiyang Xu, Ming Yan, Yichen Xu, Qin Jin, Ji Zhang, and Fei Huang. Tinychart: Efficient chart understanding with visual token merging and program-of-thoughts learning, 2024. URL https://arxiv.org/abs/2404.16635
-
[48]
Renrui Zhang, Dongzhi Jiang, Yichi Zhang, Haokun Lin, Ziyu Guo, Pengshuo Qiu, Aojun Zhou, Pan Lu, Kai-Wei Chang, Yu Qiao, et al. Mathverse: Does your multi-modal llm truly see the diagrams in visual math problems? InEuropean Conference on Computer Vision, pages 169–186. Springer, 2024
work page 2024
-
[49]
Chartcoder: Advancing multimodal large language model for chart-to-code generation, 2025
Xuanle Zhao, Xianzhen Luo, Qi Shi, Chi Chen, Shuo Wang, Zhiyuan Liu, and Maosong Sun. Chartcoder: Advancing multimodal large language model for chart-to-code generation, 2025. URL https://arxiv.org/ abs/2501.06598
-
[50]
Group Sequence Policy Optimization
Chujie Zheng, Shixuan Liu, Mingze Li, Xiong-Hui Chen, Bowen Yu, Chang Gao, Kai Dang, Yuqiong Liu, Rui Men, An Yang, Jingren Zhou, and Junyang Lin. Group sequence policy optimization, 2025. URL https://arxiv.org/abs/2507.18071
work page internal anchor Pith review Pith/arXiv arXiv 2025
-
[51]
LlamaFactory: Unified Efficient Fine-Tuning of 100+ Language Models
Yaowei Zheng, Richong Zhang, Junhao Zhang, Yanhan Ye, Zheyan Luo, Zhangchi Feng, and Yongqiang Ma. Llamafactory: Unified efficient fine-tuning of 100+ language models, 2024. URL https://arxiv.org/abs/ 2403.13372
work page internal anchor Pith review Pith/arXiv arXiv 2024
-
[52]
Chengke Zou, Xingang Guo, Rui Yang, Junyu Zhang, Bin Hu, and Huan Zhang. Dynamath: A dynamic visual benchmark for evaluating mathematical reasoning robustness of vision language models.arXiv preprint arXiv:2411.00836, 2024. 15 ChartVerse: Scaling Chart Reasoning via Reliable Programmatic Synthesis from Scratch Appendix A More Training Details We implement...
-
[53]
Implement: Write a standalone Python script that executes this logic to produce a single significant result (a specific number or a text label). ## Design Constraints (Difficulty Control) •Target Level: The logic must beaccessible to a High School student. •Linearity: Focus on clear, linear logic, but avoid trivial operations. ## Logic Architecture (The ”...
-
[54]
3.Structural Dependency: Do not simply process the dataset uniformly
Multi-Subplot Integration (CRITICAL): If the input code contains multiple subplots, your calcula- tion logicMUST synthesize data across at least 2 subplots. 3.Structural Dependency: Do not simply process the dataset uniformly
-
[55]
## Output Requirements 1.Data Context: A brief professional summary of what the data represents
Derived Aggregation: The final output must be a single synthesized value (numerical scalar OR categorical label). ## Output Requirements 1.Data Context: A brief professional summary of what the data represents. 2.Logic Blueprint: A step-by-step text description of the algorithm. 3.The Python Script (The Solution): •Self-Contained: Define all data lists ex...
-
[56]
The Analytical Question: The abstract, scenario-based question wrapped in <question>... </question>. ## Input Data
-
[57]
Original Visualization Code: {chart code}
-
[58]
The Solution Script (The Answer Logic): {generated python code} 27 ChartVerse: Scaling Chart Reasoning via Reliable Programmatic Synthesis from Scratch Table 12: Prompt for Inverse Logic Construction - Step 3: LLM Inference Step 3: LLM Inference Prompt ## Role You are an expert inChart Code ComprehensionandData Reasoning. Your task is to answer a specific...
-
[59]
Code as Data Source: Treat the Python code as a structured document containing the ground truth data. You do not need to ”run” the code, but you must ”read” and understand the variables (lists, dictionaries, values)
-
[60]
Semantic Mapping: Map the terms in the question to the corresponding variables and indices in the code
-
[61]
Logical Derivation: Based on the extracted data, perform the necessary logical reasoning to answer the question. ## Solution Framework Phase 1: Code Structure Analysis • Scan the code to identify key variables and data lists. • Understand the relationship between different lists (e.g.,x axis usually corresponds toy axis by index). Phase 2: Information Ext...
-
[63]
The last line of your response must be EXACTLY: ”Therefore, the final answer is <answer>ANSWER</answer>.” ## Input Data
-
[64]
Chart Code: {chart code}
-
[65]
Your response will be used as a high-quality example to train a new AI model
Question: {generated question} 28 ChartVerse: Scaling Chart Reasoning via Reliable Programmatic Synthesis from Scratch Table 13: Prompt for Vision-Language Model (VLM) CoT Distillation CoT Distillation Prompt ## Role You are an expert in science and visual reasoning with advanced capabilities in multimodal analysis. Your response will be used as a high-qu...
-
[66]
Equal Weight to All Inputs: Information from images is AS IMPORTANT as text. Never ignore visual elements. 2.Systematic Analysis: Follow a rigorous, reproducible approach. 3.Precision and Accuracy: Double-check all calculations. 4.Adaptive Reasoning: Choose the most appropriate method based on context. ## Solution Framework Phase 1: Comprehensive Informat...
-
[67]
The final result goes ONLY inside<answer>...</answer>tags
-
[68]
Include units inside the tags when required (e.g.,<answer>5.2 m/s</answer>)
-
[69]
The last line must be EXACTLY: ”Therefore, the final answer is<answer>ANSWER</answer>.” ## Input Data Problem: {question} (Visual Inputs are provided via the vLLM interface) 29
discussion (0)
Sign in with ORCID, Apple, or X to comment. Anyone can read and Pith papers without signing in.