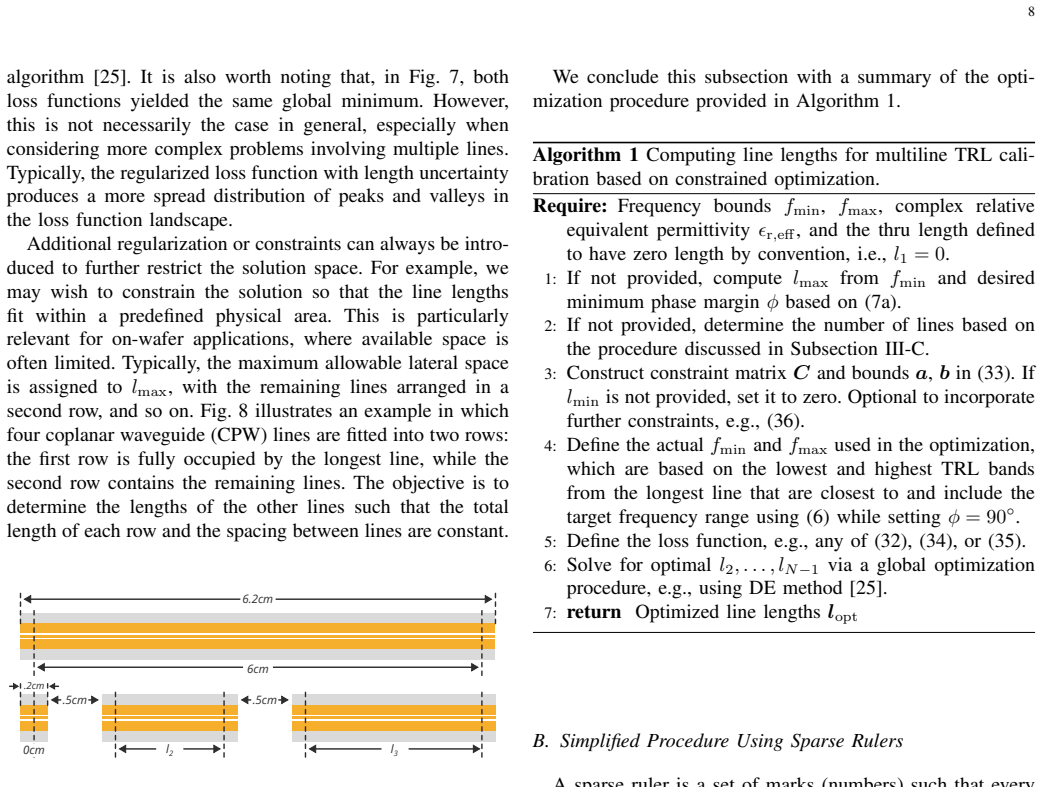
The Choice of Line Lengths in Multiline Thru-Reflect-Line Calibration
Pith reviewed 2026-05-16 21:06 UTC · model grok-4.3
The pith
Optimal line lengths for multiline TRL calibration are selected by nonlinear constrained optimization of the eigenvalue problem to spread uncertainty evenly across frequencies.
A machine-rendered reading of the paper's core claim, the machinery that carries it, and where it could break.
Core claim
The optimal lengths of the line standards are obtained through nonlinear constrained optimization of the eigenvalue problem that underlies multiline TRL calibration; a practical shortcut uses sparse rulers to select near-optimal sets. When these lengths are implemented, measurement-based Monte Carlo analysis that employs error boxes extracted from impedance-standard-substrate data shows that calibration uncertainty is distributed more evenly across the lines than occurs with a commercial calibration kit.
What carries the argument
Nonlinear constrained optimization of the multiline TRL eigenvalue problem, with sparse rulers as a fallback length-selection rule.
If this is right
- The required number of lines for a target bandwidth follows directly from the optimization constraints.
- The same length-selection procedure applies without change to lossy and dispersive transmission lines.
- Banded length solutions exist for waveguide calibrations.
- The method has been demonstrated on printed-circuit-board kits of varied materials and stackups up to 150 GHz.
Where Pith is reading between the lines
- The even distribution of uncertainty could allow engineers to cover the same bandwidth with fewer physical line standards than current practice requires.
- The sparse-ruler shortcut offers a quick manual design rule that avoids the need for numerical optimization software in routine work.
- The approach may be adapted to other multi-standard VNA calibration techniques that rely on eigenvalue solutions.
Load-bearing premise
The error boxes obtained from impedance standard substrate measurements capture the dominant uncertainty sources present in the multiline TRL measurements.
What would settle it
If a Monte Carlo simulation rerun with the same error boxes but using the commercial-kit lengths instead of the optimized lengths yields lower or equal peak uncertainty values across the band, the claim of more even distribution would be falsified.
Figures


read the original abstract
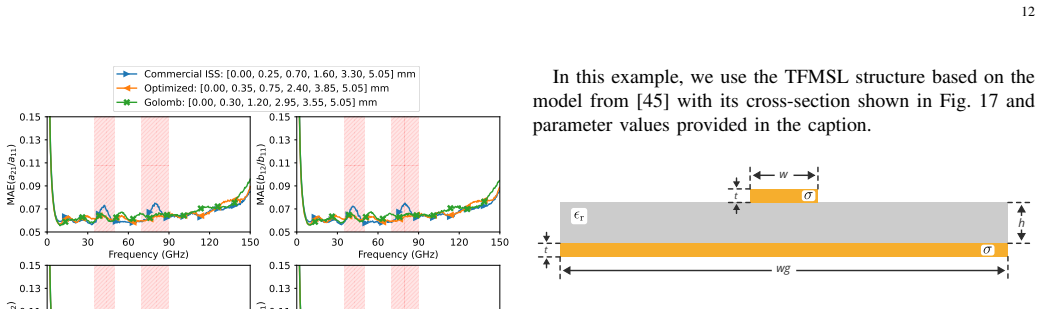
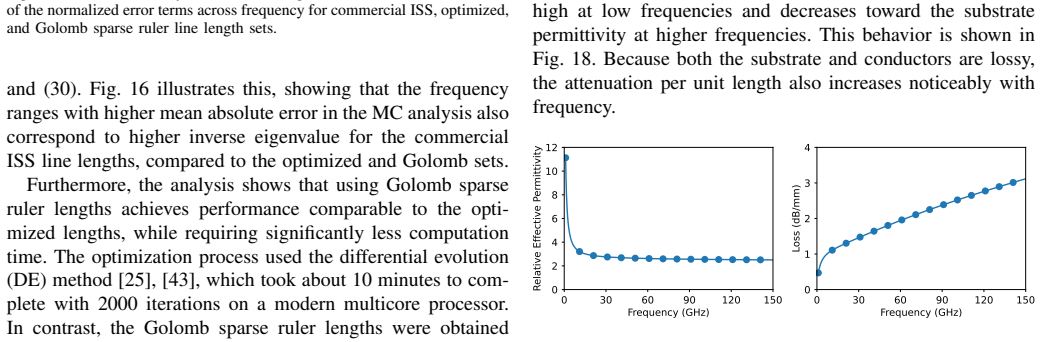
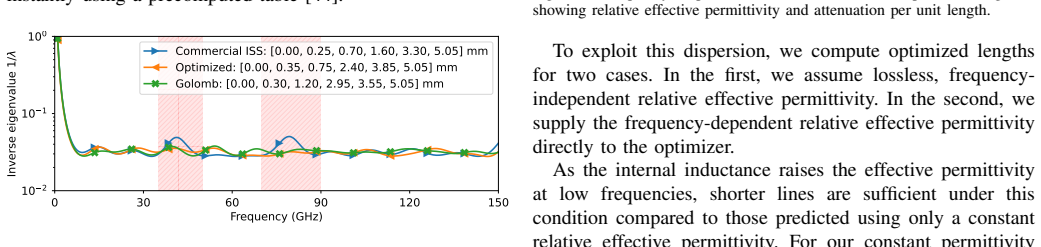
This paper presents an analysis and rigorous procedure for determining the optimal lengths of line standards in multiline thru-reflect-line (TRL) calibration of vector network analyzers (VNAs). The solution is obtained through nonlinear constrained optimization of the eigenvalue problem in multiline TRL calibration. Additionally, we propose a simplified approach for near-optimal length selection based on predefined sparse rulers. Alongside the length calculation, we discuss the required number of lines to meet bandwidth requirements. The proposed methods are validated through measurements of multiple multiline TRL calibration kits on printed circuit boards of different materials and stackups, covering frequencies up to 150 GHz. A measurement-based Monte Carlo uncertainty analysis, using error boxes derived from impedance standard substrate measurements, demonstrates that the proposed line lengths distribute calibration uncertainty more evenly across lines compared to a commercial calibration kit. Practical examples are provided for various applications, including lossy and dispersive lines, as well as banded solutions for waveguides.
Editorial analysis
A structured set of objections, weighed in public.
Referee Report
Summary. The paper claims to provide a nonlinear constrained optimization method for choosing optimal line lengths in multiline TRL calibration by optimizing the eigenvalue problem, along with a sparse ruler based heuristic for near-optimal selection. It addresses the number of lines required for sufficient bandwidth and validates the approach with measurements on various PCB kits up to 150 GHz. A Monte Carlo uncertainty analysis using error boxes from impedance standard substrate measurements is used to show that the proposed lengths distribute calibration uncertainty more evenly than a commercial calibration kit. Examples for lossy, dispersive lines and waveguides are included.
Significance. If the uncertainty model holds, the result would be significant for improving VNA calibration accuracy in high-frequency PCB applications. The measurement validation across multiple materials and the Monte Carlo analysis provide empirical grounding, while the heuristic offers a practical alternative to full optimization; these elements could help standardize better line selection practices.
major comments (1)
- [Monte Carlo uncertainty analysis] Monte Carlo uncertainty analysis: the demonstration that proposed lengths distribute uncertainty more evenly than the commercial kit rests on error boxes derived from ISS measurements as the uncertainty model. The manuscript does not show that these boxes capture all dominant sources (probe contact repeatability, fabrication tolerances, substrate variations) up to 150 GHz across the tested materials, which directly affects the strength of the empirical superiority claim.
minor comments (2)
- [Abstract] The abstract refers to a 'rigorous procedure' without naming the objective function or constraints; adding one sentence on the optimization formulation would improve clarity.
- [Results figures] Figures comparing uncertainty distributions should explicitly label the proposed lengths versus the commercial kit and include error bars from the Monte Carlo runs for direct visual assessment.
Simulated Author's Rebuttal
We thank the referee for the detailed review and constructive comments on our manuscript. We provide a point-by-point response to the major comment below.
read point-by-point responses
-
Referee: [Monte Carlo uncertainty analysis] Monte Carlo uncertainty analysis: the demonstration that proposed lengths distribute uncertainty more evenly than the commercial kit rests on error boxes derived from ISS measurements as the uncertainty model. The manuscript does not show that these boxes capture all dominant sources (probe contact repeatability, fabrication tolerances, substrate variations) up to 150 GHz across the tested materials, which directly affects the strength of the empirical superiority claim.
Authors: We appreciate the referee's observation regarding the scope of the uncertainty model. The Monte Carlo analysis employs error boxes extracted from repeated ISS measurements to model the calibration uncertainty, following established practices in the literature for VNA calibration studies. This approach captures the combined effects observed in the measurement setup, including contributions from probe positioning and contact variations during the calibration process itself. Nevertheless, we acknowledge that explicitly quantifying every possible source, such as long-term fabrication tolerances or material variations across different batches, would require additional extensive experiments beyond the scope of this work. In the revised manuscript, we will expand the discussion in the uncertainty analysis section to explicitly state the assumptions underlying the error model and qualify the comparison as being valid under the measured variability from the ISS standards. This will ensure the empirical results are presented with appropriate caveats, while preserving the demonstration that the optimized lengths provide a more uniform uncertainty distribution within this framework. We believe this addresses the concern without necessitating changes to the optimization procedure or the measurement data. revision: partial
Circularity Check
Optimization on standard multiline TRL eigenvalue problem; Monte Carlo uses independent ISS error boxes
full rationale
The derivation applies nonlinear constrained optimization directly to the established multiline TRL eigenvalue problem to select line lengths, then validates via Monte Carlo sampling of error boxes obtained from separate ISS measurements. Neither the optimization criterion nor the uncertainty propagation reduces to a fitted parameter defined by the target distribution itself, nor does any load-bearing step collapse to a self-citation chain or ansatz smuggled from prior author work. The result remains self-contained against the standard TRL formulation and external measurement data.
Axiom & Free-Parameter Ledger
axioms (1)
- domain assumption The multiline TRL calibration can be expressed as a well-posed eigenvalue problem whose solution depends on line lengths.
discussion (0)
Sign in with ORCID, Apple, or X to comment. Anyone can read and Pith papers without signing in.