Single Change-Point Detection via Energy Distance with Application to Genomic Data
Pith reviewed 2026-05-09 18:34 UTC · model grok-4.3
The pith
Energy distance yields an asymptotically normal statistic for any fixed split, with the scan maximum calibrated by permutation to control type I error under exchangeability.
A machine-rendered reading of the paper's core claim, the machinery that carries it, and where it could break.
Core claim
The central discovery is a change-point test based on energy distance whose fixed-split version is asymptotically standard normal under the null and whose global version, the maximum over candidate splits, is calibrated by permutation to achieve exact type I error control under exchangeability, while exhibiting greater robustness to distributional misspecification than competing procedures.
What carries the argument
The standardized energy-distance statistic Z_{n,k} for each candidate split k, together with the scan statistic T_n = max |Z_{n,k}| whose critical values are obtained from a permutation distribution.
If this is right
- The procedure applies without distributional assumptions to any sequence of independent observations.
- Permutation calibration supplies finite-sample type I error control under the stated exchangeability condition.
- Binary segmentation extends the single-change test to consistent estimation of multiple change points.
- The asymptotic normality result supplies a basis for power calculations under fixed or local alternatives.
Where Pith is reading between the lines
- The robustness across error distributions suggests the method is well suited to genomic copy-number data whose marginal laws are rarely known in advance.
- The same energy-distance construction could be applied directly to multivariate or functional observations without further modification.
Load-bearing premise
The observations are independent and the entire sequence is exchangeable under the null hypothesis of no change point.
What would settle it
A Monte Carlo experiment in which independent but non-exchangeable data under the null produce permutation p-values whose distribution deviates systematically from uniform would show that the type I error control fails.
Figures


read the original abstract
In this paper, we develop and analyze a nonparametric procedure for detecting a single change point in sequences of independent observations using energy distance. The asymptotic properties of the test statistic are derived under both null and alternative hypotheses. Under the null hypothesis, for any fixed candidate split point, the standardized statistic $\mathcal{Z}_{n,k}$ converges to a standard normal limit. For global detection, we use the scan statistic $T_n=\max_{k\in K_\eta}|\mathcal{Z}_{n,k}|$ and calibrate critical values using a permutation test, which yields valid type I error control under exchangeability. The simulation study shows that the proposed method demonstrates much better robustness across various error distributions. To handle multiple change points in practical applications, the method is combined with a binary segmentation approach. The breast cancer cell line (MDA157) from cDNA microarray CGH data is used to illustrate the detection and estimation capabilities of the proposed method for genomic sequences.
Editorial analysis
A structured set of objections, weighed in public.
Referee Report
Summary. The manuscript develops a nonparametric procedure for single change-point detection in sequences of independent observations based on the energy distance. Under the null, the standardized statistic Z_{n,k} for any fixed candidate split point k is shown to converge to a standard normal limit. Global detection uses the scan statistic T_n = max_{k in K_η} |Z_{n,k}| with critical values obtained from a permutation test, which is claimed to yield valid type-I error control under exchangeability. Simulations indicate superior robustness across error distributions relative to competitors, and the method is extended to multiple change points via binary segmentation with an illustration on breast cancer CGH microarray data.
Significance. If the central claims hold, the work supplies a distribution-free change-point procedure grounded in U-statistic theory, with exact finite-sample type-I control via permutation and demonstrated robustness in simulations. The permutation calibration for the scan statistic is a clear strength because it sidesteps the need for extreme-value asymptotics on the maximum. The genomic application shows practical relevance. Credit is given for the standard CLT argument for the fixed-split statistic and for avoiding circularity in the calibration device.
minor comments (3)
- The abstract states that Z_{n,k} converges to a standard normal but does not display the explicit form of the standardization (i.e., the consistent variance estimator). This should be written out in the methods section with the corresponding equation number.
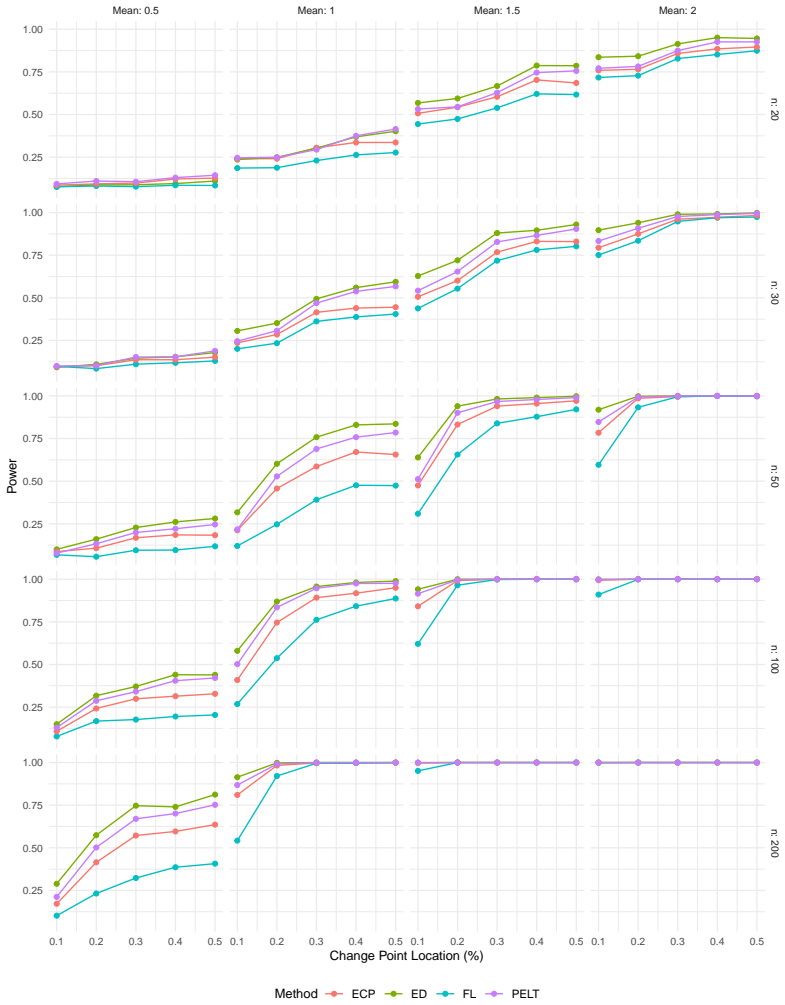
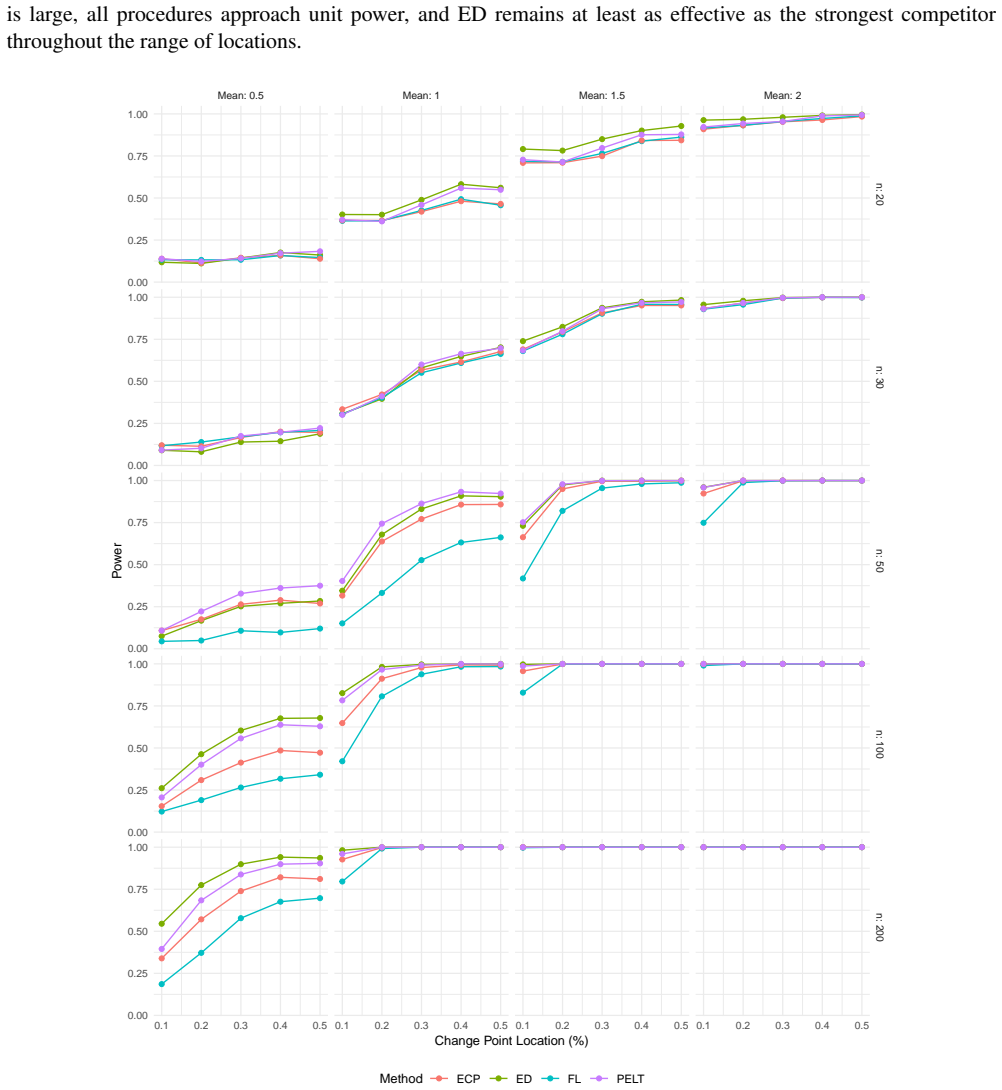
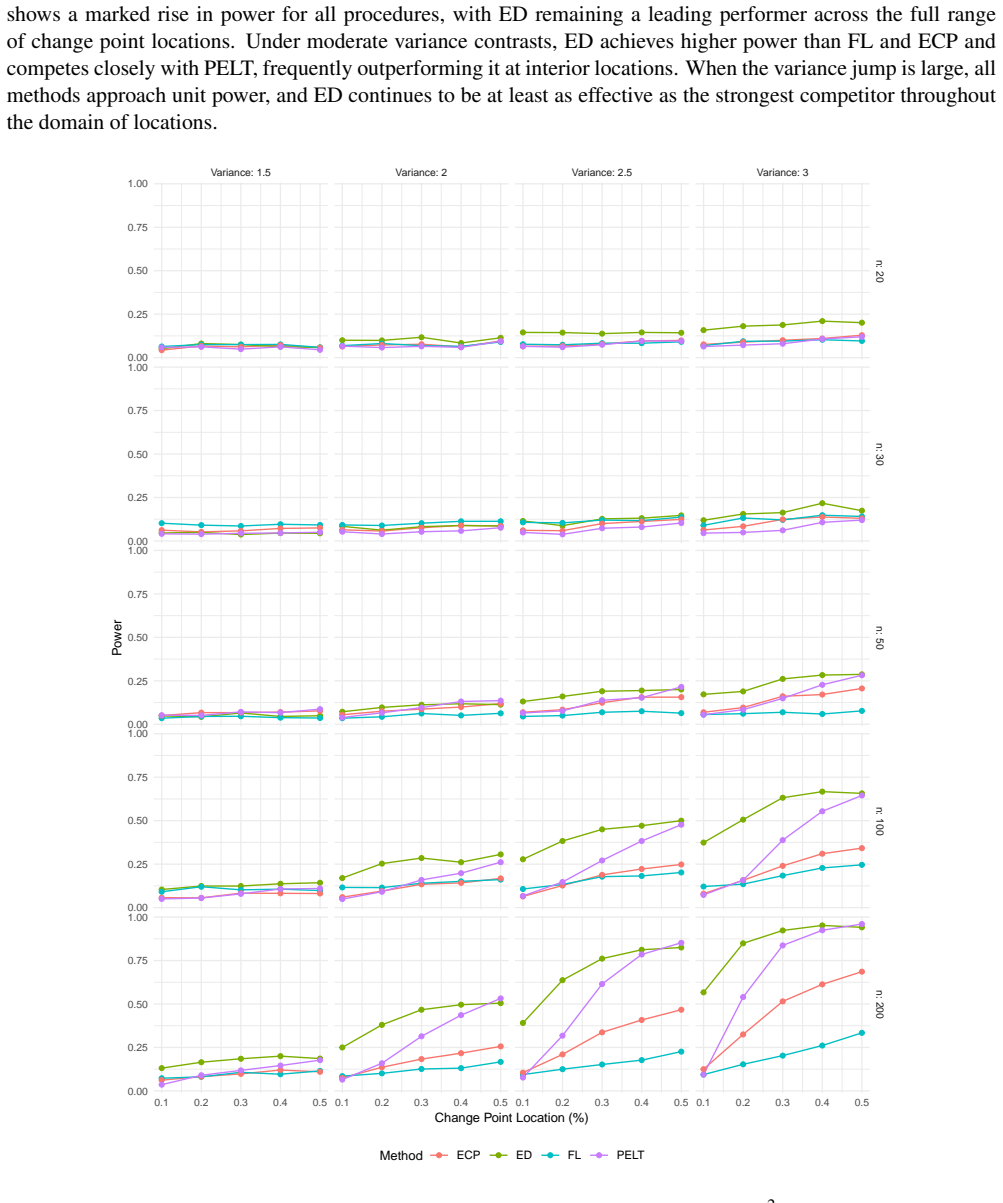
- The simulation study asserts 'much better robustness' across error distributions; reporting power or type-I error with standard errors (or at least the number of Monte Carlo replications) would make the quantitative comparisons more convincing.
- The range of the candidate set K_η (the η-trimmed interval of possible split points) is referenced but not defined explicitly; a short paragraph or equation in §2 would remove ambiguity for readers.
Simulated Author's Rebuttal
We thank the referee for the positive assessment of our manuscript and the recommendation for minor revision. No specific major comments were provided in the report, so we have no points to address at this time. We appreciate the recognition of the distribution-free nature of the procedure, the exact type-I error control via permutation, and the practical illustration on genomic data. We remain available to incorporate any additional feedback if the referee has further points to raise.
Circularity Check
No significant circularity
full rationale
The paper's central claims rest on standard U-statistic CLT arguments for the fixed-k energy-distance statistic Z_{n,k} converging to N(0,1) under the null (independent observations) and on the permutation test's type-I control for the scan statistic T_n under exchangeability. Both follow from general theory external to the paper's equations and do not reduce by construction to any fitted parameter, self-definition, or self-citation chain within the manuscript. The derivation is therefore self-contained.
Axiom & Free-Parameter Ledger
axioms (2)
- domain assumption Observations are independent
- domain assumption Exchangeability under the null hypothesis
Reference graph
Works this paper leans on
-
[1]
Abraham, B., & Wei, W. (1984). Inferences about the parameters of a time series model with changing variance. Metrika,31, 183-–194
work page 1984
-
[2]
Bhattacharya, G., & Johnson, R. (1968). Non-parametric tests for shift at an unknown time point.Annals of Mathematical Statistics,39, 1731—1743
work page 1968
-
[3]
C., Horv ´ath, L., & Jacobs, P
Boniece, B. C., Horv ´ath, L., & Jacobs, P. M. (2024). Change point detection in high dimensional datawith u-statistics.TEST,33, 400–452
work page 2024
-
[4]
Brodsky, B. E., & Darkhovsky, B. S. (1993). Nonparametric methods in change point problems.Kluwer Academic Publishers
work page 1993
-
[5]
Chen, H., & Friedman, J. H. (2017). A new graph-based two-sample test for multivariate and non-euclidean data. Journal of the American Statistical Association,112(517), 397–409
work page 2017
-
[6]
Chen, J., & Gupta, A. (1997). Testing and locating variance change points with application to stock prices.Journal of the American Statistical Association,92, 739—747
work page 1997
-
[7]
Chernoff, H., & Zacks, S. (1964). Estimating the current mean of a normal distribution which is subject to changes in time.Annals of Mathematical Statistics,35, 999—1018. Cs¨org¨o, M., & Horv´ath, L. (1997). Limit theorems in change-point analysis.New York: Wiley & Sons
work page 1964
-
[8]
Davis, W. (1979). Robust methods for detection of shifts of the innovation variance of a time series.Technometrics, 21, 313-–320. 23
work page 1979
-
[9]
Dehling, H., Vuk, K., & Wendler, M. (2022). Change-point detection based on weighted two-sample u-statistics. Electronic Journal of Statistics,16(1), 862–891
work page 2022
-
[10]
Frick, K., Munk, A., & Sieling, H. (2014). Multiscale change point inference.Journal of the Royal Statistical Society: Series B (Statistical Methodology),76(3), 495–580
work page 2014
-
[11]
Fryzlewicz, P. (2014). Wild binary segmentation for multiple change-point detection.The Annals of Statistics, 42(6), 2243–2281
work page 2014
-
[12]
Gardner, L. (1969). On detecting changes in the mean of normal variables.Annals of Mathematical Statistics,40, 116–126
work page 1969
-
[13]
Gomboy, E. (2001). U-statistics for change under alternatives.Journal of Multivariate Analysis,78, 139-158
work page 2001
-
[14]
Gomboy, E., & Horv ´ath, L. (1995). An application of u-statistics to change-point analysis.Acta Sci.Math. (Szeged),60, 345–357
work page 1995
-
[15]
Gretton, A., Borgwardt, K. M., Rasch, M. J., Sch ¨olkopf, B., & Smola, A. (2012). A kernel two-sample test. Journal of Machine Learning Research,13(1), 723–773
work page 2012
-
[16]
Gupta, A., & Chen, J. (1996). Detecting changes of mean in multidimensional normal sequences with application to literature and geology.Computational Statistics,11, 211-–221
work page 1996
-
[17]
Hawkins, D. M. (1977). Testing a sequence of observations for a shift in location.Journal of the American Statistical Association,72(357), 180–186
work page 1977
-
[18]
Hoeffding, W. (1948). A class of statistics with asymptotically normal distribution.Annals of Mathematical Statistics,19(3), 293-325
work page 1948
-
[19]
Hsu, D. (1977). Tests for variance shifts at an unknown time point.Applied Statistics,26, No.3, 279-–284
work page 1977
-
[20]
Kirch, C., & Stoehr, C. (2021). Sequential change point tests based on u-statistics.Scandinavian Journal of Statistics,49(3), 1184-1214
work page 2021
-
[21]
Kirch, C., & Stoehr, C. (2022). Asymptotic delay times of sequential tests based on u-statistics for early and late change points.Journal of Statistical Planning and Inference,221, 114-135. Kov´acs, S., B ¨uhlmann, P., Li, H., & Munk, A. (2020). Seeded binary segmentation: a general methodology for fast and optimal change point detection.Biometrika,113(4)...
work page 2022
-
[22]
Li, S., Xie, Y ., Dai, H., & Song, L. (2019). M-statistic for kernel change-point detection.Advances in Neural Information Processing Systems,32
work page 2019
-
[23]
Matteson, D. S., & James, N. A. (2014). ecp: An R package for nonparametric multiple change point analysis of multivariate data.Journal of Statistical Software,57(10), 1–25
work page 2014
-
[24]
Pettitt, A. N. (1979). A nonparametric approach to the change-point problem.Journal of the Royal Statistical Society Series C,28(2), 126-135
work page 1979
-
[25]
Rizzo, M. L. (2009). New goodness-of-fit tests for pareto distributions.Astin Bull,39(2), 691-715
work page 2009
-
[26]
Rizzo, M. L., & Haman, J. (2016). Expected distances and goodness-of-fit for the asymmetric laplace distribution. Statisc. Probab. Lett.,117, 158-164
work page 2016
-
[27]
Rizzo, M. L., & Sz´ekely, G. J. (2016). Energy distance.WIREs Comput. Stat.,8(1), 27–38
work page 2016
-
[28]
Srivastava, M. S., & Worsley, K. J. (1986). Likelihood ratio tests for a change in the multivariate mean.ournal of the American Statistical Association,81, 199–204. 24 Sz´ekely, G. J. (2000). E-statistics: Energy of statistical samples. Technical report.BGSU, Department of Mathe- matics and Statistics,03-05. Sz´ekely, G. J., & Rizzo, M. L. (2004). Testing...
work page 1986
-
[29]
Tibshirani, R., & Wang, P. (2008). Spatial smoothing and hot spot detection for cgh data using the fused lasso. Biostatistics,9, 18-29
work page 2008
-
[30]
Wegner, L., & Wendler, M. (2024). Robust change-point detection for functional time series based on u-statistics and dependent wild bootstrap.Statistical Papers,65, 4767–4810. 25
work page 2024
discussion (0)
Sign in with ORCID, Apple, or X to comment. Anyone can read and Pith papers without signing in.