Continuous Timing Signals for Growth-Defensive Style Allocation: Factor Attribution, Risk Matching, and Out-of-Sample Evidence
Pith reviewed 2026-05-21 02:31 UTC · model grok-4.3
The pith
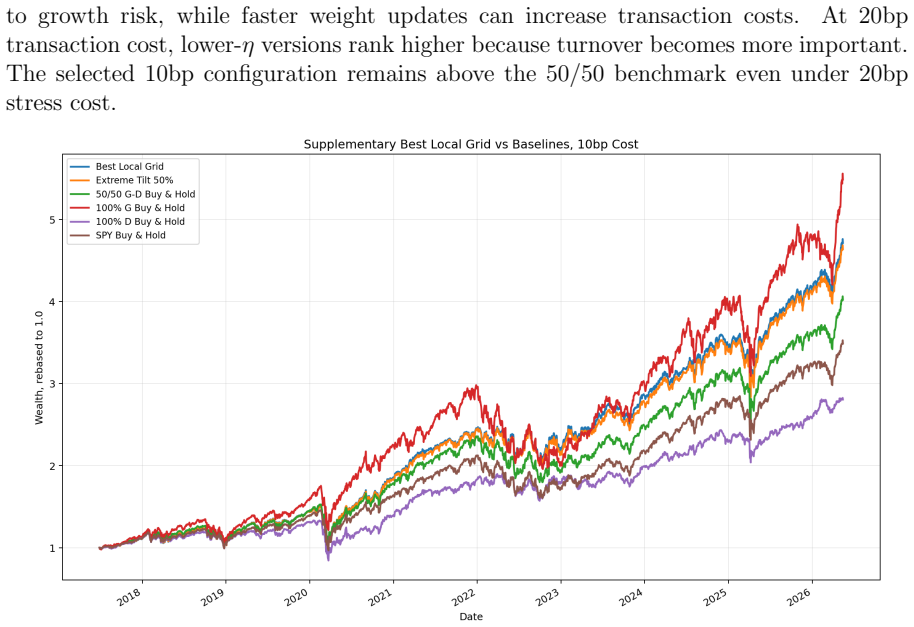
A continuous smooth score from rate relief, drawdown depth, VIX stress and growth crowding can allocate between growth and defensive ETF baskets to deliver a Sharpe ratio of 1.01 and maximum drawdown of 31.63 percent in 2017-2026 tests.
A machine-rendered reading of the paper's core claim, the machinery that carries it, and where it could break.
Core claim
The relative growth-minus-defensive portfolio exhibits recognizable style betas (market 0.273, HML -0.552, momentum 0.117) and negligible alpha, and a continuous timing rule built from rate relief, SPY drawdown depth, high-VIX relief, and a growth-crowding penalty improves risk-adjusted performance and drawdown control over static and partially matched benchmarks while leaving high static growth exposure as a tough total-return benchmark.
What carries the argument
The continuous smooth score that combines rate relief, SPY drawdown depth, high-VIX stress relief, and a growth-crowding penalty through softplus interaction terms, maps total score to G/D weights via hyperbolic tangent, and smooths realized weights with EWMA.
If this is right
- The policy improves Sharpe ratio and drawdown control relative to 50/50, TNX-only, core-only, SPY, and volatility-matched 100 percent G benchmarks.
- Walk-forward and post-2022 checks support drawdown reduction and risk-adjusted value beyond the main sample.
- Continuous, interpretable timing adds measurable allocation value even though it does not surpass the best high-growth static portfolios in raw CAGR.
- The underlying G-D return series behaves as a recognizable style portfolio rather than a new anomaly.
Where Pith is reading between the lines
- The same continuous-score construction could be applied to other style pairs such as value-momentum or quality-low-volatility.
- Replacing the fixed 50 percent tilt limit with a volatility-scaled version might further improve the risk-return profile in high-volatility regimes.
- Testing the score on individual stocks or futures instead of ETF baskets would show whether the timing logic scales beyond basket-level implementation.
Load-bearing premise
The specific functional form that combines the four macro conditions through softplus interactions and tanh mapping will keep delivering effective timing outside the 2017-2026 window without material overfitting to the chosen signals or period.
What would settle it
A new multi-year window after May 2026 in which the smooth-score policy shows both lower Sharpe ratio and larger maximum drawdown than the 50/50 G/D benchmark would falsify the claim of reliable timing value.
Figures


read the original abstract
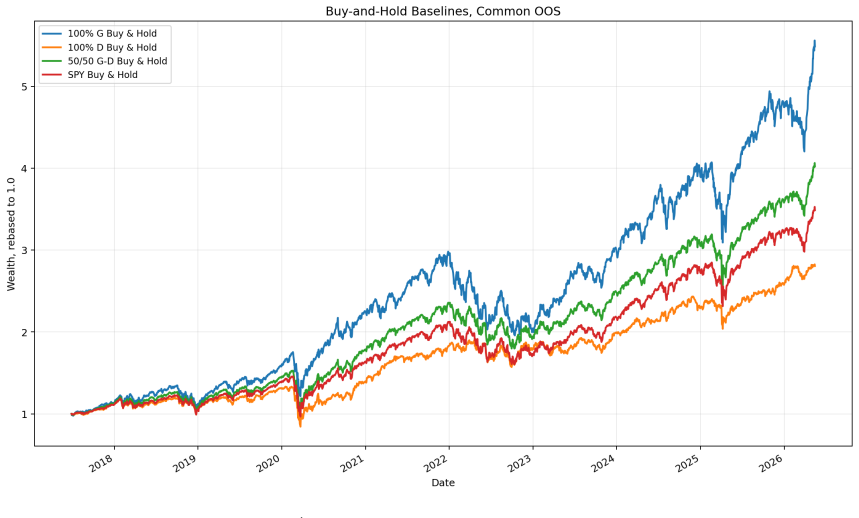
This paper studies conditional allocation between a growth/technology ETF basket, denoted by $G$, and a defensive income/value-oriented ETF basket, denoted by $D$. The objective is not to discover a new standalone alpha factor, but to examine whether known style exposures can be dynamically allocated using macro-market timing signals. Fama-French five-factor plus momentum attribution shows that the relative portfolio $G-D$ is a recognizable style portfolio: its market beta is 0.273, its HML beta is -0.552, its momentum beta is 0.117, and its annualized alpha is 1.95\% with a Newey-West t-statistic of only 0.81. The empirical object is therefore interpreted as a growth-versus-defensive style allocation problem rather than a new return anomaly. The allocation framework replaces discrete regime labels and if-then trading rules with a continuous smooth score. The score combines rate relief, SPY drawdown depth, high-VIX stress relief, and a growth-crowding penalty. Interaction terms are smoothed with softplus functions, the total score is mapped to G/D weights through a hyperbolic tangent function, and realized weights are smoothed with EWMA. In the main aligned comparison window from June 28, 2017 to May 15, 2026, with 10bp transaction costs, the selected smooth-score policy uses a 50\% maximum active tilt and obtains a 19.24\% CAGR, a Sharpe ratio of 1.01, and a maximum drawdown of -31.63\%. It improves over 50/50 G/D, matched TNX-only, matched core-only, SPY, and volatility-matched 100\% G benchmarks. It does not, however, exceed 100\% G or the best high-G static portfolios in raw CAGR. Walk-forward and post-2022 validations provide additional evidence of drawdown reduction and risk-adjusted allocation value. Overall, the evidence supports continuous, interpretable style timing, while also showing that high static growth exposure remains a strong benchmark.
Editorial analysis
A structured set of objections, weighed in public.
Referee Report
Summary. The paper examines dynamic allocation between a growth/technology ETF basket (G) and a defensive income/value ETF basket (D) using a continuous smooth timing score rather than discrete regimes. The score integrates rate relief, SPY drawdown depth, high-VIX stress relief, and a growth-crowding penalty via softplus interactions, maps the result through a hyperbolic tangent, applies EWMA smoothing, and caps the active tilt at 50%. Fama-French five-factor plus momentum attribution shows the G-D spread has market beta 0.273, HML beta -0.552, momentum beta 0.117, and insignificant alpha (1.95%, NW t-stat 0.81). In the June 28, 2017–May 15, 2026 window with 10 bp costs, the policy delivers 19.24% CAGR, Sharpe ratio 1.01, and max drawdown -31.63%, outperforming 50/50 G/D, TNX-matched, core-matched, SPY, and volatility-matched 100% G benchmarks but not 100% G or top static high-G portfolios. Walk-forward and post-2022 checks are cited as supporting evidence.
Significance. If the continuous timing rule proves robust, the work supplies a practical, interpretable alternative to regime-switching for style allocation that demonstrably reduces drawdowns while preserving growth exposure. The explicit factor attribution and risk-matched benchmarks help situate the results within existing style literature rather than claiming a new anomaly. The emphasis on out-of-sample validation and transaction-cost realism is a positive feature for applied portfolio-management research.
major comments (3)
- [Section 3] Timing-score construction (Section 3, around the softplus-tanh-EWMA definition): the specific functional form that combines the four signals through softplus interactions, applies tanh mapping, and uses EWMA smoothing with the 50% tilt cap contains multiple tunable elements whose selection process is not fully documented. Even with walk-forward validation, it is unclear whether these choices were fixed ex ante or refined on the 2017-2026 sample; this directly affects the credibility of the headline 19.24% CAGR and Sharpe 1.01 as generalizable rather than sample-specific.
- [Section 5] Out-of-sample and post-2022 validation (Section 5 or 6): the abstract states that walk-forward and post-2022 checks support drawdown reduction, yet it is not explicit whether the identical fixed functional form and parameter values were applied without any re-calibration on the later sub-period. If any component weights or smoothing constants were adjusted, the reported risk-adjusted improvement over volatility-matched benchmarks would require re-evaluation.
- [Table 2] Benchmark comparisons (Table 2 or equivalent results table): while the strategy improves on 50/50 G/D and matched benchmarks, it does not exceed 100% G or the best static high-G portfolios in raw CAGR. This limitation should be stated more prominently when interpreting the economic value of the timing overlay, as the central claim of “allocation value” rests partly on risk-adjusted metrics that may be sensitive to the chosen volatility-matching procedure.
minor comments (3)
- [Section 4] Clarify the exact definition of the “aligned comparison window” and how the 10 bp transaction-cost assumption is implemented (round-trip or one-way) in the performance calculations.
- [Section 2] The Newey-West t-statistic of 0.81 for the alpha in the factor attribution should be accompanied by the lag length chosen and a brief robustness check to alternative lag specifications.
- [Section 1] Notation for the G and D baskets and the precise ETF constituents could be listed in a table or appendix for reproducibility.
Simulated Author's Rebuttal
We thank the referee for the constructive comments on our manuscript. We have prepared point-by-point responses to the major comments and indicate where revisions will be made to improve clarity and address the concerns raised.
read point-by-point responses
-
Referee: [Section 3] Timing-score construction (Section 3, around the softplus-tanh-EWMA definition): the specific functional form that combines the four signals through softplus interactions, applies tanh mapping, and uses EWMA smoothing with the 50% tilt cap contains multiple tunable elements whose selection process is not fully documented. Even with walk-forward validation, it is unclear whether these choices were fixed ex ante or refined on the 2017-2026 sample; this directly affects the credibility of the headline 19.24% CAGR and Sharpe 1.01 as generalizable rather than sample-specific.
Authors: The functional form was developed based on economic considerations and insights from existing macro timing literature, with parameters selected to reflect reasonable sensitivities prior to examining the full sample results. To enhance transparency, we will revise Section 3 to provide a more detailed account of the rationale for each component, including the choice of softplus for interactions, the tanh mapping, EWMA smoothing parameter, and the 50% tilt cap. We will also explicitly state that these choices were fixed before conducting the main empirical analysis and that the walk-forward procedure applied the pre-specified form without further optimization on the 2017-2026 data. revision: yes
-
Referee: [Section 5] Out-of-sample and post-2022 validation (Section 5 or 6): the abstract states that walk-forward and post-2022 checks support drawdown reduction, yet it is not explicit whether the identical fixed functional form and parameter values were applied without any re-calibration on the later sub-period. If any component weights or smoothing constants were adjusted, the reported risk-adjusted improvement over volatility-matched benchmarks would require re-evaluation.
Authors: We confirm that the exact same functional form, including all weights, interaction terms, mapping functions, smoothing constants, and the 50% tilt cap, was applied without any re-calibration or adjustment in the walk-forward tests and the post-2022 sub-period. No parameters were tuned based on the later data. We will add a clear statement in the revised Section 5 to this effect to remove any ambiguity. revision: yes
-
Referee: [Table 2] Benchmark comparisons (Table 2 or equivalent results table): while the strategy improves on 50/50 G/D and matched benchmarks, it does not exceed 100% G or the best static high-G portfolios in raw CAGR. This limitation should be stated more prominently when interpreting the economic value of the timing overlay, as the central claim of “allocation value” rests partly on risk-adjusted metrics that may be sensitive to the chosen volatility-matching procedure.
Authors: We agree that this limitation merits more prominent discussion. Although the manuscript already notes in the abstract and introduction that the strategy does not exceed 100% G in raw CAGR, we will expand the interpretation section to more explicitly highlight this point. We will clarify that the primary benefits of the continuous timing approach are in risk-adjusted performance and drawdown mitigation, and discuss the sensitivity of these metrics to the volatility-matching procedure used for benchmarks. This will provide a more balanced view of the economic value. revision: yes
Circularity Check
No significant circularity: score constructed from observables, performance measured externally
full rationale
The paper defines a continuous allocation score by combining observable market signals (rate relief, SPY drawdown depth, high-VIX relief, growth-crowding penalty) via explicit functional forms: softplus for interactions, hyperbolic tangent for weight mapping, and EWMA for smoothing. These forms are stated as design choices, not derived from the target G-D returns. Reported metrics (CAGR, Sharpe, drawdown) are computed by applying the pre-specified score to a historical window and compared to external benchmarks (50/50 G/D, SPY, volatility-matched portfolios). Walk-forward and post-2022 checks are mentioned as validation steps. No equation reduces the performance numbers to a fitted parameter or self-citation by construction; the central empirical claim remains an out-of-sample-style measurement against independent benchmarks.
Axiom & Free-Parameter Ledger
free parameters (2)
- maximum active tilt =
50%
- EWMA decay parameter
axioms (1)
- domain assumption The relative G-D portfolio can be interpreted as a recognizable style portfolio on the basis of its Fama-French five-factor plus momentum betas and small alpha
Reference graph
Works this paper leans on
-
[1]
Journal of Financial Economics , volume=
Common risk factors in the returns on stocks and bonds , author=. Journal of Financial Economics , volume=
-
[2]
Journal of Financial Economics , volume=
A five-factor asset pricing model , author=. Journal of Financial Economics , volume=
-
[3]
On persistence in mutual fund performance , author=. Journal of Finance , volume=
-
[4]
Review of Financial Studies , volume=
A comprehensive look at the empirical performance of equity premium prediction , author=. Review of Financial Studies , volume=
-
[5]
Review of Financial Studies , volume=
Predicting excess stock returns out of sample: Can anything beat the historical average? , author=. Review of Financial Studies , volume=
-
[6]
A simple, positive semi-definite, heteroskedasticity and autocorrelation consistent covariance matrix , author=. Econometrica , volume=
-
[7]
A new approach to the economic analysis of nonstationary time series and the business cycle , author=. Econometrica , volume=
-
[8]
Journal of Economic Dynamics and Control , volume=
Asset allocation under multivariate regime switching , author=. Journal of Economic Dynamics and Control , volume=
-
[9]
Review of Financial Studies , volume=
Parametric portfolio policies: Exploiting characteristics in the cross-section of equity returns , author=. Review of Financial Studies , volume=
-
[10]
A reality check for data snooping , author=. Econometrica , volume=
-
[11]
Journal of Business & Economic Statistics , volume=
A test for superior predictive ability , author=. Journal of Business & Economic Statistics , volume=
-
[12]
Journal of Computational Finance , volume=
The probability of backtest overfitting , author=. Journal of Computational Finance , volume=
discussion (0)
Sign in with ORCID, Apple, or X to comment. Anyone can read and Pith papers without signing in.