REVIEW 4 major objections 8 minor 24 references
PyPSA-Spain: an extension of PyPSA-Eur to model the Spanish energy system
T0 review · 4 major / 8 minor · reviewed 2026-08-11 · deepseek-v4-flash
Pith's one-line read PyPSA-Spain, a single-country extension of PyPSA-Eur with corrected renewable profiles and price-based interconnections, yields a more balanced 2030 mix for Spain and suggests the official energy plan overestimates exports to France.
desk verdict Useful open Spanish power-system model with genuinely new national datasets, but the headline Q2Q profile correction is fitted and validated on the same year, so the 2030 transfer rests on untested assumptions. read the letter →
The pith
A machine-rendered reading of the paper's core claim, the machinery that carries it, and where it could break.
The reading
What carries the argument
The central mechanism is the quantile-to-quantile (Q2Q) transformation $\bar g^* = Q(\bar g) = \mathrm{CDF}_{H}^{-1}(\mathrm{CDF}_{PE}(\bar g))$, which maps the cumulative distribution of the modelled normalised capacity factor to that of historical national generation; three normalisation schemes are tested, and the paper chooses scheme 3 for wind and scheme 1 for solar, then applies the fitted transform to the hourly capacity factor of every Voronoi cell, the area assigned to each network node. The second load-bearing piece is the nested interconnection model: hourly price series for France and Portugal, obtained from a lower-resolution European optimisation with a consistent carbon target, are attached to border nodes so that imports and exports are decided by price arbitrage. The Q2Q transform corrects the systematic under/overestimation in the renewable time series without requiring knowledge of its physical cause, while the nested pricing keeps the single-country model consistent with a decarbonising Europe.
What would settle it
Compare the Q2Q-transformed wind and solar profiles for a non-2022 historical year, such as 2018 or 2023, against actual Spanish generation; if bias and RMSE are not lower than in the uncorrected PyPSA-Eur profiles, the claimed improvement does not generalise.
Extended reading notes
Core claim
The central claim is that the single-country model PyPSA-Spain, by replacing PyPSA-Eur's default Spanish representation with national-specific inputs, produces a more accurate picture of the Spanish power system. The Q2Q transformation reshapes the distribution of modelled hourly capacity factors for wind and solar so that it matches the distribution of historical national generation; the paper selects normalisation scheme 3 for wind and scheme 1 for solar, and applies the resulting function cell-by-cell. Demand is represented with regional hourly profiles and regional annual shares, and interconnections are modelled with border nodes whose generators and loads carry precomputed hourly prices from a European PyPSA-Eur run. When optimising the 2030 mix under the decarbonisation target of the Spanish NECP, the model finds about 70 GW of solar PV and about 70 GW of onshore wind; it also finds that Spain would be a net exporter to France and Portugal, and that the NECP's assumed French exports are larger than what emerges when France is also assumed to decarbonise.
Load-bearing premise
The load-bearing premise is that the Q2Q correction, calibrated on 2022 national historical generation, remains valid for the 2030 scenario and transfers from the country scale to every individual grid cell, so that a change in the bias structure over time or space would turn the correction into a distortion.
Editorial extensions
If this is right
- The Q2Q-corrected profiles change the 2030 optimal mix from a solar-dominated configuration to a balanced one, with roughly 70 GW of solar PV and 70 GW of onshore wind, and lower battery and floating-offshore needs.
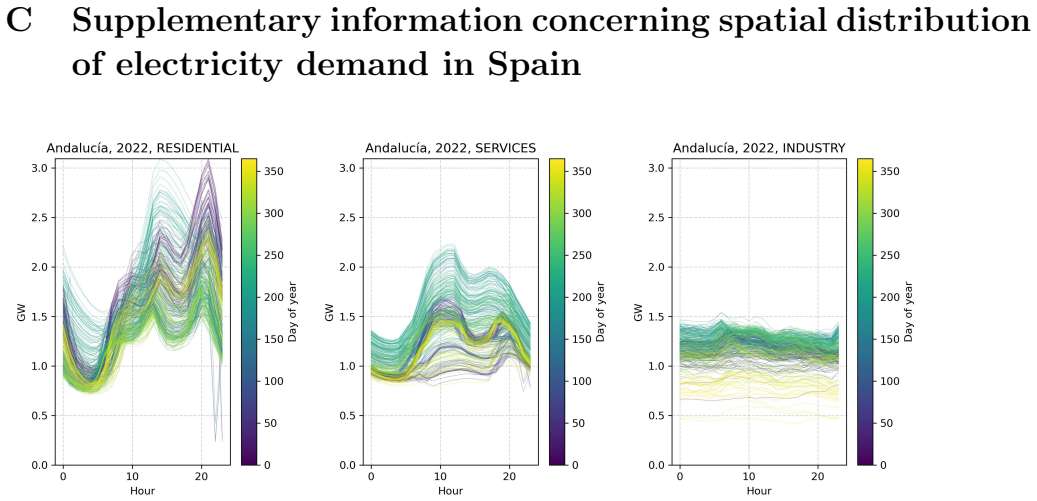
- The refined regional demand representation alone has a negligible effect on aggregate optimal capacities, but it makes it possible to construct future demand scenarios with different sectoral shares across regions.
- With price-based interconnections, the model yields net exports of similar order to historical balances, and suggests that the Spanish NECP overestimates exports to France because it does not assume French decarbonisation.
- A spatial resolution of at least 35–50 nodes is required to stabilise the optimal onshore wind capacity and avoid underestimating wind potential.
- The model's endogenous carbon price for the 2030 target is 71.2–77.1 EUR/tCO2, close to the NECP's exogenous 79 EUR/tCO2.
Reading between the lines
- Editorial extension: The Q2Q transform is calibrated and evaluated on the same year, 2022; applying the fitted transform to a different historical weather year would test whether it reduces bias generally or merely memorises that year.
- Editorial extension: The negligible aggregate effect of the demand refinement suggests its value may lie in grid-bottleneck analysis rather than capacity totals; examining line loadings with the regional demand profiles could reveal that value.
- Editorial extension: The one-way nested price treatment could be iterated, using the Spanish model's dispatch to update border prices, yielding a stronger equilibrium without running a full European optimisation.
- Editorial extension: Because the Q2Q correction is purely statistical, its applicability to future scenarios with different turbine technology or siting patterns is uncertain; a physical calibration would be needed for reliable extrapolation.
Signed reviews
Editorial analysis
A structured set of objections, weighed in public.
Referee Report
Summary. The paper introduces PyPSA-Spain, an open-source single-country extension of PyPSA-Eur for the Spanish power system. It adds three main functionalities: a quantile-to-quantile (Q2Q) correction of wind and solar capacity factors calibrated to Spanish 2022 historical generation, NUTS2/NUTS3 demand profiles from Datadis, and price-based interconnections with France and Portugal via virtual border nodes fed by a one-node-per-country PyPSA-Eur optimisation. The model is used to compute cost-optimal 2030 mixes, finding roughly 70 GW each of onshore wind and solar PV, and to compare with the Spanish NECP, concluding that the NECP may overestimate exports to France.
Significance. If the validation issues are resolved, this is a valuable open modelling contribution. The paper ships open code and data, documents a reproducible workflow, exploits national institutional data (REE, Datadis), and provides a transparent spatial-resolution analysis. The Q2Q correction is a simple and potentially transferable idea, and the nested interconnection approach is a pragmatic alternative to full co-optimisation. The paper also produces falsifiable quantitative predictions (capacity mixes, interconnector flows, CO2 prices) that can be checked against future outcomes.
major comments (4)
- [Section 3.1, Eq. (3), Figures 5, 7, 26, 28] The headline validation of the Q2Q correction is in-sample and partly tautological. Because Eq. (3) is \bar g* = CDF_H^{-1}(CDF_PE(\bar g)), the marginal distribution of the transformed series equals the target CDF by construction, so the PDF agreement in Figures 5 and 26 is a consistency check rather than independent evidence. The bias and RMSE statistics in Figures 7 and 28 are computed on the same 2022 data used to estimate CDF_H, CDF_PE, and to select among normalisation schemes 1-3, so they measure in-sample fit. This is load-bearing because Section 4 shows the profile correction is the functionality with the largest effect on the optimal mix, and the 2030 case study in Section 5 inherits these profiles. The text itself warns at the end of Section 3.1 that changing configuration parameters or meteorological year may reduce performance, but that warning is not operationalised. Please add a genuine out-of-sample evaluation, e.g., calibrate on 2022 and validate on 2023, or perform split-sample cross-validation over several years, and report whether the normalisation-scheme ranking and the RMSE reductions persist.
- [Section 3.1, scale transfer from country to Voronoi cells] The country-level Q2Q transform is applied to every Voronoi cell, but the cell-level validity of this transfer is not demonstrated. The normalisation analysis in Section 3.1 compares only country-level aggregates, and no NUTS2 or cell-level validation is reported. A monotone pointwise transform cannot correct phase errors or spatial-correlation errors in the modelled time series, so improved country-level bias and RMSE need not translate into improved timing of renewable availability at individual nodes, which is what matters for storage and interconnection sizing in the 2030 optimisations. Please validate the corrected profiles at regional scale using the NUTS2 installed-capacity data already exploited in Section 3.4.1, and report temporal-coherence metrics (e.g., lagged correlation or event-timing errors) in addition to marginal-distribution statistics.
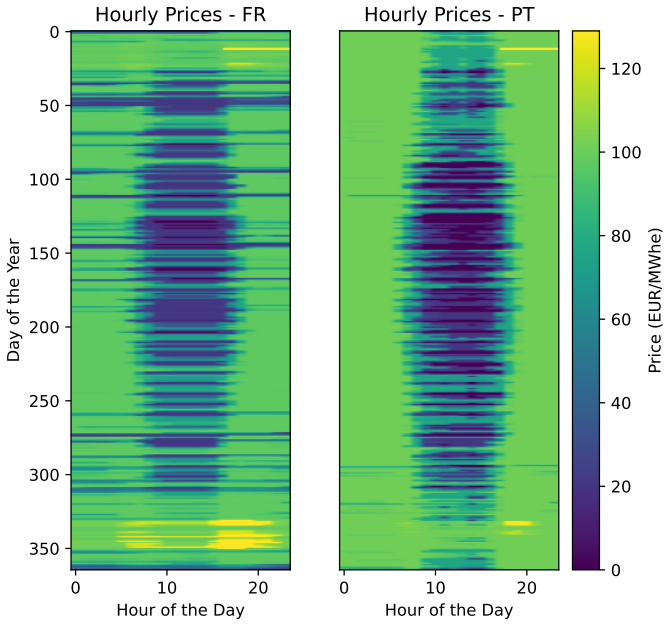
- [Section 3.3, Figures 11, 17, 21] The nested-interconnection price series are produced by a one-node-per-country PyPSA-Eur model under a single -70% CO2 target, and the conclusion in Section 5 that the NECP may overestimate exports to France depends directly on those prices. No sensitivity of the price series or of the resulting net flows to the neighbouring-country CO2 target, to the clustering resolution of the European model, or to the weather year is reported. Because the virtual border-node formulation makes Spain a price-taker on each interconnection, the export/import balance is exactly as robust as the assumed price series. Please stress-test the boundary prices (e.g., alternative CO2 targets or small price offsets) and show whether the qualitative conclusion about NECP exports to France survives.
- [Sections 4-5, Table 4, Figures 18-21] The 2030 scenario results are presented as point estimates without uncertainty quantification. The optimal capacities, battery requirements, and interconnector flows are conditional on several assumptions that the paper itself shows are influential, notably the Q2Q correction, the solar PV investment cost of 440 EUR/kWe in Table 4, the 1 MW/km2 power density cap, and the CO2 limit. The paper provides a spatial-resolution sensitivity but no sensitivity over these techno-economic parameters. At minimum, a one-at-a-time sensitivity analysis over the solar PV cost and the power density cap, together with a statement of how the NECP comparison changes, would be needed to support the policy-relevant claims in Section 5.
minor comments (8)
- [Abstract] The abstract contains a typo: 'a entire year' should read 'an entire year'.
- [Section 1] There are several typos: 'stablish' should be 'establish', and 'The reminder of this paper' should be 'The remainder of this paper'.
- [Section 2.2] In the description of the capacity limit, 'This cup is used during the optimisation phase' should read 'This cap is used during the optimisation phase'.
- [Section 3.1 and Section 4] Typos include 'Lets consider' (should be 'Let us consider'), 'subestimation' (should be 'underestimation'), and 'strit' (should be 'strict').
- [Sections 3.4.2 and 4] The text refers to 'Figure 3.4.2' where it should refer to Figure 12, and uses 'NCEP' instead of 'NECP' in Section 4.
- [Appendix B, Figures 27 and 28] The captions of Figures 27 and 28 say 'wind power generation time series' but the analysis in Appendix B is for solar PV generation; the captions should be corrected accordingly.
- [Figures 14-16] The bar charts in the Case 1, Case 2, and Case 3 figures appear to retain the legend label 'Reference case'; this is confusing because the figures are meant to show the cases with individual functionalities. The legends should be updated to match each figure.
- [Section 3.3] Minor wording: 'a node located in the border' should be 'a node located at the border', and 'a node located in the shore' should be 'a node located on the shore'.
Circularity Check
Renewable-profile Q2Q validation is partly tautological and fully in-sample; 2030 results inherit an untested transfer.
-
self definitional
[Section 3.1, Eq. (3); Figures 5 and 26]
"The Q2Q transform is a nonlinear function between the input normalised generation, ¯g and the transformed normalised generation, g∗, given by: ¯g∗ = Q(¯g) = CDF −1 w,H (CDF w,P E(¯g)). (3) ... Thus, the PDF of the transformed time series, ¯g∗ w,P E,t, replicates that of the normalised version of the historical wind power generation time series, ¯g w,R,t."
Because Eq. (3) defines Q as the quantile-matching map from the PyPSA-Eur distribution to the historical distribution, the equality of the transformed PDF to the historical PDF is a property of the definition, not an empirical finding. The paper presents Figures 5 and 26 as evidence of improved accuracy, and the abstract and conclusions describe the profiles as 'fitted and validated with historical data'. The distributional component of that validation is circular: when the same year's data are used both to define the target CDF and to test the match, success is guaranteed by construction.
-
fitted input called prediction
[Section 3.1, normalisation schemes and Figs. 7/28; abstract/conclusions 'fitted and validated' claim]
"The three Q2Q transforms obtained under the defined normalisation schemes, Q1(¯g), Q2(¯g) and Q3(¯g), are applied to the hourly capacity factors at each Voronoi cell. The resulting wind power generation time series aggregated at country level are then compared with real data to check the accuracy of the Q2Q transformation with each normalisation scheme. ... However, it should be noted that using different configuration parameters than those used to obtain the Q2Q transformations (e.g."
The Q2Q correction is constructed from the 2022 historical national wind and solar time series and from the 2022 PyPSA-Eur country-level time series; the choice among normalisation schemes 1-3 is also made by comparing the same 2022 country-level results to the same historical data. The bias/RMSE reductions in Figures 7 and 28 are therefore in-sample diagnostics: they show how well the fitted transform reproduces the data from which CDF_H and the normalisation selection were derived, not that the profiles are generally more accurate. The authors' own caveat that changing turbine model or meteorological year may reduce performance confirms that the 2022 agreement does not, by itself, validate the 2030 case study or the transfer to Voronoi cells.
full rationale
The strongest non-circular content is the demand re-scaling from Datadis, the NUTS2/NUTS3 demand allocation, and the price-based interconnection model, which are independent of the Q2Q fit. However, the paper's central evidence for improved renewable profiles is not self-contained: Eq. (3) defines Q as the quantile-matching map, so the PDF matches in Figures 5 and 26 are true by definition, and the bias/RMSE statistics are computed on the same 2022 data used to fit the transform and to choose among the three normalisation schemes. Because Section 4 identifies the Q2Q correction as the functionality with the largest impact on the optimal mix, the 2030 capacities and the NECP export comparison inherit the validity of this in-sample correction plus an untested stationarity/scale-transfer assumption. The paper itself warns that other configuration parameters or meteorological years may reduce performance. No load-bearing self-citation, uniqueness argument, or renaming of a known result was found; the demand and interconnection results are not circular. The score reflects a partial but real definitional/in-sample circularity in the central renewable-profile validation.
Assumptions & free parameters
free parameters (5)
- Q2Q transform for onshore wind (normalization scheme 3) =
Empirical CDF mapping fitted to 2022 Spanish wind generation; scheme 3 (each series normalized by its own maximum)
- Q2Q transform for solar PV (normalization scheme 1) =
Empirical CDF mapping fitted to 2022 Spanish PV generation; scheme 1 (both series normalized by installed capacity)
- GDP and population weights for annual demand distribution =
gdp=0.16, pop=0.82
- Solar PV investment cost =
440 EUR/kWe
- Renewable power density limit =
1 MW/km2
assumptions (7)
- domain assumption Long-term market equilibrium, perfect competition and perfect foresight are assumed in the optimization.
- domain assumption Linearized DC power flow (Kirchhoff's laws) is an adequate representation of the transmission network.
- domain assumption Existing renewable capacity is spatially distributed proportionally to annual capacity factor where plant locations are unknown.
- ad hoc to paper The 2022 quantile-to-quantile bias correction remains valid for the 2030 scenario and transfers from country scale to Voronoi cell scale.
- ad hoc to paper Nested boundary prices from a one-node-per-country PyPSA-Eur optimization with a -70% CO2 target adequately represent France and Portugal in the Spanish 2030 optimization.
- domain assumption Historical demand data from Datadis and ESIOS, and the NUTS2/NUTS3 allocations, are accurate and representative for 2030 demand profiles.
- domain assumption The NECP 2030 scenario inputs (demand 344 TWh, CO2 limit 11.986 Mt, interconnection capacities 5000 MW France and 4000 MW Portugal) are appropriate scenario settings.
invented entities (1)
-
Virtual border node with virtual demand and virtual generator for each interconnection
Cite this review
Pith. "Pith review of PyPSA-Spain: an extension of PyPSA-Eur to model the Spanish energy system." pith.science (2026). https://pith.science/paper/KVUVNFDY
@misc{pith2026241206571,
  author       = {Pith},
  title        = {Pith review of: PyPSA-Spain: an extension of PyPSA-Eur to model the Spanish energy system},
  year         = {2026},
  howpublished = {\url{https://pith.science/paper/KVUVNFDY}},
  note         = {Machine review of arXiv:2412.06571}
}
read the original abstract
This work presents PyPSA-Spain, an open-source model of the Spanish energy system based on the European model PyPSA-Eur. It aims to leverage the benefits of single-country modelling over a multi-country approach. In particular, several databases provided by Spanish institutions are exploited to improve the estimation of solar photovoltaic (PV) and onshore wind generation hourly profiles, as well as the spatio-temporal description of the electricity demand. PyPSA-Spain attains hourly resolution for a entire year and represents the Spanish energy system using a configurable number of nodes, while selecting around 35-50 nodes is identified as a good compromise between spatial resolution and model simplicity. To accommodate cross-border interactions, a nested model approach with PyPSA-Eur was used, wherein time-dependent electricity prices from neighbouring countries were precomputed through the optimisation of the European energy system. As a case study, the optimal electricity mix for 2030 was obtained and compared with the latest update of the Spanish National Energy and Climate Plan (NECP) from September 2024.
Figures


Figures from the paper (32 more)






Reference graph
Works this paper leans on
-
[1]
Pypsa-eur: An open optimisation model of the european transmission system
Jonas Hoersch, Fabian Hofmann, David Schlachtberger, and Tom Brown. Pypsa-eur: An open optimisation model of the european transmission system. Energy Strategy Reviews, 22:207–215, 2018
work page 2018
- [2]
-
[3]
Early decarbonisation of the European energy system pays off
Marta Victoria, Kun Zhu, Tom Brown, Gorm Andresen, and Martin Greiner. Early decarbonisation of the European energy system pays off. Nature Communications, 11(1):6223, 2020
work page 2020
-
[4]
Speed of technological transformations required in Europe to achieve different climate goals
Marta Victoria, Elisabeth Zeyen, and Tom Brown. Speed of technological transformations required in Europe to achieve different climate goals. Joule, 6(5):1066– 1086, 2022
work page 2022
-
[5]
Long-term implications of reduced gas imports on the decarbonization of the European energy system
Tim Tørnes Pedersen, Ebbe Kyhl Gøtske, Adam Dvorak, Gorm Bruun Andresen, and Marta Victoria. Long-term implications of reduced gas imports on the decarbonization of the European energy system. Joule, 6(7):1566–1580, July 2022
work page 2022
-
[6]
Offshore Wind Integration in the North Sea: The Benefits of an Offshore Grid and Floating Wind
Philipp Glaum, Fabian Neumann, and Tom Brown. Offshore Wind Integration in the North Sea: The Benefits of an Offshore Grid and Floating Wind. In 2023 19th International Conference on the European Energy Market (EEM) , pages 1–7, 2023
work page 2023
-
[7]
The potential role of a hydrogen network in Europe
Fabian Neumann, Elisabeth Zeyen, Marta Victoria, and Tom Brown. The potential role of a hydrogen network in Europe. Joule, 7(8):1793–1817, 2023. 34
work page 2023
-
[8]
Temporal regulation of renewable supply for electrolytic hydrogen
Elisabeth Zeyen, Iegor Riepin, and Tom Brown. Temporal regulation of renewable supply for electrolytic hydrogen. Environmental Research Letters, 19(2):024034, feb 2024
work page 2024
Show all 24 references
-
[9]
Distributed photovoltaics provides key benefits for a highly renewable european energy system
Parisa Rahdan, Elisabeth Zeyen, Cristobal Gallego-Castillo, and Marta Victoria. Distributed photovoltaics provides key benefits for a highly renewable european energy system. Applied Energy, 360:122721, 2024
2024
-
[10]
PyPSA: Python for Power System Analysis
Thomas Brown, Jonas H¨ orsch, and David Schlachtberger. PyPSA: Python for Power System Analysis. Open Research Software, 6(1), 2018
2018
-
[11]
pypsa-pl
Instrat. pypsa-pl. https://github.com/instrat-pl/pypsa-pl . Last accessed: November 21, 2024
2024
-
[12]
SWIS-100-IE Open Energy System Model for Ireland: 100% Zero-Emission Sources with CO2 Removal (CDR)
Barry McMullin and James Carton. SWIS-100-IE Open Energy System Model for Ireland: 100% Zero-Emission Sources with CO2 Removal (CDR). Technical report, Dublin City University, 2021. OESM-IE research project
2021
-
[13]
The Role of Renewable Energies, Storage and Sector-Coupling Technologies in the German Energy Sector under Different CO2 Emission Restrictions
Arjuna Nebel, Juli´ an Cantor, Sherif Salim, Amro Salih, and Dixit Patel. The Role of Renewable Energies, Storage and Sector-Coupling Technologies in the German Energy Sector under Different CO2 Emission Restrictions. Sustainability, 14(16), 2022
2022
-
[14]
https://ariadneprojekt.de/en/model-documentation-pypsa/
Pypsa-ariadne. https://ariadneprojekt.de/en/model-documentation-pypsa/ . Last accessed: November 22, 2024
2024
-
[15]
PyPSA-GB: An open-source model of Great Britain’s power system for simulating future energy scenarios
Andrew Lyden, Wei Sun, Iain Struthers, Lukas Franken, Seb Hudson, Yifan Wang, and Daniel Friedrich. PyPSA-GB: An open-source model of Great Britain’s power system for simulating future energy scenarios. Energy Strategy Reviews, 53:101375, 2024
2024
-
[16]
Viabilidad t´ ecnico-econ´ omica para un suministro el´ ectrico 100% renovable en Espa˜ na
Santiago Galbete. Viabilidad t´ ecnico-econ´ omica para un suministro el´ ectrico 100% renovable en Espa˜ na. PhD thesis, Universidad P´ ublica de Navarra, 2013
2013
-
[17]
Linares, P. et al. Escenarios para el sector energ´ etico en Espa˜ na 2030-2050. Technical report, Economics for Energy e Instituto de Investigaci´ on Tecnol´ ogica (U.P. Comillas), 2017
2017
-
[18]
Hourly-resolution analysis of electricity decarbonization in Spain (2017-2030)
Marta Victoria and Cristobal Gallego-Castillo. Hourly-resolution analysis of electricity decarbonization in Spain (2017-2030). Applied Energy, 233:674–690, 2019
2017
-
[19]
Improving Energy Transition Analysis Tool through Hydropower Statistical Modelling
Cristobal Gallego-Castillo and Marta Victoria. Improving Energy Transition Analysis Tool through Hydropower Statistical Modelling. Energies, 14(1):98, 2021
2021
-
[20]
Alarc´ on-Padilla
Javier Bonilla, Julian Blanco, Eduardo Zarza, and Diego C. Alarc´ on-Padilla. Feasibility and practical limits of full decarbonization of the electricity market with renewable energy: Application to the Spanish power sector. Energy, 239:122437, 2022. 35
2022
-
[21]
An´ alisis y propuestas para la descarbonizaci´ on
Comisi´ on de Expertos de Transici´ on Energ´ etica. An´ alisis y propuestas para la descarbonizaci´ on. Technical report, Ministerio de Energ ´ ıa, Turismo y Agenda Digital, 2018
2018
-
[22]
Plan Nacional Integrado de Energ ´ ıa y Clima 2021-2030
MITERD. Plan Nacional Integrado de Energ ´ ıa y Clima 2021-2030. Technical report, Ministerio para la Transici´ on Ecol´ ogica y el Reto Demogr´ afico, 2024. Available at: https://www.miteco.gob.es/content/dam/miteco/es/energia/ files-1/pniec-2023-2030/PNIEC_2024_240924.pdf . ...
2021
-
[23]
Performing energy modelling exercises in a transparent way - The issue of data quality in power plant databases
Fabian Gotzens, Heidi Heinrichs, Jonas H¨ orsch, and Fabian Hofmann. Performing energy modelling exercises in a transparent way - The issue of data quality in power plant databases. Energy Strategy Reviews, 23:1–12, 2019. 36 A Geospatial information of Spain Figure 23 shows th...
2019
-
[2022]
Subindices: P Emeans modelled with PyPSA-Eur, and Qi for i = 1, 2, 3 refers to the Q2Q transform under normalisation scheme i. 41 C Supplementary information concerning spatial distribution of electricity demand in Spain Figure 29: Hourly electricity demand in Andaluc ´ ıa (NU...
Reviewed August 11, 2026 · model on record in the stance chip above.
Discussion (0). Continue with ORCID to comment.