REVIEW 3 major objections 4 minor 10 references
New CTEQ Global Analysis with High Precision Data from the LHC
T0 review · 3 major / 4 minor · reviewed 2026-08-14 · deepseek-v4-flash
Pith's one-line read The new CTEQ global analysis fits nucleon parton distributions at NNLO to LHC precision data and issues two families, CT18 and CT18Z, that differ in whether the challenging ATLAS 7 TeV W and Z data are included.
desk verdict CT18/CT18Z is a workmanlike update of the CTEQ program with new LHC data, transparently split over the ATLAS 7 TeV W/Z tension; the proceedings is thin, and the K-factor systematics for jets are the real open question. read the letter →
The pith
A machine-rendered reading of the paper's core claim, the machinery that carries it, and where it could break.
The reading
What carries the argument
The mechanism that carries the analysis is the NNLO theory pipeline built from fast interpolation tables: NLO APPLgrid grids multiplied by NNLO/NLO $K$-factors for jet and vector-boson production, and fastNLO grids for top-pair observables. The Hessian method—approximating the parameter dependence of $\chi^2$ by a quadratic form and diagonalising it into error eigenvectors—turns the data ensemble into the 90% confidence-level PDF bands. Lagrange Multiplier scans probe non-quadratic constraints on selected PDF features, and a $0.5\%$ uncorrelated error absorbs residual Monte Carlo integration uncertainties of the NNLO cross sections.
What would settle it
Recompute the inclusive jet cross sections entering the fit directly at NNLO with exact grids (no $K$-factor approximation), refit the CT18 ensemble, and compare the gluon PDF at $x=0.01$ and $x=0.3$ at $Q=125$ GeV; if the central gluon moves by more than the quoted 90% C.L. band, the $K$-factor pipeline is the source. A second, decisive check would be a new ATLAS $W/Z$ rapidity measurement whose systematics allow it to join a single global fit without degrading $\chi^2$, which would erase the need for the two-family split.
Extended reading notes
Core claim
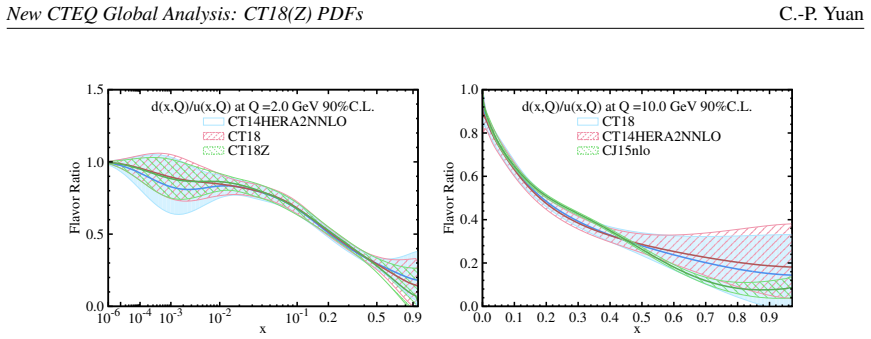
The paper claims that a global NNLO fit can absorb a broad set of high-precision LHC measurements—inclusive jets, $W$, $Z$, high-$p_T$ $Z$, Drell-Yan, and $t\bar t$ production—and that the resulting CT18 PDFs sharpen the constraints on the gluon at $x \sim 0.01$–$0.3$, reduce the $d/u$ ratio at $x > 0.5$, and set the strange-to-nonstrange sea ratio toward SU(3)-symmetric behaviour at small $x$. The ATLAS 7 TeV $W/Z$ data are the one major set that cannot be fitted together with the others; the CT18Z variant includes them at the price of three associated changes, and the two fits end with nearly equal global $\chi^2$ per point. The paper presents the two families as complementary, with the differences between them quantifying the sensitivity of PDFs to that data set and to the treatment of charm and DIS scales.
Load-bearing premise
The analysis stands or falls on the assumptions that NNLO predictions for jets and high-$p_T$ $Z$ production are adequately represented by NLO fast grids multiplied by NNLO/NLO $K$-factors, and that the ATLAS-recommended systematic decorrelations correctly capture the correlated errors of the 7 TeV jet data; if either assumption is wrong, the extracted gluon and quark distributions shift.
Editorial extensions
If this is right
- If CT18 and CT18Z become the reference PDFs, LHC predictions for $W$, $Z$, Higgs, and top-pair cross sections will be quoted with the error bands from these sets, and the two families give an immediate way to estimate the PDF shift caused by the ATLAS 7 TeV $W/Z$ data.
- The reduced $d/u$ ratio at $x>0.5$ in CT18 will lower predictions for processes sensitive to valence quarks at high momentum fraction, such as forward $W$ production and certain $t\bar t$ asymmetries.
- The SU(3)-symmetric strangeness assumption at $x\to 0$, combined with data constraints near $x=0.023$, gives a definite $R_s$ profile that enters predictions of neutrino-nucleon and $W$+charm processes.
- The near-equal $\chi^2$ of the two fits means that analyses comparing with ATLAS 7 TeV $W/Z$ data should state explicitly which family they use, since CT18 and CT18Z differ in sea-quark flavour ratios.
Reading between the lines
- If a future theory improvement—for example genuine NNLO electroweak corrections or a more physical charm-mass treatment—removes the ATLAS 7 TeV $W/Z$ tension, the two-family structure would likely collapse into one fit; the CT18/CT18Z split is an existence proof that current NNLO QCD does not yet reconcile all high-precision LHC data.
- A testable extension is to compare CT18 and CT18Z predictions for the 13 TeV lepton charge asymmetry of $W$ production; because the sets differ most in the $\bar d/\bar u$ and strangeness ratios, high-rapidity asymmetry data at 13 TeV could discriminate between them.
- The quoted $\chi^2/N_{\rm pt}\approx 1.17$ includes a $0.5\%$ uncorrelated numerical error; if faster exact NNLO calculations reduce that tolerance, the same data would yield narrower PDF uncertainty bands, so the reported bands may be read as mildly conservative.
Signed reviews
Editorial analysis
A structured set of objections, weighed in public.
Referee Report
Summary. This proceedings paper reports the CTEQ-TEA global QCD analysis CT18 and its variant CT18Z, which determine nucleon parton distribution functions at NNLO in the Hessian method. CT18 includes a broad set of new LHC data (jets, W/Z, Drell-Yan, high-pT Z, top-quark pair production) while CT18Z additionally includes ATLAS 7 TeV W and Z rapidity data and differs in the treatment of CDHSW data, the charm quark mass, and the DIS saturation scale. The paper presents global chi2/Npt values of 1.17 (CT18) and 1.19 (CT18Z), plots of the resulting PDF uncertainties relative to CT14HERA2, Lagrange Multiplier scans for the gluon and strangeness ratio, and comparisons of LHC PDF luminosities with MMHT2014 and NNPDF3.1.
Significance. If the CT18/CT18Z sets are reliable, they constitute an updated standard reference for LHC phenomenology, since they incorporate several high-precision LHC data sets into a global Hessian NNLO analysis. The paper is commendably explicit about the data-selection choices: it states that ATLAS 7 TeV W/Z data are excluded from CT18 and included in CT18Z, and it reports the resulting chi2/Npt values. The Lagrange Multiplier scans are a useful diagnostic of which data constrain the gluon and strangeness PDFs. As a proceedings contribution, however, the paper leaves several load-bearing methodological details to the companion literature, and therefore the quantitative claims should be treated as preliminary pending the full CT18 publication.
major comments (3)
- [Section 1 (Theoretical predictions)] The NNLO treatment of the inclusive jet and high-pT Z data relies on NLO APPLgrid tables multiplied by NNLO/NLO K-factors, with only a 0.5% uncorrelated error assigned for numerical integration. The paper does not quantify the uncertainty of the K-factor approximation itself, including its dependence on pT, rapidity, and the input PDF set used to compute the K-factors. Because the ATLAS 7 TeV jet data are retained (albeit with decorrelations and the acknowledged non-optimal chi2) and are among the principal new constraints on the gluon, a K-factor shape error could bias the fitted gluon and the resulting NNLO PDFs. Please provide an estimate of this systematic, or justify with a concrete test why it is negligible relative to the experimental precision of the fitted jet and high-pT Z data.
- [Section 1 and Figures 1-3, 6 (Hessian uncertainties)] The 90% C.L. PDF error bands are a central deliverable of the paper, but the Hessian tolerance criterion used to define the error ensembles is not stated, nor is the functional form of the new 'flexible' parametrization specified beyond the claim that it is the same as CT14HERA2 for u, d, ubar, and dbar. Without the tolerance and the parametrization form, the quoted uncertainty bands cannot be reproduced or compared with other groups' sets. Please state the tolerance criterion and the parametrization choices, or explicitly refer to the full CT18 paper where these are defined.
- [Section 2 (Strange PDF and exact SU(3) assumption)] The paper states that CT18 assumes exact SU(3) symmetry of the sea quark PDFs so that (s+sbar)/(ubar+dbar) approaches 1 as x tends to 0, and that this ratio at x<1e-3 is determined entirely by the parametrization form. This is a model assumption imposed on the fit, not a data-driven result, and it directly affects the reported increase in the strangeness PDF at x<0.03. The discussion should clearly flag that the small-x strangeness ratio is an input assumption, and should indicate how the uncertainty bands in Fig. 3 account for this choice.
minor comments (4)
- [Abstract and Section 1] The notation 'CT18(Z)' and 'chi2/Npt = 1.17(1.19)' is ambiguous; state explicitly which number corresponds to CT18 and which to CT18Z.
- [Section 1] The sentence 'In some kinematic regions, there are few constraints... Lagrange Multiplier constraints are then applied' would benefit from a reference to the exact Lagrange Multiplier procedure or a definition of the applied constraints, so the reader can distinguish them from the uncertainty scans shown in Figs. 4 and 5.
- [Section 2] The statement that the parametrization form of u, d, ubar, and dbar in CT18 is the same as in CT14HERA2, while 'new flexible PDF parametrizations have been tested for CT18', is confusing and should be reconciled.
- [Figure 1 caption] The caption says the error bands are normalized to the 'respective central CT14HERA2 NNLO PDFs'; since the bands are displayed for CT18 and CT18Z relative to a fixed CT14HERA2 reference, please rephrase to avoid implying that each band is normalized to its own central value.
Circularity Check
No significant circularity: CT18/CT18Z are fitted PDF ensembles, and the paper makes no construction-level prediction that reduces to its fitted inputs.
full rationale
This paper is a global PDF fit. The central objects, the CT18 and CT18Z parton distributions, are obtained by minimizing chi-squared against a collection of experimental data sets; they are not claimed to be derived from first principles, so fitting them to data is not circular. The theory predictions entering the fit are external calculations, with the paper stating that jet and high-pT Z predictions are evaluated using NLO APPLgrid tables multiplied by NNLO/NLO K-factors [Refs. 5,6,7] or directly via FASTNLO grids for top-quark observables. These K-factors are not fitted parameters of the PDF ensemble, and the paper does not redefine any target quantity in terms of the PDFs being determined. The two families CT18 and CT18Z differ by the inclusion of ATLAS 7 TeV W/Z data, removal of CDHSW data, a changed charm mass, and a changed DIS scale; these are data-selection and input-scheme choices rather than self-referential constructs. The luminosity comparisons in Fig. 6 are post-fit applications, not predictions that are forced by construction. Self-citations to CT14 and CT14HERA2 serve as baseline comparisons rather than load-bearing justification for the result. The 0.5% uncorrelated error assigned to NNLO Monte Carlo integration is a modeling choice whose adequacy may be a correctness concern, but it is not circular because it is not equivalent to the fitted PDFs. No equation or step was found in which a claimed prediction is identical to a fitted input by definition, nor was any uniqueness result imported from prior work by the same authors to forbid alternatives. Therefore, there is no specific circular reduction to report and the circularity score is 0.
Assumptions & free parameters
free parameters (4)
- PDF parametrization coefficients =
not stated in the proceedings
- Charm quark pole mass m_c =
1.3 GeV (CT18), 1.4 GeV (CT18Z)
- DIS saturation scale =
not specified
- Uncorrelated 0.5% error for NNLO jet and high-pT Z predictions =
0.5%
assumptions (5)
- standard math QCD collinear factorization and NNLO DGLAP evolution of PDFs
- domain assumption The Hessian method with a global tolerance yields reliable 90% C.L. PDF uncertainties
- domain assumption NNLO/NLO K-factors applied to NLO APPLgrid predictions accurately approximate full NNLO cross sections for jets and vector bosons
- domain assumption ATLAS-recommended decorrelation of jet systematic uncertainties is a valid model of correlated errors
- ad hoc to paper Exact SU(3) symmetry of the sea quark PDFs as x approaches 0
Cite this review
Pith. "Pith review of New CTEQ Global Analysis with High Precision Data from the LHC." pith.science (2026). https://pith.science/paper/LBJZMXLM
@misc{pith2026190811238,
  author       = {Pith},
  title        = {Pith review of: New CTEQ Global Analysis with High Precision Data from the LHC},
  year         = {2026},
  howpublished = {\url{https://pith.science/paper/LBJZMXLM}},
  note         = {Machine review of arXiv:1908.11238}
}
abstract
We present the new CTEQ-TEA global analysis of quantum chromodynamics (QCD). In this analysis, parton distribution functions (PDFs) of the nucleon are determined within the Hessian method at the next-to-next-to leading order (NNLO) in perturbative QCD, based on the most recent measurements from the Large Hadron Collider (LHC) and a variety of world collider data. Because of difficulties in fitting both the ATLAS 7 and 8 TeV $W$ and $Z$ vector boson production cross section data, we present two families of PDFs, named CT18 and CT18$Z$ PDFs, respectively, without and with the ATLAS 7 TeV $W$ and $Z$ measurements. We study the impact of the CT18 family of PDFs on the theoretical predictions of standard candle cross sections at the LHC.
Figures


Figures from the paper (3 more)


Reference graph
Works this paper leans on
-
[1]
S. Dulat et al., Phys. Rev. D 93, no. 3, 033006 (2016) doi:10.1103/PhysRevD.93.033006 [arXiv:1506.07443 [hep-ph]]
arXiv 2016
- [2]
-
[3]
A. Gehrmann-De Ridder, T. Gehrmann, E. W. N. Glover, A. Huss and T. A. Morgan, Phys. Rev. Lett. 117, no. 2, 022001 (2016) doi:10.1103/PhysRevLett.117.022001 [arXiv:1507.02850 [hep-ph]]
arXiv 2016
-
[4]
M. Aaboud et al. [ATLAS Collaboration], Eur. Phys. J. C77, no. 6, 367 (2017) doi:10.1140/epjc/s10052-017-4911-9 [arXiv:1612.03016 [hep-ex]]
arXiv 2017
- [5]
- [6]
- [7]
-
[8]
S. Chatrchyan et al. [CMS Collaboration], Phys. Rev. D 90, no. 7, 072006 (2014) doi:10.1103/PhysRevD.90.072006 [arXiv:1406.0324 [hep-ex]]
arXiv 2014
Show all 10 references
-
[9]
Khachatryan et al
V . Khachatryan et al. [CMS Collaboration], JHEP 1703, 156 (2017) doi:10.1007/JHEP03(2017)156 [arXiv:1609.05331 [hep-ex]]
2017 arXiv
-
[10]
Aad et al
G. Aad et al. [ATLAS Collaboration], Eur. Phys. J. C76, no. 5, 291 (2016) doi:10.1140/epjc/s10052-016-4070-4 [arXiv:1512.02192 [hep-ex]]. 5
2016 arXiv
Reviewed August 14, 2026 · model on record in the stance chip above.
Discussion (0). Continue with ORCID to comment.