REVIEW 3 major objections 5 minor 79 references
How orbitals and oxidation states determine apparent topographies in scanning tunneling microscopy: the case of fluorine on silver surfaces
T0 review · 3 major / 5 minor · reviewed 2026-08-12 · deepseek-v4-flash
Pith's one-line read STM depressions over fluorine on silver reveal oxidized silver neighbors
desk verdict Fresh orbital model for F/Ag STM topographies, but the oxidation-state link is a plausible rationalization, not a proven mechanism. read the letter →
The pith
A machine-rendered reading of the paper's core claim, the machinery that carries it, and where it could break.
The reading
What carries the argument
The load-bearing object is a minimal orbital model of the tunneling current built from atom-centered orbitals with hydrogenic radial shapes and screened effective charges. Starting from the s-wave tip approximation, the model keeps only diagonal orbital contributions, so the local DOS at the tip is a sum over shells of the projected DOS times the shell density (Eq. (18)); at tip distances of 5–6 Å the silver $4d$ states, despite their large projected DOS, are too short-ranged to matter, leaving Ag $5s$ and F $2p$ as the active channels. Oxidation of a silver neighbor is represented by a screening-rule increase in its effective nuclear charge, $\Delta Z^{5s}_{\rm eff}=0.35\,\delta/\zeta$, which contracts the $5s$ orbital and lowers the constant-current height; the analytic depression formula (Eq. (25)) cancels matrix elements and coordination factors, leaving a depth that depends only on geometry, effective charge, and cumulative DOS. The protrusion is controlled by the competing F $2p$ and Ag $5s$ densities and cumulative DOS (Eq. (26)), which is why it appears only at negative bias where F $2p$ is occupied.
What would settle it
Measure the apparent depression depth of a fluorine adatom on Ag(100) as a function of tip–sample distance and of an independent local-oxidation probe such as X-ray photoemission core-level shifts, and compare with Eq. (25): the depth should grow linearly with tip height and with the per-atom charge loss. A clear deviation, or a depression that does not scale with per-atom charge loss across different adsorption sites, would falsify the screening-contraction mechanism.
Extended reading notes
Core claim
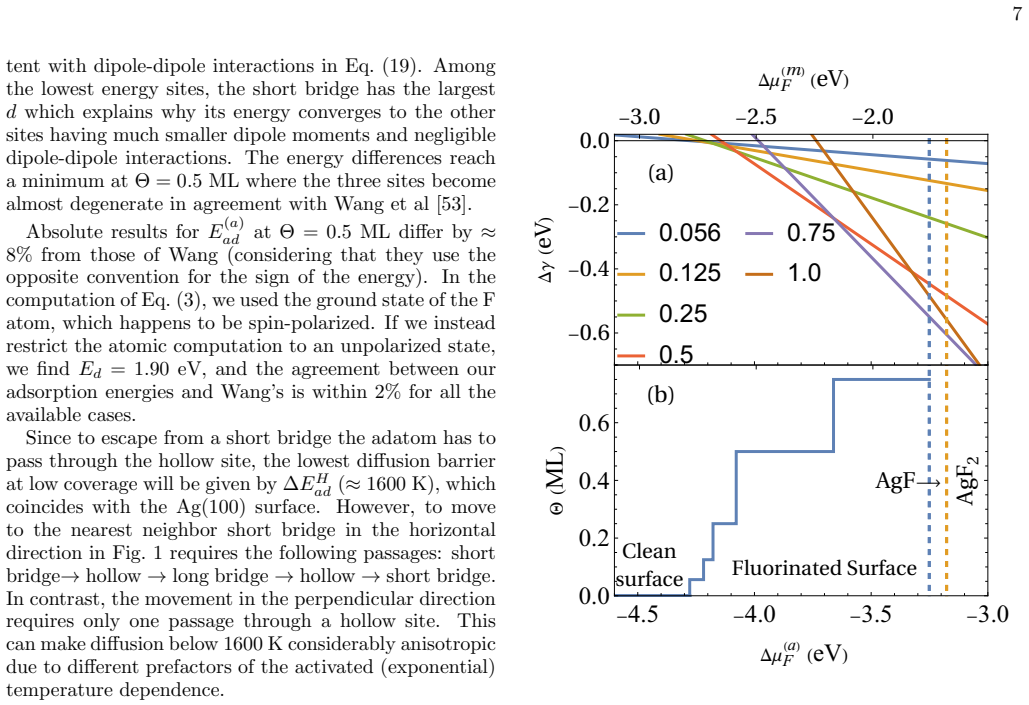
The paper's central claim is that the apparent topography of a fluorine adatom on Ag(100) and Ag(110) is governed by two orbital channels with opposite signs. At positive bias the tunneling current is carried by silver $5s$ states; the fluorine removes roughly $1/\zeta$ of an electron from each of its $\zeta$ nearest silver neighbors, and by the standard screening rule this raises the effective nuclear charge of those silvers, contracts their $5s$ orbitals, and produces a topographic depression whose depth is approximately independent of bias and proportional to the per-atom charge depletion (Eqs. (24)–(25)). At negative bias the filled F $2p$ states contribute strongly, and because the fluorine sits above the surface the $2p$ evanescent density can rise above the depressed silver contour, producing the central protrusion that turns the feature into a sombrero (Eq. (26)). The same model assigns the experimental topographies to specific adsorption sites: the hollow site on Ag(100), and the short bridge, long bridge, and hollow sites on Ag(110), with the rarest observed feature still unresolved. The paper further argues that under realistic fluorination conditions bulk silver fluorides are thermodynamically stable, so the adatom configurations seen in experiments are set by kinetic barriers and sticking rather than by equilibrium.
Load-bearing premise
The argument stands on the assumption that the dominant effect of the fluorine on neighboring silver is the classical screening rule: every fraction of an electron removed shrinks the Ag $5s$ orbital by the textbook 0.35 factor, while wave-function deformation, $4d$ screening, off-diagonal orbital overlap, and tip-induced polarization are all small enough to ignore.
Editorial extensions
If this is right
- After subtracting the central protrusion, the depth of the STM depression over a fluorine adatom is a direct measure of the oxidation state of the neighboring silver atoms: depth grows with the fraction of an electron removed per neighbor and is essentially independent of bias.
- The sombrero protrusion appears only at negative bias, where the filled F $2p$ states contribute to the current, and vanishes wherever the Ag $5s$ channel dominates the tunneling.
- On Ag(100) the stable hollow-site adatom, and on Ag(110) the three near-degenerate short-bridge, long-bridge, and hollow-site adatoms, can be matched to the experimental topographies by combining adsorption energetics, simulated images, and the orbital model.
- Under the pressures and temperatures of typical fluorination experiments, the clean-to-fluoride equilibrium would favor bulk AgF or AgF$_2$, so the adatom coverages observed in experiments are kinetic states controlled by exposure time and sticking coefficient.
- The same reasoning implies STM can supply local-valence information on metal surfaces during reactions, not merely geometric corrugation.
Reading between the lines
- Beyond the paper: the same two-channel mechanism should apply to other electronegative adsorbates such as oxygen, sulfur, or chlorine on silver; any adsorbate that oxidizes its nearest metal neighbors should create a positive-bias depression whose depth tracks the per-atom charge loss, which would unify the sombrero shapes reported for S/Ag and O/Ag.
- Beyond the paper: a direct test would compare STM depression depths with core-level shifts from X-ray photoemission on the same surface; agreement would confirm the oxidation link, while disagreement would point to wave-function deformation or $4d$ screening as the controlling factor.
- Beyond the paper: because Eq. (25) predicts depression depth grows roughly linearly with tip height, systematic constant-current measurements over a wide tip–sample distance range should expose where the diagonal-orbital approximation breaks down and off-diagonal channels or tip-induced polarization take over.
- Beyond the paper: the unresolved rarest feature (AT(C)) might be settled by searching off-symmetry adsorption positions or mixed F/H adsorbates; the model's volcano-shaped fingerprint for a vacancy site is a specific prediction that could be tested by deliberately creating single Ag vacancies.
Signed reviews
Editorial analysis
A structured set of objections, weighed in public.
Referee Report
Summary. This paper combines DFT calculations, Tersoff–Hamann STM simulations, and a simplified hydrogenic orbital model to analyze the early stages of fluorine adsorption on Ag(100) and Ag(110). The authors compute adsorption energies for several high-symmetry sites, construct a thermodynamic coverage phase diagram, and argue that under typical experimental conditions the surface state is controlled by kinetics rather than equilibrium thermodynamics. They then simulate STM apparent topographies, propose assignments of the experimental features to specific adsorption sites, and introduce a model in which the STM depression is attributed to oxidation-induced contraction of Ag 5s orbitals while the protrusion is attributed to filled F 2p orbitals. The central claim is that apparent STM heights can encode the local oxidation state of metal atoms near the adatom.
Significance. If the central claim holds, the paper would provide a broadly applicable interpretive framework for STM of atomic adsorbates, potentially allowing local valence information to be extracted from topographic images. The DFT calculations are carefully specified and the authors are commendably transparent about discrepancies: depression depth overestimated, width underestimated by about a factor of 0.5, the AT(C) assignment questioned, and the short-bridge sombrero mismatch at -1.5 V. The orbital model is simple, falsifiable, and yields qualitative trends that are consistent with both DFT and experiment. However, the quantitative link between depression depth and oxidation state is not yet established, for the reasons detailed in the major comments.
major comments (3)
- [Sec. III D, Eq. (25), and Table II] The numerical estimate in Eq. (25) is obtained with a full-electron oxidation state that is inconsistent with the DFT charge transfer reported in the same paper. The text states that 'we assume that 1/ζ of an electron is transferred to the fluorine' and the numerical check after Eq. (25) uses Zeff = 0.35/ζ, i.e., δ = 1, yielding |Δz| ≈ 15–30 pm. Yet Table II reports δn ≈ 0.16–0.20 e on F, and Sec. III A 1 explicitly uses the smallness of δn to argue that dipole–dipole interactions are weak. Since Eq. (25) is linear in δ, using the tabulated charge transfer would give depression depths of roughly 3–6 pm, an order of magnitude smaller than the DFT and experimental values. The authors must reconcile the effective charge transfer used in the orbital model with the DFT electronic structure, or show through an explicit calculation that the depression depth is insensitive to δ because of a compensating change in the calibrated Zeff.
- [Sec. III D, Eqs. (24)–(25)] The derivation does not establish that the depression is specifically caused by Slater-rule contraction of Ag 5s orbitals. The only oxidation-dependent input is the ad hoc ΔZeff = 0.35δ/ζ, and the quantitative comparison is performed only after re-tuning Zeff so that the Ag 5s ionization energy coincides with the silver work function, with the resulting tip position falling in the oscillatory region of the hydrogenic density (text after Eq. (25) and Fig. 10(a)). Under those conditions the asymptotic expression (A4) is not valid, as the authors acknowledge. Other mechanisms, such as the electrostatic potential of the F− ion, tip-induced polarization, or the off-diagonal Wannier products discarded in Eq. (16), would also reduce the Ag 5s density at the tip height. A discriminating test is needed: for example, computing from the DFT Kohn–Sham states the constant-height changes Δρ5s and ΔG5s at the hollow site and comparing their magnitude and radial dependence with the Slater-contracted hydrogenic prediction, rather than only comparing final apparent heights.
- [Sec. III D, Fig. 8 and Eq. (24)] The neglect of ΔG5s/G∞5s is asserted but not quantified. The text says that from Fig. 8 the integrated 5s PDOS is 'practically unchanged' and that 'ΔG5s/G∞5s ≪ 1', but Fig. 8 shows PDOS curves for one Ag neighbor and does not display the bias-integrated differences that enter Eq. (24). Because G05s and G∞5s appear in Eq. (24) with the same weight as Δρ5s, a numerical bound on ΔG5s/G∞5s over the full bias range is required before Eq. (24) can be reduced to Eq. (25). If the integrated PDOS change is not small, the depression depth depends on bias and on the cumulative DOS, which would undermine the claimed bias independence of the depression depth (point i after Eq. (25)).
minor comments (5)
- [References] Ref. [53] appears to be a mis-citation: the listed paper (Wang et al., Phys. Rev. B 64, 224519 (2001)) is on cuprate superconductors, not on fluorine adsorption on Ag(110). Please cite the correct DFT study with which the 0.5 ML adsorption energies are compared.
- [Sec. II B] The phrase 'the energy of a F 2 molecule' should read 'the energy of an F2 molecule'.
- [Eq. (26)] The quantity G2p(VB) is used without being defined; please define it as the cumulative F 2p PDOS, analogous to G5s(VB).
- [Sec. III D] The sentence 'the 4 s charge transfer is smaller in magnitude' appears to be a typo for '5s charge transfer', since the surrounding discussion concerns the Ag 5s channel and the 4s orbital is not otherwise considered.
- [Eq. (13)] The notation is inconsistent: both kbT and kBT appear, as do ¯h and h. Please standardize the symbols for the Boltzmann constant and Planck constant.
Circularity Check
No significant circularity: the oxidation-to-depression link in the simplified orbital model is a stated assumption tested against independent DFT and experimental comparisons, not a fit to the target topography.
full rationale
The paper's central interpretive claim is that the apparent STM depression is caused by oxidation-induced contraction of Ag 5s orbitals. In the simplified orbital model, the depression depth Eq. (25) is derived from an assumed Slater-rule change ΔZ_eff = 0.35δ/ζ, stated explicitly in Sec. III D: 'According to Slater rules [61], this should decrease the screening of the core charges by 0.35 per electron. Thus, we increase the positive effective charge of these Ag atoms by 0.35/ζ.' That assumption is an input to the forward model, not a quantity inferred from the STM data and then relabeled as a prediction. The paper compares the model's trends with DFT-computed 5s charge transfers (-0.036, -0.033, -0.045, -0.05 e for the relevant sites) and with DFT/experimental well depths, providing an independent check of the assumed correlation. The Zeff adjustment ('Adjusting Zeff so that the ionization energy coincides with the work function of silver') calibrates the evanescent decay length to a bulk property independent of the target STM topography, so it does not constitute fitting the observable it is used to explain. Limitations explicitly acknowledged in the text, such as the neglect of wave-function deformation by the F− ion and the diagonal approximation in Eq. (16), reduce certainty but do not create a circular reduction. The companion experimental paper Ref. [25] is cited as data source for STM observations, not as an authority or uniqueness theorem; other self-citations are background. No load-bearing argument reduces to a self-citation or to the target result by construction.
Assumptions & free parameters
free parameters (3)
- Z_eff(Ag 5s) =
adjusted so that the Ag 5s ionization energy equals the silver work function; final value not stated
- Z_eff(F 2p) =
1.6
- Gaussian FWHM =
4.7 Å
assumptions (7)
- domain assumption Tersoff-Hamann approximation with an s-wave spherical tip, constant tip DOS and matrix element
- domain assumption Diagonal approximation in Eq. (16): local DOS is a sum of diagonal Wannier orbital densities; off-diagonal terms neglected
- domain assumption Slater-type hydrogenic orbitals with effective charges from Clementi-Raimondi represent the evanescent tunneling tails
- ad hoc to paper Slater rules: oxidation by δ/ζ electrons increases the effective nuclear charge of the Ag neighbor by ΔZ_eff = 0.35δ/ζ
- domain assumption Change in integrated 5s PDOS at the nearest-neighbor Ag is negligible compared to the density contraction (ΔG_5s ≈ 0 in Eq. 24)
- domain assumption DFT (PBEsol) and the slab model reliably capture adsorption energetics and charge transfer for this system
- domain assumption Experimental AT population frequencies reflect thermal equilibrium at room temperature (Boltzmann factors)
Cite this review
Pith. "Pith review of How orbitals and oxidation states determine apparent topographies in scanning tunneling microscopy: the case of fluorine on silver surfaces." pith.science (2026). https://pith.science/paper/WF7R3PDA
@misc{pith2026241109392,
  author       = {Pith},
  title        = {Pith review of: How orbitals and oxidation states determine apparent topographies in scanning tunneling microscopy: the case of fluorine on silver surfaces},
  year         = {2026},
  howpublished = {\url{https://pith.science/paper/WF7R3PDA}},
  note         = {Machine review of arXiv:2411.09392}
}
read the original abstract
We use density functional theory calculations to characterize the early stages of fluorination of silver's (100) and (110) surfaces. In the Ag(100) surface, the hollow site is the most favorable for F adatoms. In the Ag(110) surface, three adsorption sites, namely hollow, long bridge, and short bridge, exhibit similar energies. These locations are also more favorable than an F adatom occupying a vacancy site irrespectively of whether the vacancy was present or not in the pristine surface. The computed energy as a function of surface coverage is used to compute the equilibrium thermodynamics phase diagram. We argue that for the typical pressure and temperature of fluorination experiments, the state of the surface is not determined by thermodynamics but by kinetics. Combining these results with scanning tunneling microscopy (STM) topographic simulations, we propose assignments to features observed experimentally. We present a minimal model of the apparent topography of adatoms in different locations in terms of hydrogenic orbitals, explaining the observed trends. The model links the STM apparent topography to structural information and the oxidation states of the Ag atoms near the adatom.
Figures


Figures from the paper (10 more)


Reference graph
Works this paper leans on
- [53]
-
[1]
Ag(100) surface The adsorption energies obtained for the Ag(100) sur- face are plotted in Fig. 2 (a). According to Eq. (5), the reaction with atomic fluorine is more exothermic than the reaction with molecular fluorine. For the studied range of coverages, the most energeti- cally favorable position is the hollow site, followed by the bridge, and finally, ...
-
[2]
Ag(110) surface The adsorption energies for the Ag(110) surface are plotted in the Fig. 2 (b). For the lowest coverage studied, the most favorable site is the short bridge. The long bridge and hollow sites have an energy penalty ∆ EL ad = 90 meV and ∆ EH ad = 140 meV respectively, similar to the energy penalty of the bridge site in the (100) surface. The ...
-
[3]
Exchange reactions and vacancy occupancy We also considered the possibility that fluorine adatoms substitute surface Ag atoms, which are incorpo- rated into the bulk. A viable path for such an exchange reaction process is that an Ag atom from the surface mi- grates to a kink along a step of the surface [54]. Since this only moves the kink by one lattice c...
-
[4]
J. Q. Lin, P. Villar Arribi, G. Fabbris, A. S. Botana, D. Meyers, H. Miao, Y. Shen, D. G. Mazzone, J. Feng, S. G. Chiuzbˇ aian, A. Nag, A. C. Walters, M. Garc ´ ıa- Fern´ andez, K. J. Zhou, J. Pelliciari, I. Jarrige, J. W. Freeland, J. Zhang, J. F. Mitchell, V. Bisogni, X. Liu, M. R. Norman, and M. P. Dean, Phys. Rev. Lett. 126, 087001 (2021), arXiv:2008.08209
work page Pith review arXiv 2021
-
[5]
Fluorine adatoms on the Ag(100) surface The adsorption energy calculations predict the hollow site as the most favorable position of a F atom adsorbed on Ag(100). Unfortunately, atomic resolution requires the tip to be very close to the sample, which perturbs the adatom position. Ref. [25] circumvented this prob- lem by a “split-image” method. Two contigu...
-
[6]
Fluorine adatoms on the Ag(110) surface In the experiments of Ref. [25], three different ATs were identified on the Ag(110) surface: AT(A), the most frequent one, showing the deepest depression; AT(B), with intermediate frequency and depression depth; and AT(C), the rarest with the smallest depression depth. The reported abundance is AT(A) 60%, AT(B) 35%,...
-
[7]
Analytical estimate of the depression depth It is instructive to compute analytically the factors that determine the depression depth in the present model. Restricting to the contribution of silver atoms, the current is written as, I(r, VB) ≈ 4πe ¯h |M |2Nt(0) X R GR5s(ϵ)ρR5s(r), (23) where we used the same approximations as in Eq. (22) and defined the cu...
Show all 79 references
-
[8]
Roman, F
T. Roman, F. Gossenberger, K. Forster-Tonigold, and A. Groß, Phys. Chem. Chem. Phys. 16, 13630 (2014)
2014
-
[9]
Besenbacher and J
F. Besenbacher and J. K. Nørskov, Prog. Surf. Sci. 44, 5 (1993)
1993
-
[10]
B. V. Andryushechkin, T. V. Pavlova, and K. N. Eltsov, Surf. Sci. Rep. 73, 83 (2018)
2018
-
[11]
Miller and A
C. Miller and A. S. Botana, Phys. Rev. B 101, 195116 (2020)
2020
-
[12]
Grochala and R
W. Grochala and R. Hoffmann, Angew. Chemie Int. Ed. 40, 2742 (2001)
2001
-
[13]
S. E. McLain, M. R. Dolgos, D. A. Tennant, J. F. C. Turner, T. Barnes, T. Proffen, B. C. Sales, and R. I. Bewley, Nat. Mater. 5, 561 (2006)
2006
-
[14]
Grochala, Nat
W. Grochala, Nat. Mater. 5, 513 (2006)
2006
-
[15]
Yang and H
X. Yang and H. Su, Sci. Rep. 4, 5420 (2015)
2015
-
[16]
Gawraczy´ nski, D
J. Gawraczy´ nski, D. Kurzyd lowski, R. A. Ewings, S. Ban- daru, W. Gadomski, Z. Mazej, G. Ruani, I. Bergenti, T. Jaro´ n, A. Ozarowski, S. Hill, P. J. Leszczy´ nski, K. Tok´ ar, M. Derzsi, P. Barone, K. Wohlfeld, J. Loren- zana, and W. Grochala, Proc. Natl. Acad. Sci. U. S. A...
2019 arXiv
-
[17]
Grzelak, H
A. Grzelak, H. Su, X. Yang, D. Kurzyd lowski, J. Loren- zana, and W. Grochala, Phys. Rev. Mater. 4, 084405 (2020), arXiv:2005.00461
2020 arXiv
-
[18]
D. V. Tripkovic, D. Strmcnik, D. van der Vliet, V. Sta- menkovic, and N. M. Markovic, Faraday Discuss.140, 25 (2009)
2009
-
[19]
S´ anchez-Movell´ an, J
I. S´ anchez-Movell´ an, J. Moreno-Ceballos, P. Garc ´ ıa- Fern´ andez, J. A. Aramburu, and M. Moreno, Chem. – A Eur. J. , 1 (2021)
2021
-
[20]
Bachar, K
N. Bachar, K. Koteras, J. Gawraczynski, W. Trzci´ nski, J. Paszula, R. Piombo, P. Barone, Z. Mazej, G. Ghir- inghelli, A. Nag, K.-j. Zhou, J. Lorenzana, D. van der Marel, and W. Grochala, Phys. Rev. Res. 4, 023108 (2022), arXiv:2105.08862
2022 arXiv
-
[21]
Piombo, D
R. Piombo, D. Jezierski, H. P. Martins, T. Jaro´ n, M. N. Gastiasoro, P. Barone, K. Tok´ ar, P. Piekarz, M. Derzsi, Z. Mazej, M. Abbate, W. Grochala, and J. Lorenzana, Phys. Rev. B 106, 035142 (2022)
2022
-
[22]
M. A. Prosnikov, J. Magn. Magn. Mater. 557, 10.1016/j.jmmm.2022.169432 (2022)
2022
-
[23]
J. M. Wilkinson, S. J. Blundell, S. Biesenkamp, M. Braden, T. C. Hansen, K. Koteras, W. Grochala, P. Barone, J. Lorenzana, Z. Mazej, and G. Tavˇ car, Phys. Rev. B 107, 144422 (2023)
2023
-
[24]
Ignaczak and J
A. Ignaczak and J. A. Gomes, J. Electroanal. Chem. 420, 71 (1997)
1997
-
[25]
J. A. S´ anchez, A. Caporale, I. Degtev, L. Di Gaspare, L. Persichetti, M. Sansotera, A. G´ omez Pueyo, M. De Seta, J. Lorenzana, and L. Camilli, The initial stages of silver fluorination, arXiv:2410.04858 (2024)
2024 arXiv
-
[26]
Zhu and S.-q
Q. Zhu and S.-q. Wang, J. Electrochem. Soc. 163, H796 (2016)
2016
-
[27]
Zaum and K
C. Zaum and K. Morgenstern, Appl. Phys. Lett. 113, 31602 (2018)
2018
-
[28]
P. M. Spurgeon, D. J. Liu, H. Walen, J. Oh, H. J. Yang, Y. Kim, and P. A. Thiel, Phys. Chem. Chem. Phys. 21, 10540 (2019)
2019
-
[29]
Lee, Y.-J
G. Lee, Y.-J. Lee, K. Palot´ as, T. Lee, and A. Soon, J. Phys. Chem. C 124, 16362 (2020)
2020
-
[30]
W.-X. Li, C. Stampfl, and M. Scheffler, Phys. Rev. B 65, 075407 (2002)
2002
-
[31]
Schintke, S
S. Schintke, S. Messerli, K. Morgenstern, J. Nieminen, and W.-D. Schneider, J. Chem. Phys. 114, 4206 (2001)
2001
-
[32]
W.-X. X. Li, C. Stampfl, and M. Scheffler, Phys. Rev. B 68, 165412 (2003), arXiv:0305312 [cond-mat]
2003
-
[33]
N. D. Lang, Phys. Rev. B 34, 5947 (1986)
1986
-
[34]
N. D. Lang, Phys. Rev. Lett. 58, 45 (1987)
1987
-
[35]
Sautet, Surf
P. Sautet, Surf. Sci. 374, 406 (1997)
1997
-
[36]
Tersoff and D
J. Tersoff and D. R. Hamann, Phys. Rev. Lett. 50, 1998 (1983)
1983
-
[37]
Otero-de-la Roza, M
A. Otero-de-la Roza, M. A. Blanco, A. M. Pend´ as, and V. Lua˜ na, Comput. Phys. Commun.180, 157 (2009)
2009
-
[38]
Otero-de-la Roza, E
A. Otero-de-la Roza, E. R. Johnson, and V. Lua˜ na, Com- put. Phys. Commun. 185, 1007 (2014)
2014
-
[39]
H. W. King, Bull. Alloy Phase Diagrams 2, 401 (1981)
1981
-
[40]
Reuter and M
K. Reuter and M. Scheffler, Phys. Rev. B 65, 035406 (2001)
2001
-
[41]
Kresse and J
G. Kresse and J. Hafner, Phys. Rev. B 47, 558 (1993)
1993
-
[42]
Kresse and J
G. Kresse and J. Furthm¨ uller, Comput. Mater. Sci.6, 15 (1996)
1996
-
[43]
Kresse and J
G. Kresse and J. Furthm¨ uller, Phys. Rev. B 54, 11169 (1996)
1996
-
[44]
Kresse and D
G. Kresse and D. Joubert, Phys. Rev. B 59, 1758 (1999)
1999
-
[45]
J. P. Perdew, A. Ruzsinszky, G. I. Csonka, O. A. Vydrov, G. E. Scuseria, L. A. Constantin, X. Zhou, and K. Burke, Phys. Rev. Lett. 100, 136406 (2008)
2008
-
[46]
P. E. Bl¨ ochl, Phys. Rev. B50, 17953 (1994)
1994
-
[47]
J. Hu, W. Cai, C. Li, Y. Gan, and L. Chen, Applied Physics Letters 86, 151915 (2005), https://pubs.aip.org/aip/apl/article- pdf/doi/10.1063/1.1901803/14332160/151915 1 online.pdf
2005 doi
-
[48]
Patra, J
A. Patra, J. E. Bates, J. Sun, and J. P. Perdew, Proc. Natl. Acad. Sci. 114, E9188 (2017)
2017
-
[49]
Banerjee, S
J. Banerjee, S. Behnle, M. C. E. Galbraith, V. Settels, B. Engels, R. Tonner, and R. F. Fink, J. Comput. Chem. 18 39, 844 (2018)
2018
-
[50]
Neugebauer and M
J. Neugebauer and M. Scheffler, Phys. Rev. B 46, 16067 (1992)
1992
-
[51]
Makov and M
G. Makov and M. C. Payne, Phys. Rev. B 51, 4014 (1995)
1995
-
[52]
than the theoretical value Ed = 1 .49 eV. This is- 6 sue is particularly problematic for oxygen adsorption on Ag(111) [23] where only for very small coverage the the- oretical adsorption energy is negative (exothermic) in re- lation to O 2. However, for F 2 the problem is less...
-
[54]
Dell’Anna, J
L. Dell’Anna, J. Lorenzana, M. Capone, C. Castellani, and M. Grilli, Phys. Rev. B - Condens. Matter Mater. Phys. 71, 064518 (2005), arXiv:0407028 [cond-mat]
2005
-
[55]
Kreisel, R
A. Kreisel, R. Nelson, T. Berlijn, W. Ku, R. Aluru, S. Chi, H. Zhou, U. R. Singh, P. Wahl, R. Liang, W. N. Hardy, D. A. Bonn, P. J. Hirschfeld, and B. M. Andersen, Phys. Rev. B 94, 224518 (2016)
2016
-
[56]
J. P. Perdew, K. Burke, and M. Ernzerhof, Phys. Rev. Lett. 77, 3865 (1996)
1996
-
[57]
Matth ´ ıasson,´A
K. Matth ´ ıasson,´A. Kvaran, G. A. Garcia, P. Weidner, and B. Szt´ aray, Physical Chemistry Chemical Physics23, 8292 (2021)
2021
-
[58]
J. J. DeCorpo, R. P. Steiger, J. L. Franklin, and J. L. Margrave, J. Chem. Phys. 53, 936 (1970)
1970
-
[59]
Since our computation does not take into account the zero-point vibrational energy, it is more fair to remove the vibrational contribution [72] from the experiment, which yields Eexp d = 0.855 eV, still significantly smaller than the theory
-
[60]
Y. Wang, Z. a. Xu, T. Kakeshita, S. Uchida, S. Ono, Y. Ando, and N. P. Ong, Phys. Rev. B64, 224519 (2001)
2001
-
[61]
Scheffler and C
M. Scheffler and C. Stampfl, in Handb. Surf. Sciene - Electron. Struct., edited by K. Horn and M. Scheffler (North-Holland, Amsterdam, 2000) p. 285
2000
-
[62]
Linstrom and W
P. Linstrom and W. Mallard, eds., NIST Chemistry WebBook, NIST Standard Reference Database Number 69 (National Institute of Standards and Technology, Gaithersburg MD, 2023)
2023
-
[63]
Cabrera and N
N. Cabrera and N. F. Mott, Reports Prog. Phys. 12, 308 (1949)
1949
-
[64]
S. R. Qiu and J. A. Yarmoff, Phys. Rev. B 63, 115409 (2001)
2001
-
[65]
See Supplemental Material at [URL will be inserted by publisher] for all the ATs computed and the correspond- ing reference values of the apparent height of the tip
-
[66]
Kohn and L
W. Kohn and L. J. Sham, Phys. Rev. 140, A1133 (1965)
1965
-
[67]
J. H. Schott and H. S. White, J. Phys. Chem. 98, 297 (1994)
1994
-
[68]
J. C. Slater, Phys. Rev. 36, 57 (1930)
1930
-
[69]
Clementi and D
E. Clementi and D. L. Raimondi, J. Chem. Phys. 38, 2686 (1963)
1963
-
[70]
J. B. Mann, Atomic Structure Calculations II. Hartree-Fock Wave functions and Radial Expectation Values: Hydrogen to Lawrencium, Report LA-3691, Tech. Rep. (Los Alamos Scientific Laboratory, Los Alamos, New Mexico, 1968)
1968
-
[71]
J. C. Slater, J. Chem. Phys. 41, 3199 (1964)
1964
-
[72]
R. D. Shannon, Acta Crystallogr. Sect. A 32, 751 (1976)
1976
-
[73]
Sautet and M
P. Sautet and M. Bocquet, Phys. Rev. B - Condens. Mat- ter Mater. Phys. 53, 4910 (1996)
1996
-
[74]
Filippetti and V
A. Filippetti and V. Fiorentini, Eur. Phys. J. B 71, 139 (2009)
2009
-
[75]
Wintterlin, Adv
J. Wintterlin, Adv. Catal. 45, 131 (2000)
2000
-
[76]
R. G. Jones, Prog. Surf. Sci. 27, 25 (1988)
1988
-
[77]
Adsorbed Lay- ers on Surfaces. Part 1: Adsorption on Surfaces and Surface Diffusion of Adsorbates
E. I. Altman, Halogens on metals and semiconduc- tors: Datasheet from Landolt-B¨ ornstein - Group III Condensed Matter · volume 42A 1: “Adsorbed Lay- ers on Surfaces. Part 1: Adsorption on Surfaces and Surface Diffusion of Adsorbates” in SpringerMateri- als (https://doi.org/10...
2001 doi
-
[78]
J. G. Serafin, A. C. Liu, and S. R. Seyedmonir, J. Mol. Catal. A Chem. 131, 157 (1998)
1998
-
[79]
J. A. Pople, M. Head-Gordon, D. J. Fox, K. Raghavachari, and L. A. Curtiss, J. Chem. Phys. 90, 5622 (1989)
1989
Reviewed August 12, 2026 · model on record in the stance chip above.
Discussion (0). Continue with ORCID to comment.