REVIEW 4 major objections 5 minor 97 references
Characterising the molecular line emission in the asymmetric Oph-IRS 48 dust trap: Temperatures, timescales, and sub-thermal excitation
T0 review · 4 major / 5 minor · reviewed 2026-08-12 · deepseek-v4-flash
Pith's one-line read The paper establishes that SO2 emission in the Oph-IRS 48 dust trap is thermalised at about 55 K near the midplane, while CH3OH and H2CO are sub-thermally excited in higher disk layers, so their rotational temperatures of roughly 125 K…
desk verdict Careful new ALMA maps of IRS 48, but the sub-thermal excitation claim rests on RADEX grids that contradict the paper's own optically thick sliver scenario. read the letter →
The pith
A machine-rendered reading of the paper's core claim, the machinery that carries it, and where it could break.
The reading
What carries the argument
The load-bearing tools are the rotational diagram analysis (plotting upper-level column densities against upper-level energies and fitting a straight line to extract rotational temperature and total column density under LTE) and RADEX non-LTE grids that compute how much the rotational temperature deviates from the kinetic temperature across density and temperature space. The scatter in the CH3OH rotational diagram is the diagnostic sign of sub-thermal excitation, and the RADEX grids place the thermalisation boundary near n ≈ $10^{8}$ $cm^{-3}$ for SO2 and H2CO and above $10^{9}$ $cm^{-3}$ for CH3OH. The DALI thermochemical model of the IRS 48 dust trap supplies the gas density, gas temperature, and dust temperature structure that locates these boundaries in the disk and is also used to compute desorption, freeze-out, photodissociation, and turbulent-mixing timescales.
What would settle it
Measure the kinetic temperature directly in the CH3OH and H2CO emitting layers, for example by observing a line with a much higher upper-level energy and critical density than those studied here, or by resolving the vertical emission height with channel maps at sub-0.1" resolution and comparing with the rotational temperatures.
Extended reading notes
Core claim
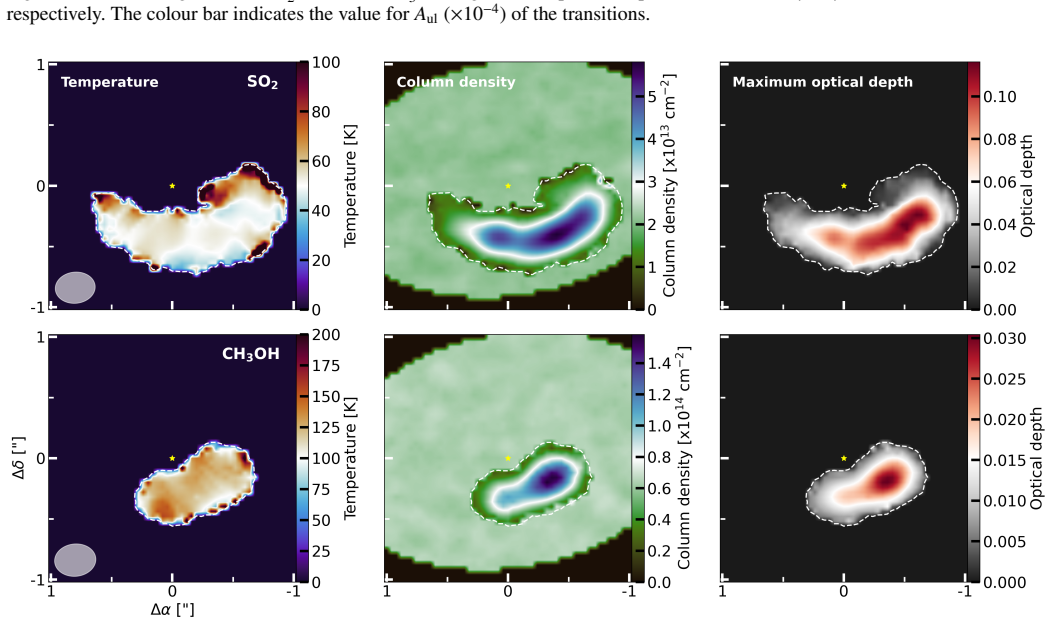
Using 13, 22, and 7 transitions of SO2, CH3OH, and H2CO, the paper constructs pixel-by-pixel rotational diagrams and temperature maps. SO2 gives a well-behaved rotational diagram with T = 54.8 ± 1.4 K, which the paper reads as thermalised emission from a layer within about 5 au of the midplane where gas densities reach roughly $10^{8}$ $cm^{-3}$. CH3OH, by contrast, gives T = 125.5(+3.7/−3.5) K but with large scatter in the rotational diagram, and H2CO line ratios imply T ≈ 150–350 K; non-LTE RADEX grids show that at the model densities of the dust trap both CH3OH and H2CO are sub-thermally excited, meaning their derived rotational temperatures sit below the kinetic temperature. The paper further finds that the SO2 temperature map hints at a radial gradient but that no vortex-induced azimuthal temperature variation is present, and that photodissociation timescales, not turbulent mixing, best explain the observed azimuthal extents.
Load-bearing premise
The DALI model of Leemker et al. (2023) correctly predicts the gas density and temperature structure of the IRS 48 dust trap, and it is used both to locate the thermalisation boundary for the RADEX comparison and to compute every desorption, freeze-out, photodissociation, and turbulent-mixing timescale.
Editorial extensions
If this is right
- For low-mass disks, LTE rotational-diagram temperatures for CH3OH and H2CO will systematically underestimate kinetic temperatures, so non-LTE analyses are needed to derive reliable gas temperatures and abundances.
- SO2 traces the deepest molecular layer probed here, a region within about 5 au of the midplane (z/r < 0.1) at roughly 55 K, while CH3OH and H2CO trace elevated layers near z/r ≈ 0.17–0.25.
- Photodissociation timescales of under a year in the elevated emitting layers explain why CH3OH is azimuthally compact and why SO2 can spread over roughly a quarter of an orbit, but they cannot explain H2CO's wider extent without invoking gas-phase formation from photodissociation products of CH3OH and H2O.
- If H2CO is optically thick, as the low isotopologue ratio suggests, its emission must come from a narrow radial sliver about 10 au wide at the inner edge of the dust trap, and its measured column density is likely beam-diluted by a factor of order 500.
- Any vortex-induced temperature variation in the midplane must be smaller than about 2 K, since the SO2 temperature map shows no azimuthal pattern despite its small pixel-to-pixel uncertainties.
Reading between the lines
- If the sub-thermal excitation picture is right, then existing and future LTE-based chemical surveys of low-mass disks may need re-interpretation: kinetic temperatures could be substantially higher than the rotational temperatures used to infer freeze-out, desorption, and volatile delivery to forming planets.
- The sliver argument makes a sharp, testable prediction: high-resolution ALMA observations with beams smaller than about 8 au should resolve a narrow radial band of H2CO and CH3OH emission at the inner edge of the dust trap rather than a broad molecular layer.
- The claim that H2CO is sustained by gas-phase formation implies that the azimuthal extent of H2CO should be spatially correlated with photodissociation products of CH3OH and H2O, such as CH3 and OH; mapping those radicals could confirm or refute the proposed reservoir.
- The inferred ~2 K upper limit on vortex temperature imprints could be sharpened by observing a midplane tracer at higher spatial resolution, which would directly test whether the anticyclonic vortex motion is actually generating a detectable thermal signature.
Editorial analysis
A structured set of objections, weighed in public.
Referee Report
Summary. The paper presents an analysis of ALMA Band 7 observations of SO2, CH3OH, and H2CO line emission in the asymmetric dust trap around Oph-IRS 48. Using 13, 22, and 7 transitions of the three species, the authors perform pixel-by-pixel rotational diagram analyses for SO2 and CH3OH and use line ratios with RADEX non-LTE calculations for H2CO. They derive rotational temperatures of ~55 K for SO2 and ~125 K for CH3OH, and temperature maps for H2CO in the range ~150-350 K. The well-behaved SO2 rotational diagram indicates thermalized emission near the midplane at densities above ~10^8 cm^-3, while the scattered CH3OH diagram and the H2CO line ratios are interpreted as sub-thermal excitation at elevated layers (z/r ~0.17-0.25), meaning the rotational temperatures underestimate kinetic temperatures. The authors also compute desorption, freeze-out, photodissociation, and turbulent mixing timescales using the DALI model of Leemker et al. (2023), and discuss implications for vertical layering, azimuthal extents, and a possible narrow radial 'sliver' for optically thick H2CO emission.
Significance. If the conclusions hold, the paper provides a valuable demonstration that multi-molecule, multi-transition ALMA analyses can constrain vertical thermal and chemical structure in low-mass planet-forming disks, and that non-LTE excitation is important for molecules such as CH3OH and H2CO in such disks. The study uses a large set of lines per molecule, applies a consistent pixel-by-pixel methodology, and presents maps of temperatures and column densities that can be compared with models. The paper is transparent about its limitations, including the reliance on a thermochemical model for gas densities and the ambiguity in optical depth. The proposed 'sliver' geometry and the predicted vertical ordering (SO2 deep, CH3OH/H2CO high) are falsifiable with higher angular resolution observations, which the authors explicitly identify. The analysis is based on public ALMA data and the methods are standard, making the work reproducible in principle.
major comments (4)
- [5.1 and 5.3.1] The RADEX thermalization grids in Figure 5 are computed at a fixed column density of N=10^12 cm^-2 to ensure optically thin emission, yet Section 5.3.1 argues that the observed column densities are beam-diluted by a factor of ~500 and that the emission (especially H2CO, and likely CH3OH) is optically thick. At the implied column densities (e.g., N(CH3OH) ~6x10^16 cm^-2), line trapping can raise the radiation field within the lines and shift the thermalization boundary to volume densities well below those shown in Figure 5. The sub-thermal excitation conclusion for CH3OH and H2CO is therefore not robust against the column density uncertainty; the authors should re-run the RADEX grids over a range of column densities (or at the optically thick limits) and show that the key contours remain above the DALI densities, or else qualify the conclusion.
- [4.3 and Appendix C] The H2CO temperature map is stated to be unconstrained at the peak-flux pixels: for the ortho and para line pairs (5,3-4,3,2 / 1,5-4,4 and 4,2-4,1 / 0,5-4,4), the observed ratios exceed the maximum RADEX grid values, and the peak position of the 5,0,5-4,0,4 transition falls in this unconstrained region (Appendix C). Consequently, the quoted T~150-350 K range and the associated claim that H2CO is sub-thermally excited at z/r~0.17-0.25 are not directly supported at the position of peak H2CO emission. The authors should either quantify the fraction of affected pixels or show that the sub-thermal conclusion still holds for the temperature range allowed by the unconstrained ratios (e.g., up to 500 K).
- [5.1 and 5.3.2] The large scatter in the CH3OH rotational diagram is attributed to sub-thermal excitation, but the paper itself, in Section 5.3.2, presents evidence that the CH3OH line fluxes are affected by continuum oversubtraction or continuum blocking (see channel maps, Figure G.1). Such effects would also introduce scatter into the rotational diagram, independent of sub-thermal excitation. The paper does not quantify the expected magnitude of these systematic effects on the derived Trot. The sub-thermal interpretation would be strengthened by a demonstration that the residual scatter, after excluding or correcting pixels affected by the continuum feature, still leads to a similar conclusion.
- [5.1 and 6.1] All quantitative conclusions about sub-thermal excitation and the timescales rely on the gas density and temperature structure from the DALI model of Leemker et al. (2023), which is not independently validated for the IRS 48 disk. The thermalization boundary in Figure 5 is compared directly to the model's density profiles; if the actual densities in the CH3OH and H2CO emitting layers were higher by a factor of a few, both species could be thermalized. The paper would be considerably strengthened by a sensitivity analysis that perturbs the model densities (e.g., by 0.3-0.5 dex) and re-evaluates the crossing of the thermalization contours, and by a similar robustness check for the timescale comparisons in Section 6.
minor comments (5)
- [Abstract and Section 6.2] The word 'azimtuhal' appears for 'azimuthal' in the abstract and in Section 6.2; please correct the spelling.
- [Section 5.3.1] The equation for the dilution factor (DF^-1 = Omega2_source / (Omega2_beam + Omega2_source)) is not numbered; consider adding an equation number for clarity.
- [Section 6.1, Eq. (1)] The expression 's 2nsEb,i / pi2mi' for the vibrational frequency has ambiguous parentheses; please write it with explicit brackets, e.g., sqrt(2 n_s E_b,i / (pi^2 m_i)).
- [Section 3.2] The notation 'Delta V_line = sqrt(Delta V^2_thermal + Delta V^2_turbulence)' is clear, but consider defining Delta V_thermal explicitly as the thermal line width for each molecule in the text, rather than only giving a typical value.
- [Appendix C] In the first paragraph, the phrase 'the temperature derived for these pixels is limited by the upper range of 500 K' could be clearer; for example, 'the ratios exceed the grid maximum, so only a lower limit of about 500 K can be inferred for these pixels.'
Circularity Check
No significant circularity; the excitation and layering conclusions are model inferences from independent observations, not restatements of inputs.
full rationale
The rotational temperatures for SO2 and CH3OH are derived directly from observed line fluxes via standard rotational-diagram fits; they are the quantities being interpreted, not fitted inputs that force the sub-thermal conclusion. The sub-thermal claim for CH3OH and H2CO is anchored to RADEX non-LTE calculations over independent grids of kinetic temperature and gas density, combined with the DALI density structure (Leemker et al. 2023). That DALI model is self-cited but was calibrated to continuum and CO isotopologue emission, not to the SO2/CH3OH/H2CO lines used here, so it provides external constraints rather than a self-referential input. The H2CO line-ratio temperatures likewise come from observed ratios matched to RADEX grids, with the assumed column density stated and its optical-thickness consequences checked; the sub-thermal inference is a model output, not an assumed premise. The main scientific concern, that the Figure 5 thermalization grids are computed at N=10^12 cm^-2 (optically thin) while Section 5.3 argues for optically thick, beam-diluted emission, is a potential validity or internal-consistency issue for the sub-thermal conclusion, but it does not make the derivation equivalent to its inputs by construction. No equation in the paper reduces a prediction to an input, and no load-bearing claim is justified solely by a same-author citation.
Assumptions & free parameters
free parameters (4)
- Turbulent plus thermal line width Delta_V =
0.2 km/s
- Gas density n_H2 for H2CO line ratios =
10^7 and 10^8 cm^-3
- H2CO column density in RADEX =
10^14 cm^-2
- Alpha viscosity for turbulent mixing timescale =
10^-4, 10^-3, 10^-2
assumptions (6)
- domain assumption The DALI thermochemical model of Leemker et al. (2023) correctly predicts the gas density and temperature structure of the IRS 48 dust trap.
- domain assumption The molecular line emission is optically thin in the rotational diagram analysis.
- domain assumption Transitions removed by trial and error and visual inspection are genuinely contaminated and their exclusion does not bias the analysis.
- domain assumption The isotopologue ratio H2CO/H2^13CO ~ 4 from Booth et al. (2024) implies the H2CO emission is optically thick.
- standard math Standard LTE radiative transfer relations for rotational diagrams.
- domain assumption An anticyclonic vortex from the Rossby Wave Instability is the cause of the dust trap asymmetry.
Cite this review
Pith. "Pith review of Characterising the molecular line emission in the asymmetric Oph-IRS 48 dust trap: Temperatures, timescales, and sub-thermal excitation." pith.science (2026). https://pith.science/paper/MEMJVOEY
@misc{pith2026241112418,
  author       = {Pith},
  title        = {Pith review of: Characterising the molecular line emission in the asymmetric Oph-IRS 48 dust trap: Temperatures, timescales, and sub-thermal excitation},
  year         = {2026},
  howpublished = {\url{https://pith.science/paper/MEMJVOEY}},
  note         = {Machine review of arXiv:2411.12418}
}
abstract
The ongoing physical and chemical processes in planet-forming disks set the stage for planet formation. The asymmetric disk around the young star Oph-IRS 48 has one of the most well-characterised chemical inventories, showing molecular emission from a wide variety of species at the dust trap. One of the explanations for the asymmetric structure is dust trapping by a perturbation-induced vortex. We aim to constrain the excitation properties of the molecular species SO$_2$, CH$_3$OH, and H$_2$CO. We further characterise the extent of the molecular emission, through the determination of important physical and chemical timescales at the location of the dust trap. We also investigate whether the potential vortex can influence the observable temperature structure of the gas. Through a pixel-by-pixel rotational diagram analysis, we create rotational temperature and column density maps for SO$_2$ and CH$_3$OH, while temperature maps for H$_2$CO are created using line ratios. We find temperatures of $T\sim$55 K and $T\sim$125 K for SO$_2$ and CH$_3$OH, respectively, while the line ratios point towards temperatures of T$\sim$150-300 K for H$_2$CO. The rotational diagram of CH$_3$OH is dominated by scatter and subsequent non-LTE RADEX calculations suggest that both CH$_3$OH and H$_2$CO must be sub-thermally excited. The temperatures suggest that SO$_2$ comes from a layer deep in the disk, while CH$_3$OH and H$_2$CO originate from a higher layer. While a potential radial gradient is seen in the temperature map of SO$_2$, we do not find any hints of a vortex influencing the temperature structure. The determined turbulent mixing timescale is not able to explain the emitting heights of the molecules, but the photodissociation timescales are able to explain the wider azimuthal extents of SO$_2$ and H$_2$CO compared to CH$_3$OH, where a secondary, gas-phase formation reservoir is required for H$_2$CO.
Figures


Figures from the paper (7 more)


Reference graph
Works this paper leans on
-
[1]
J., van Dishoeck, E
Aikawa, Y ., van Zadelhoff, G. J., van Dishoeck, E. F., & Herbst, E. 2002, A&A, 386, 622 Astropy Collaboration, Price-Whelan, A. M., Lim, P. L., et al. 2022, ApJ, 935, 167 Astropy Collaboration, Price-Whelan, A. M., Sip˝ocz, B. M., et al. 2018, AJ, 156, 123 Astropy Collaboration, Robitaille, T. P., Tollerud, E. J., et al. 2013, A&A, 558, A33
2002
-
[2]
L., Cox, R
Atkinson, R., Baulch, D. L., Cox, R. A., et al. 2006, Atmospheric Chemistry & Physics, 6, 3625 Balança, C., Spielfiedel, A., & Feautrier, N. 2016, MNRAS, 460, 3766
2006
-
[3]
R., Bruderer, S., et al
Banzatti, A., Meyer, M. R., Bruderer, S., et al. 2012, ApJ, 745, 90
2012
-
[4]
B., Guzmán, V
Bergner, J. B., Guzmán, V . G., Öberg, K. I., Loomis, R. A., & Pegues, J. 2018, ApJ, 857, 69
2018
-
[5]
Boehler, Y ., Ménard, F., Robert, C. M. T., et al. 2021, A&A, 650, A59
2021
-
[6]
2017, ApJ, 840, 60
Boehler, Y ., Weaver, E., Isella, A., et al. 2017, ApJ, 840, 60
2017
-
[7]
S., Law, C
Booth, A. S., Law, C. J., Temmink, M., Leemker, M., & Macías, E. 2023, A&A, 678, A146
2023
-
[8]
Booth, A. S., Temmink, M., van Dishoeck, E. F., et al. 2024, arXiv e-prints, arXiv:2402.04002
work page Pith review arXiv 2024
Show all 97 references
-
[9]
S., van der Marel, N., Leemker, M., van Dishoeck, E
Booth, A. S., van der Marel, N., Leemker, M., van Dishoeck, E. F., & Ohashi, S. 2021, A&A, 651, L6
2021
-
[10]
D., Bergin, E
Bosman, A. D., Bergin, E. A., Loomis, R. A., et al. 2021, ApJS, 257, 15
2021
-
[11]
M., Herczeg, G
Brown, J. M., Herczeg, G. J., Pontoppidan, K. M., & van Dishoeck, E. F. 2012, ApJ, 744, 116
2012
-
[12]
Brown, W. A. & Bolina, A. S. 2007, MNRAS, 374, 1006
2007
-
[13]
2013, A&A, 559, A46
Bruderer, S. 2013, A&A, 559, A46
2013
-
[14]
F., & van Kempen, T
Bruderer, S., van der Marel, N., van Dishoeck, E. F., & van Kempen, T. A. 2014, A&A, 562, A26
2014
-
[15]
F., Doty, S
Bruderer, S., van Dishoeck, E. F., Doty, S. D., & Herczeg, G. J. 2012, A&A, 541, A91
2012
-
[16]
Brunken, N. G. C., Booth, A. S., Leemker, M., et al. 2022, A&A, 659, A29
2022
-
[17]
T., Fedele, D., Hogerheijde, M
Carney, M. T., Fedele, D., Hogerheijde, M. R., et al. 2018, A&A, 614, A106
2018
-
[18]
T., Hogerheijde, M
Carney, M. T., Hogerheijde, M. R., Guzmán, V . V ., et al. 2019, A&A, 623, A124
2019
-
[19]
T., Hogerheijde, M
Carney, M. T., Hogerheijde, M. R., Loomis, R. A., et al. 2017, A&A, 605, A21
2017
-
[20]
I., Loomis, R
Cleeves, L. I., Loomis, R. A., Teague, R., et al. 2021, ApJ, 911, 29
2021
-
[21]
Crnkovic-Rubsamen, I., Zhu, Z., & Stone, J. M. 2015, MNRAS, 450, 4285 D’Alessio, P., Cantö, J., Calvet, N., & Lizano, S. 1998, ApJ, 500, 411
2015
-
[22]
2003, A&A, 399, 773
Dartois, E., Dutrey, A., & Guilloteau, S. 2003, A&A, 399, 773
2003
-
[23]
Facchini, S., Birnstiel, T., Bruderer, S., & van Dishoeck, E. F. 2017, A&A, 605, A16
2017
-
[24]
M., Simon, J
Flaherty, K., Hughes, A. M., Simon, J. B., et al. 2020, ApJ, 895, 109
2020
-
[25]
M., Simon, J
Flaherty, K., Hughes, A. M., Simon, J. B., et al. 2024, MNRAS, 532, 363
2024
-
[26]
P., Turner, N
Flock, M., Nelson, R. P., Turner, N. J., et al. 2017, ApJ, 850, 131
2017
-
[27]
J., Nelson, R
Flock, M., Turner, N. J., Nelson, R. P., et al. 2020, ApJ, 897, 155
2020
-
[28]
& Preses, J
Fockenberg, C. & Preses, J. M. 2002, Journal of Physical Chemistry A, 106, 2924
2002
-
[29]
& van der Marel, N
Francis, L. & van der Marel, N. 2020, ApJ, 892, 111
2020
-
[30]
W., Cuppen, H
Fuchs, G. W., Cuppen, H. M., Ioppolo, S., et al. 2009, A&A, 505, 629
2009
-
[31]
2024, arXiv e-prints, arXiv:2408.02958 Gaia Collaboration, Brown, A
Furuya, K. 2024, arXiv e-prints, arXiv:2408.02958 Gaia Collaboration, Brown, A. G. A., Vallenari, A., et al. 2018, A&A, 616, A1
2024 arXiv
-
[32]
Goldsmith, P. F. & Langer, W. D. 1999, ApJ, 517, 209 Guzmán, V . V ., Öberg, K. I., Carpenter, J., et al. 2018, ApJ, 864, 170
1999
-
[33]
M., & Lin, M.-K
Hammer, M., Kratter, K. M., & Lin, M.-K. 2017, MNRAS, 466, 3533
2017
-
[34]
& Lin, M.-K
Hammer, M. & Lin, M.-K. 2023, MNRAS, 525, 123
2023
-
[35]
M., & Pinilla, P
Hammer, M., Lin, M.-K., Kratter, K. M., & Pinilla, P. 2021, MNRAS, 504, 3963
2021
-
[36]
M., & Lin, M.-K
Hammer, M., Pinilla, P., Kratter, K. M., & Lin, M.-K. 2019, MNRAS, 482, 3609
2019
-
[37]
R., Millman, K
Harris, C. R., Millman, K. J., van der Walt, S. J., et al. 2020, Nature, 585, 357
2020
-
[38]
Harsono, D., Bruderer, S., & van Dishoeck, E. F. 2015, A&A, 582, A41
2015
-
[39]
1998, ApJ, 495, 385
Hartmann, L., Calvet, N., Gullbring, E., & D’Alessio, P. 1998, ApJ, 495, 385
1998
-
[40]
I., Herbst, E., & Leung, C
Hasegawa, T. I., Herbst, E., & Leung, C. M. 1992, ApJS, 82, 167
1992
-
[41]
N., Bosman, A
Heays, A. N., Bosman, A. D., & van Dishoeck, E. F. 2017, A&A, 602, A105
2017
-
[42]
& van Dishoeck, E
Herbst, E. & van Dishoeck, E. F. 2009, ARA&A, 47, 427 Hernández-Vera, C., Guzmán, V . V ., Artur de la Villarmois, E., et al. 2024, ApJ, 967, 68
2009
-
[43]
2018, ApJ, 867, 3
Huang, P., Isella, A., Li, H., Li, S., & Ji, J. 2018, ApJ, 867, 3
2018
-
[44]
Hunter, J. D. 2007, Computing in Science & Engineering, 9, 90
2007
-
[45]
D., Walsh, C., Booth, A
Ilee, J. D., Walsh, C., Booth, A. S., et al. 2021, ApJS, 257, 9
2021
-
[46]
M., et al
Isella, A., Huang, J., Andrews, S. M., et al. 2018, ApJ, 869, L49
2018
-
[47]
Johnstone, D., Boonman, A. M. S., & van Dishoeck, E. F. 2003, A&A, 412, 157
2003
-
[48]
F., et al
Kama, M., Bruderer, S., van Dishoeck, E. F., et al. 2016, A&A, 592, A83
2016
-
[49]
2019, Chemical Physics Letters, 714, 137
Kayanuma, M., Shoji, M., Furuya, K., et al. 2019, Chemical Physics Letters, 714, 137
2019
-
[50]
2016, in Positioning and Power in Academic Publishing: Players, Agents and Agendas, ed
Kluyver, T., Ragan-Kelley, B., Pérez, F., et al. 2016, in Positioning and Power in Academic Publishing: Players, Agents and Agendas, ed. F. Loizides & B. Schmidt, IOS Press, 87 – 90
2016
-
[51]
J., Benisty, M., Facchini, S., et al
Law, C. J., Benisty, M., Facchini, S., et al. 2024, ApJ, 964, 190
2024
-
[52]
J., Teague, R., Loomis, R
Law, C. J., Teague, R., Loomis, R. A., et al. 2021, ApJS, 257, 4
2021
-
[53]
J., Teague, R., Öberg, K
Law, C. J., Teague, R., Öberg, K. I., et al. 2023b, ApJ, 948, 60 Article number, page 14 of 26 Milou Temmink et al.: Temperatures, timescales, and sub-thermal excitation in the Oph-IRS 48 disk Le Gal, R., Öberg, K. I., Loomis, R. A., Pegues, J., & Bergner, J. B. 2019, ApJ, 876...
2019
-
[54]
S., van Dishoeck, E
Leemker, M., Booth, A. S., van Dishoeck, E. F., et al. 2022, A&A, 663, A23
2022
-
[55]
S., van Dishoeck, E
Leemker, M., Booth, A. S., van Dishoeck, E. F., et al. 2023, A&A, 673, A7
2023
-
[56]
Leemker, M., van’t Hoff, M. L. R., Trapman, L., et al. 2021, A&A, 646, A3
2021
-
[57]
M., Lovelace, R
Li, H., Finn, J. M., Lovelace, R. V . E., & Colgate, S. A. 2000, ApJ, 533, 1023
2000
-
[58]
A., Cleeves, L
Loomis, R. A., Cleeves, L. I., Öberg, K. I., et al. 2018, ApJ, 859, 131
2018
-
[59]
A., Cleeves, L
Loomis, R. A., Cleeves, L. I., Öberg, K. I., Guzman, V . V ., & Andrews, S. M. 2015, ApJ, 809, L25
2015
-
[60]
Lovelace, R. V . E. & Hohlfeld, R. G. 2013, MNRAS, 429, 529
2013
-
[61]
Lovelace, R. V . E., Li, H., Colgate, S. A., & Nelson, A. F. 1999, ApJ, 513, 805
1999
-
[62]
Lovelace, R. V . E. & Romanova, M. M. 2014, Fluid Dynamics Research, 46, 041401
2014
-
[63]
& Pringle, J
Lynden-Bell, D. & Pringle, J. E. 1974, MNRAS, 168, 603
1974
-
[64]
2009, A&A, 497, 869
Lyra, W., Johansen, A., Zsom, A., Klahr, H., & Piskunov, N. 2009, A&A, 497, 869
2009
-
[65]
Meheut, H., Lovelace, R. V . E., & Lai, D. 2013, MNRAS, 430, 1988
2013
-
[66]
2022, ACS Earth and Space Chem- istry, 6, 597 Muñoz-Romero, C
Minissale, M., Aikawa, Y ., Bergin, E., et al. 2022, ACS Earth and Space Chem- istry, 6, 597 Muñoz-Romero, C. E., Öberg, K. I., Law, C. J., et al. 2023, ApJ, 943, 35 Müller, H. S. P., Thorwirth, S., Roth, D. A., & Winnewisser, G. 2001, A&A, 370, L49
2022
-
[67]
Nazari, P., Tabone, B., & Rosotti, G. P. 2023, A&A, 671, A107
2023
-
[68]
A., Theule, P., Mispelaer, F., et al
Noble, J. A., Theule, P., Mispelaer, F., et al. 2012, A&A, 543, A5 Öberg, K. I. & Bergin, E. A. 2021, Phys. Rep., 893, 1 Öberg, K. I., Facchini, S., & Anderson, D. E. 2023, ARA&A, 61, 287
2012
-
[69]
2020, ApJ, 900, 81
Ohashi, S., Kataoka, A., van der Marel, N., et al. 2020, ApJ, 900, 81
2020
-
[70]
Owen, J. E. & Kollmeier, J. A. 2017, MNRAS, 467, 3379 pandas development team, T. 2020, pandas-dev/pandas: Pandas Paneque-Carreño, T., Izquierdo, A. F., Teague, R., et al. 2024, A&A, 684, A174 Paneque-Carreño, T., Miotello, A., van Dishoeck, E. F., et al. 2023, A&A, 669, A126
2017
-
[71]
I., Bergner, J
Pegues, J., Öberg, K. I., Bergner, J. B., et al. 2020, ApJ, 890, 142
2020
-
[72]
M., Walsh, C., & Cuppen, H
Penteado, E. M., Walsh, C., & Cuppen, H. M. 2017, ApJ, 844, 71 Pérez, F. & Granger, B. E. 2007, Computing in Science and Engineering, 9, 21
2017
-
[73]
2022, ApJ, 938, 158
Perrero, J., Enrique-Romero, J., Ferrero, S., et al. 2022, ApJ, 938, 158
2022
-
[74]
2020, A&A, 642, A165
Rab, C., Kamp, I., Dominik, C., et al. 2020, A&A, 642, A165
2020
-
[75]
& Flower, D
Rabli, D. & Flower, D. R. 2010, MNRAS, 406, 95
2010
-
[76]
2021, ApJ, 913, 92
Raettig, N., Lyra, W., & Klahr, H. 2021, ApJ, 913, 92
2021
-
[77]
2024, arXiv e-prints, arXiv:2407.06272 Regály, Z., Kadam, K., & Dullemond, C
Rampinelli, L., Facchini, S., Leemker, M., et al. 2024, arXiv e-prints, arXiv:2407.06272 Regály, Z., Kadam, K., & Dullemond, C. P. 2021, MNRAS, 506, 2685
2024 arXiv
-
[78]
P., Ilee, J
Rosotti, G. P., Ilee, J. D., Facchini, S., et al. 2021, MNRAS, 501, 3427
2021
-
[79]
N., Hogerheijde, M
Salinas, V . N., Hogerheijde, M. R., Mathews, G. S., et al. 2017, A&A, 606, A125
2017
-
[80]
C., Chuang, K.-J., Lamberts, T., et al
Santos, J. C., Chuang, K.-J., Lamberts, T., et al. 2022, ApJ, 931, L33
2022
-
[81]
& Golay, M
Savitzky, A. & Golay, M. J. E. 1964, Analytical Chemistry, 36, 1627 Schöier, F. L., van der Tak, F. F. S., van Dishoeck, E. F., & Black, J. H. 2005, A&A, 432, 369
1964
-
[82]
2006, ApJ, 647, L57
Semenov, D., Wiebe, D., & Henning, T. 2006, ApJ, 647, L57
2006
-
[83]
M., Hogerheijde, M
Stapper, L. M., Hogerheijde, M. R., van Dishoeck, E. F., et al. 2024, A&A, 682, A149
2024
-
[84]
S., van der Marel, N., & van Dishoeck, E
Temmink, M., Booth, A. S., van der Marel, N., & van Dishoeck, E. F. 2023, A&A, 675, A131 Terwisscha van Scheltinga, J., Hogerheijde, M. R., Cleeves, L. I., et al. 2021, ApJ, 906, 111 Terwisscha van Scheltinga, J., Ligterink, N. F. W., Bosman, A. D., Hogerheijde, M. R., & Linna...
2023
-
[85]
F., van Zadelhoff, G
Thi, W. F., van Zadelhoff, G. J., & van Dishoeck, E. F. 2004, A&A, 425, 955
2004
-
[86]
Tielens, A. G. G. M. & Allamandola, L. J. 1987, in Interstellar Processes, ed. D. J. Hollenbach & J. Thronson, Harley A., V ol. 134, 397
1987
-
[87]
2024, A&A, 686, A120 van der Marel, N., Booth, A
Urbina, F., Miley, J., Kama, M., & Keyte, L. 2024, A&A, 686, A120 van der Marel, N., Booth, A. S., Leemker, M., van Dishoeck, E. F., & Ohashi, S. 2021, A&A, 651, L5 van der Marel, N., van Dishoeck, E. F., Bruderer, S., et al. 2016, A&A, 585, A58 van der Marel, N., van Dishoeck...
2024
-
[88]
E., et al
Virtanen, P., Gommers, R., Oliphant, T. E., et al. 2020, Nature Methods, 17, 261
2020
-
[89]
J., & Nomura, H
Walsh, C., Millar, T. J., & Nomura, H. 2010, ApJ, 722, 1607
2010
-
[90]
& Kouchi, A
Watanabe, N. & Kouchi, A. 2002, ApJ, 571, L173
2002
-
[91]
2018, ApJ, 853, 113
Weaver, E., Isella, A., & Boehler, Y . 2018, ApJ, 853, 113
2018
-
[92]
& Faure, A
Wiesenfeld, L. & Faure, A. 2013, MNRAS, 432, 2573
2013
-
[93]
Woitke, P., Kamp, I., & Thi, W. F. 2009, A&A, 501, 383
2009
-
[94]
Xie, T., Allen, M., & Langer, W. D. 1995, ApJ, 440, 674
1995
-
[95]
2023, ApJ, 948, L2
Yang, H., Fernández-López, M., Li, Z.-Y ., et al. 2023, ApJ, 948, L2
2023
-
[96]
2024, ApJ, 963, 134
Yang, H., Fernández-López, M., Li, Z.-Y ., et al. 2024, ApJ, 963, 134
2024
-
[97]
×0.26", whereas those for H2CO are on the order of 0.48
Youdin, A. N. & Lithwick, Y . 2007, Icarus, 192, 588 Article number, page 15 of 26 A&A proofs: manuscript no. aanda Appendix A: SO2, CH3OH, and H2CO transitions Table A.1: The detected transitions of SO2 (top part), CH3OH (middle part), and H2CO (bottom part). Molecule Transit...
2021
Reviewed August 12, 2026 · model on record in the stance chip above.
Discussion (0). Continue with ORCID to comment.