REVIEW 4 major objections 5 minor 52 references
Hydroxyl Lines and Moonlight: a High Spectral Resolution Investigation of NIR skylines from Maunakea to guide NIR spectroscopic surveys
T0 review · 4 major / 5 minor · reviewed 2026-08-11 · deepseek-v4-flash
Pith's one-line read This paper establishes that the Moon's continuum contribution must be included in near-infrared sky subtraction at Moon separations of at least 10 degrees for faint targets and sub-1% residuals, and that OH airglow lines vary on roughly…
desk verdict The OH variability timescales and the public dataset are the real contributions; the 10-degree Moon rule is an uncalibrated extrapolation and should be treated as provisional. read the letter →
The pith
A machine-rendered reading of the paper's core claim, the machinery that carries it, and where it could break.
The reading
What carries the argument
The argument is carried by a two-Gaussian flux model for each of 481 hydroxyl lines, fitted to continuum-filtered spectra, and by two time-series tools: Gaussian process regression with a squared-exponential plus white-noise kernel, which yields the correlation length, and Lomb-Scargle periodograms, which reveal dominant variability periods. The Moon's contribution is separated from the band background by subtracting a linear persistence-decay fit and then fitting the residual flux as an exponential function of angular separation to the Moon. The correlation length is the central quantity because it directly converts the time delay between sky and science frames into a fractional sky-subtraction error.
What would settle it
Measure the NIR continuum background as a function of Moon separation on a photometric night with known aerosol optical depth, extending to separations of 10-15 degrees; if the Moon's contribution at 10 degrees is below 1% of the band-integrated sky background, or if the exponential decay slope differs materially from the values in Table 1, the recommended 10-degree threshold would need revision.
Extended reading notes
Core claim
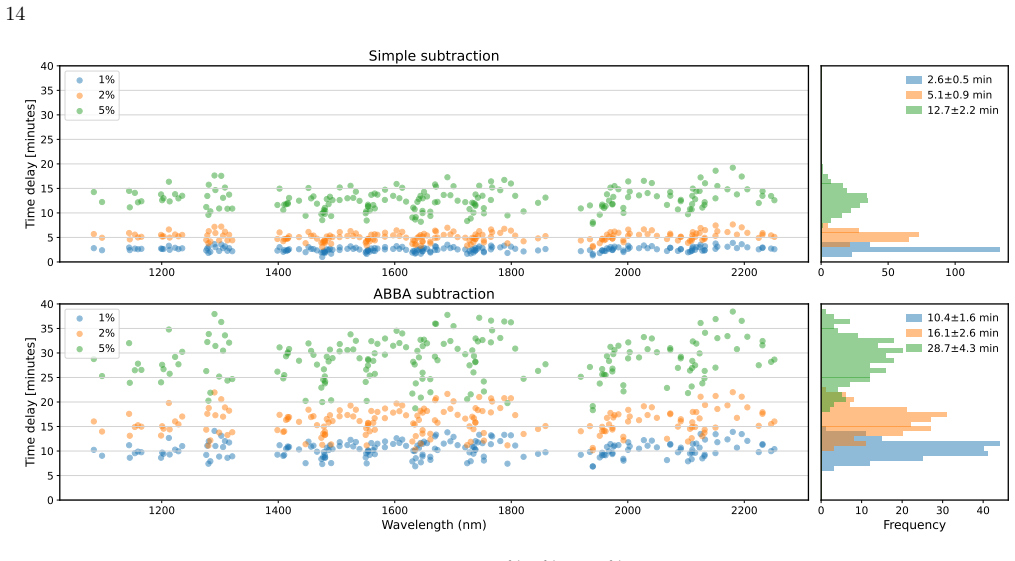
The central discovery is that the NIR night sky on Maunakea has two previously underappreciated variability drivers with directly actionable timescales. The Moon's scattered continuum, measured serendipitously as it passed within about a degree of the spectrograph fiber, decays exponentially with angular separation; the fit indicates the Moon dominates the band-integrated background within roughly 4 degrees in J and 8 degrees in Y, and the paper recommends treating separation distances under 10 degrees as contaminated for demanding observations. Independently, Gaussian process regression on the line fluxes gives a correlation length of about 30 minutes, with a median of 39 minutes for high signal-to-noise lines, implying that simple on/off sky subtraction needs a 3-minute cadence for 1% accuracy, while ABBA subtraction extends that to about 10 minutes. These two results are framed as the first step toward a data-driven sky model for Maunakea.
Load-bearing premise
The 10-degree Moon guideline rests on an exponential fit to only three nights of serendipitous Moon passages, observed out to about 6 degrees, with no correction for lunar phase changes or aerosol scattering, so the threshold is an extrapolation beyond the measured range.
Editorial extensions
If this is right
- Survey schedulers should treat Moon separation under 10 degrees as a constraint for faint NIR targets, especially with PCA-based sky reconstruction or when trying to reach sub-1% residuals.
- ABBA-style observations should keep the two sky frames within about 10 minutes to hold 1% sky-subtraction error, while simple on/off subtraction would require about 3 minutes of sampling.
- The 126 resolved OH doublets form a wavelength-dependent catalog that can be used to predict sky-line contamination at high spectral resolution and below.
- The public spectra and fitting tools are a reusable input for building a Maunakea-specific sky model.
Reading between the lines
- If aerosol optical depth varies significantly, the fixed 10-degree threshold may shift; combining these spectra with simultaneous aerosol measurements could replace the threshold with a separation-versus-contamination curve.
- The homogeneous ~30-minute OH timescale suggests that low-dimensional models (PCA or a trained autoencoder) could predict the full 481-line sky from a few monitored lines, potentially relaxing the required sky cadence.
- The Moon's relative contribution is band-dependent, so a target's science band should set the Moon-separation constraint rather than a single value for all NIR observations.
- Extending this analysis to a second site or to visible airglow would test whether the correlation length and the Moon scaling are transferable or site-specific.
Signed reviews
Editorial analysis
A structured set of objections, weighed in public.
Referee Report
Summary. The paper analyzes 1075 high-resolution NIR sky spectra from SPIRou on Maunakea, including two three-night runs with 5.5-minute cadence, to characterize OH line variability and the Moon's continuum contribution. The authors fit OH lines with one or two Gaussian profiles on a high-pass-filtered continuum, identify 126 resolved doublets, and study temporal variability with Gaussian process regression (GPR) and Lomb-Scargle periodograms. Two survey guidelines are presented: (1) the Moon contribution must be accounted for at separations within 10 degrees when using PCA sky reconstruction, observing targets fainter than about 15 mag, or aiming for sky subtraction better than 1%; and (2) OH lines have a GPR correlation length of about 30 minutes, implying that an ABBA sky-subtraction pattern needs roughly 10 minutes between sky observations for a 1% residual. The data are released on Zenodo (doi:10.5281/zenodo.13363061) and the analysis code is public on GitHub.
Significance. If the guidelines are robust, this would be a direct and useful input for NIR survey scheduling and sky-subtraction strategies, complementing the ESO SkyCalc modeling efforts. The dataset itself is a strong asset: six nights of high-cadence, high-resolution sky spectra with serendipitous Moon passages are rare, and the public data/code release is exemplary. The doublet catalog and the explicit GPR correlation timescales are concrete products that can inform future observing programs. However, the two headline guidelines rest on an extrapolated, uncertainty-free Moon fit and on an incompletely described ABBA residual calculation; as it stands, the paper is more secure as a characterization dataset than as a quantitative survey rule.
major comments (4)
- [Section 4.2, Table 1, Figure 6] The 10-degree Moon-separation guideline is extrapolated from data that the text itself says constrain the continuum only 'to about 6 degrees in all bands' (Section 4.2). Table 1 reports no uncertainties on the exponential fit slopes or intercepts, and the Figure 6 caption states that the three nights were fit without correcting for lunar phase change (illumination varying from 95% to 80%). Because this number appears in the abstract as a survey rule, the authors should either restrict the guideline to the measured range with an explicit extrapolation warning, or quantify the extrapolation, for example by fitting a physical scattering model (e.g., Jones et al. 2013) or by reporting Monte Carlo uncertainties that include phase and aerosol systematic terms.
- [Abstract and Section 4.2] The criterion that the Moon must be accounted for when 'observing targets at YJHK mags fainter than ~15' is not derived anywhere in the paper. No calculation is shown that connects the measured Moon surface brightness (mag arcsec^-2) to a target magnitude threshold for a given sky-subtraction accuracy. Please provide the underlying contrast/signal-to-noise estimate, or explicitly label the 15-mag threshold as an illustrative rule of thumb rather than a quantitative result of this analysis.
- [Sections 3.3 and 4.5, Figure 9] The method for computing the ABBA sky-subtraction timescales is not described. The text states that 'From the GPR fit of each line, we determined the timescale corresponding to a 1%, 2% and 5% sky-subtraction error in an ABBA scenario' but gives no equation or algorithm for converting the GP covariance into an ABBA residual as a function of delay (for example, the residual after subtracting a linear trend over a sliding window). Without this, the headline result of about 10 minutes for a 1% ABBA residual is not reproducible; please add the explicit formula or a clear pseudo-code description.
- [Section 3.3 and Section 4.5, Figure 9] The GPR prior on the correlation length is a log-uniform distribution bounded between 10 minutes and 1 day. The derived ABBA 1% timescale is 10.4 +/- 1.6 min, close to the lower prior boundary, and the simple-subtraction 1% timescale is about 2 minutes, which is below the prior range. This raises the possibility that the prior's lower bound affects the short-lag behavior of the squared-exponential kernel and biases the quoted timescales. Please report a sensitivity test with a lower bound below the sampling cadence (e.g., 2 minutes) or otherwise demonstrate that the 10-minute prior does not drive the ABBA result.
minor comments (5)
- [Section 4.2] The sentence 'subtracted a linear fit of the persistence contribution for angles ranging from 50 to 20 degrees' is unclear: it should specify what is being fit (e.g., background versus time or versus Moon separation) and the intended direction of the angular range (50 to 20 degrees is descending).
- [Table 1 and Figure 6] Table 1 should report uncertainties on the intercept and slope values and should state the exact functional form used (the text says 'exponential decay' but the table columns are labeled 'Slope (degree^-1)', which suggests a different parametrization).
- [Abstract and Section 4.2] The phrasing 'at separation distances less than 10 degrees' (abstract) and 'at Moon separation distances of at least 10 degrees' (Section 4.2) is contradictory; use a consistent phrase such as 'within 10 degrees of the Moon' throughout.
- [Section 4.4 and Table A.1] The doublet identification thresholds (separation within +/-0.05 Angstrom and flux ratio between 0.78 and 1.3) are stated without an estimate of the false-positive rate; a comparison with HITRAN line separations or a bootstrap-style test would strengthen confidence in the 126-doublet catalog.
- [Various] There are several typographical issues: 'Gaussian Proccess' in the Section 3.3 heading, 'a a unique set' in the Conclusions, and 'minuutes' in the Figure 12 caption; the reference list also contains duplicated entries for Noll et al. (2023) and Oliva et al. (2015a).
Circularity Check
No significant circularity: the sky-variability and Moon-continuum results are empirical fits presented as measurements, with extrapolation caveats stated in the paper rather than hidden.
full rationale
This paper is an empirical characterization of NIR sky variability, not a derivation from first principles, and I find no circular step that reduces a claim to its inputs by construction. The Moon-continuum result (Sec. 4.2, Fig. 6, Table 1) is a direct exponential fit to measured continuum levels versus fiber-Moon separation; the 10-degree survey guideline is an extrapolation from that fit, and the paper itself discloses the relevant limitations: 'our observations can track its continuum contribution to about 6 deg in all bands,' 'we did not correct for the Moon phase change between dates,' and 'these angular distances can change if one considers the variation of atmospheric aerosol.' An extrapolation with stated caveats is a robustness risk, not circularity: the conclusion is not already contained in a premise that presupposes it. Similarly, the GPR correlation length (~30 min median, 39 min for high-SNR lines; Sec. 4.5, Fig. 8) and the ABBA sky-subtraction cadence guideline (~10 min for 1%; Fig. 9) are derived from the fitted GPR model of the observed OH time series; they are presented as applied consequences of the fit, not as independent predictions validated against held-out data, so no fitted parameter is renamed as a prediction. The identified doublets are threshold classifications of the fitted line profiles, and the LSP analysis explicitly flags the 5.5-min sampling artifact and the inability to constrain timescales beyond ~0.3 days. Self-citations (Cook et al. 2022 for APERO, Artigau et al. 2018 for persistence, Donati et al. 2018 for SPIRou) are instrument/pipeline references, not load-bearing uniqueness theorems or ansatz sources; the OH line list and doublet physics come from independent literature (Rousselot et al. 2000, HITRAN). No equation in the paper is defined in terms of the result it is used to establish, and no central claim rests on an unverified self-citation chain. The honest finding is therefore no significant circularity.
Assumptions & free parameters
free parameters (10)
- Moon background intercept, Y band =
12.74 mag arcsec^-2
- Moon background intercept, J band =
13.84 mag arcsec^-2
- Moon background intercept, H band =
15.20 mag arcsec^-2
- Moon background intercept, K band =
16.08 mag arcsec^-2
- Moon background slope, Y band =
0.56 degree^-1
- Moon background slope, J band =
0.48 degree^-1
- Moon background slope, H band =
0.42 degree^-1
- Moon background slope, K band =
0.38 degree^-1
- GPR kernel hyperparameters =
Per-line amplitude A, length scale l, white noise sigma; median length scale 39 min for high SNR
- Doublet detection thresholds =
Separation within 0.05 Angstrom, flux ratio 0.78 to 1.3, KDE bandwidth 0.05
assumptions (7)
- domain assumption OH line positions and identities from Rousselot et al. (2000) are accurate enough for centroiding and flux fitting.
- ad hoc to paper The sky line profile is adequately represented by one or two Gaussians on a locally flat continuum after high-pass filtering.
- ad hoc to paper The Moon's continuum contribution follows a single exponential decay with angular separation, independent of lunar phase and aerosol content.
- domain assumption Persistence from daytime calibrations can be removed by a linear fit at Moon separations of 50 to 20 degrees.
- domain assumption The GPR squared-exponential kernel plus white noise captures the true short-term variability structure of OH lines.
- domain assumption The six high-cadence nights and 1075 spectra are representative of Maunakea NIR sky variability for survey design.
- domain assumption Lomb-Scargle periodogram quasi-periodicity is a meaningful description of OH intensity variations.
Cite this review
Pith. "Pith review of Hydroxyl Lines and Moonlight: a High Spectral Resolution Investigation of NIR skylines from Maunakea to guide NIR spectroscopic surveys." pith.science (2026). https://pith.science/paper/VUISOYTH
@misc{pith2026241205473,
  author       = {Pith},
  title        = {Pith review of: Hydroxyl Lines and Moonlight: a High Spectral Resolution Investigation of NIR skylines from Maunakea to guide NIR spectroscopic surveys},
  year         = {2026},
  howpublished = {\url{https://pith.science/paper/VUISOYTH}},
  note         = {Machine review of arXiv:2412.05473}
}
read the original abstract
Subtracting the changing sky contribution from the near-infrared (NIR) spectra of faint astronomical objects is challenging and crucial to a wide range of science cases such as estimating the velocity dispersions of dwarf galaxies, studying the gas dynamics in faint galaxies, measuring accurate redshifts, and any spectroscopic studies of faint targets. Since the sky background varies with time and location, NIR spectral observations, especially those employing fiber spectrometers and targeting extended sources, require frequent sky-only observations for calibration. However, sky subtraction can be optimized with sufficient a priori knowledge of the sky's variability. In this work, we explore how to optimize sky subtraction by analyzing 1075 high-resolution NIR spectra from the CFHT's SPIRou on Maunakea, and we estimate the variability of 481 hydroxyl (OH) lines. These spectra were collected during two sets of three nights dedicated to obtaining sky observations every five and a half minutes. During the first set, we observed how the Moon affects the NIR, which has not been accurately measured at these wavelengths. We suggest accounting for the Moon contribution at separation distances less than 10 degrees when 1) reconstructing the sky using principal component analysis 2) observing targets at Y JHK mags fainter than ~15 and 3) attempting a sky subtraction better than 1%. We also identified 126 spectral doublets, or OH lines that split into at least two components, at SPIRou's resolution. In addition, we used Lomb-Scargle Periodograms and Gaussian process regression to estimate that most OH lines vary on similar timescales, which provides a valuable input for IR spectroscopic survey strategies. The data and code developed for this study are publicly available.
Figures


Figures from the paper (9 more)




Reference graph
Works this paper leans on
-
[1]
2023, ARA&A, 61, 329, doi: 10.1146/annurev-astro-052920-103508
Aigrain, S., & Foreman-Mackey, D. 2023, ARA&A, 61, 329, doi: 10.1146/annurev-astro-052920-103508
-
[2]
Hogg, D. W., & O’Neil, M. 2015, IEEE Transactions on Pattern Analysis and Machine Intelligence, 38, 252, doi: 10.1109/TPAMI.2015.2448083 Artigau, ´E., Saint-Antoine, J., L´ evesque, P.-L., et al. 2018, in Society of Photo-Optical Instrumentation Engineers (SPIE) Conference Series, Vol. 10709, High Energy, Optical, and Infrared Detectors for Astronomy VIII...
arXiv 2015
-
[3]
Ramsay, I. S. McLean, & H. Takami, 914715, doi: 10.1117/12.2055663 Astropy Collaboration, Price-Whelan, A. M., Sip˝ ocz, B. M., et al. 2018, AJ, 156, 123, doi: 10.3847/1538-3881/aabc4f
-
[4]
2021, Sustainability, 13, doi: 10.3390/su13052984
Beamer, K., Tuma, A., Thorenz, A., et al. 2021, Sustainability, 13, doi: 10.3390/su13052984
-
[5]
Bland-Hawthorn, J., Englund, M., & Edvell, G. 2004, Opt. Express, 12, 5902, doi: 10.1364/OPEX.12.005902
-
[6]
2020, Advances in neural information processing systems, 33, 1877
Brown, T., Mann, B., Ryder, N., et al. 2020, Advances in neural information processing systems, 33, 1877
work page 2020
-
[7]
2013a, A&A, 549, A8, doi: 10.1051/0004-6361/201219834 —
Buton, C., Copin, Y., Aldering, G., et al. 2013a, A&A, 549, A8, doi: 10.1051/0004-6361/201219834 —. 2013b, A&A, 549, A8, doi: 10.1051/0004-6361/201219834
-
[8]
J., Artigau, ´E., Doyon, R., et al
Cook, N. J., Artigau, ´E., Doyon, R., et al. 2022, APERO: A PipelinE to Reduce Observations, Astrophysics Source Code Library, record ascl:2211.019. http://ascl.net/2211.019
work page 2022
Show all 52 references
-
[9]
J., ´Etienne Artigau, Doyon, R., et al
Cook, N. J., ´Etienne Artigau, Doyon, R., et al. 2022, Publications of the Astronomical Society of the Pacific, 134, 114509, doi: 10.1088/1538-3873/ac9e74
2022 doi
-
[10]
2018, in Handbook of Exoplanets, ed
Donati, J.-F., Kouach, D., Lacombe, M., et al. 2018, in Handbook of Exoplanets, ed. H. J. Deeg & J. A. Belmonte, 107, doi: 10.1007/978-3-319-55333-7 107
2018 doi
-
[11]
C., & Bland-Hawthorn, J
Ellis, S. C., & Bland-Hawthorn, J. 2008, MNRAS, 386, 47, doi: 10.1111/j.1365-2966.2008.13021.x
2008
-
[12]
W., Lang, D., & Goodman, J
Foreman-Mackey, D., Hogg, D. W., Lang, D., & Goodman, J. 2013, PASP, 125, 306, doi: 10.1086/670067
2013 doi
-
[13]
E., Rothman, L
Gordon, I. E., Rothman, L. S., Hargreaves, R. J., et al. 2022a, JQSRT, 277, 107949, doi: 10.1016/j.jqsrt.2021.107949 —. 2022b, JQSRT, 277, 107949, doi: 10.1016/j.jqsrt.2021.107949
2021
-
[14]
R., Millman, K
Harris, C. R., Millman, K. J., van der Walt, S. J., et al. 2020, Nature, 585, 357, doi: 10.1038/s41586-020-2649-2
2020 doi
-
[15]
Tonry, J. L. 2010, PASP, 122, 722, doi: 10.1086/653715
2010 doi
-
[16]
J., Bouchy, F., Cook, N
Hobson, M. J., Bouchy, F., Cook, N. J., et al. 2021, A&A, 648, A48, doi: 10.1051/0004-6361/202038413
2021 doi
-
[17]
Hunter, J. D. 2007, Computing in Science & Engineering, 9, 90, doi: 10.1109/MCSE.2007.55
2007 doi
-
[18]
2013, A&A, 560, A91, doi: 10.1051/0004-6361/201322433
Kimeswenger, S. 2013, A&A, 560, A91, doi: 10.1051/0004-6361/201322433
2013 doi
-
[19]
2019, A&A, 624, A39, doi: 10.1051/0004-6361/201833759
Jones, A., Noll, S., Kausch, W., et al. 2019, A&A, 624, A39, doi: 10.1051/0004-6361/201833759
2019 doi
-
[20]
S., et al
Jursa, A. S., et al. 1985, Handbook of geophysics and the space environment, Vol. 1 (Air Force Geophysics
1985
-
[21]
2015, A&A, 576, A78, doi: 10.1051/0004-6361/201423909
Kausch, W., Noll, S., Smette, A., et al. 2015, A&A, 576, A78, doi: 10.1051/0004-6361/201423909
2015 doi
- [22]
- [23]
-
[24]
Lomb, N. R. 1976, Ap&SS, 39, 447, doi: 10.1007/BF00648343
1976 doi
-
[25]
2014, A&A, 568, A9, doi: 10.1051/0004-6361/201423790
Moehler, S., Modigliani, A., Freudling, W., et al. 2014, A&A, 568, A9, doi: 10.1051/0004-6361/201423790
2014 doi
-
[26]
2015, in SF2A-2015: Proceedings of the Annual meeting of the French Society of Astronomy and Astrophysics, 205–212, doi: 10.48550/arXiv.1510.01368
Moutou, C., Boisse, I., H´ ebrard, G., et al. 2015, in SF2A-2015: Proceedings of the Annual meeting of the French Society of Astronomy and Astrophysics, 205–212, doi: 10.48550/arXiv.1510.01368
-
[27]
2012, A&A, 543, A92, doi: 10.1051/0004-6361/201219040
Noll, S., Kausch, W., Barden, M., et al. 2012, A&A, 543, A92, doi: 10.1051/0004-6361/201219040
2012 doi
-
[28]
2014, A&A, 567, A25, doi: 10.1051/0004-6361/201423908
Noll, S., Kausch, W., Kimeswenger, S., et al. 2014, A&A, 567, A25, doi: 10.1051/0004-6361/201423908
2014 doi
-
[29]
Noll, S., Plane, J. M. C., Feng, W., et al. 2024, Atmospheric Chemistry and Physics, 24, 1143, doi: 10.5194/acp-24-1143-2024
2024 doi
-
[31]
2023, Journal of Geophysical Research (Atmospheres), 128, e2022JD038275, doi: 10.1029/2022JD038275
Kimeswenger, S. 2023, Journal of Geophysical Research (Atmospheres), 128, e2022JD038275, doi: 10.1029/2022JD038275
2023 doi
-
[32]
2020, Atmospheric Chemistry & Physics, 20, 5269, doi: 10.5194/acp-20-5269-2020 23
Noll, S., Winkler, H., Goussev, O., & Proxauf, B. 2020, Atmospheric Chemistry & Physics, 20, 5269, doi: 10.5194/acp-20-5269-2020 23
2020 doi
-
[33]
2013, A&A, 555, A78, doi: 10.1051/0004-6361/201321366
Oliva, E., Origlia, L., Maiolino, R., et al. 2013, A&A, 555, A78, doi: 10.1051/0004-6361/201321366
2013 doi
-
[34]
2015a, A&A, 581, A47, doi: 10.1051/0004-6361/201526291 —
Oliva, E., Origlia, L., Scuderi, S., et al. 2015a, A&A, 581, A47, doi: 10.1051/0004-6361/201526291 —. 2015b, A&A, 581, A47, doi: 10.1051/0004-6361/201526291
-
[35]
2008, A&A, 481, 575, doi: 10.1051/0004-6361:20079279
Patat, F. 2008, A&A, 481, 575, doi: 10.1051/0004-6361:20079279
2008 doi
-
[36]
2014, in Ground-based and Airborne Instrumentation for Astronomy V, ed
Puech, M., Rodrigues, M., Yang, Y., et al. 2014, in Ground-based and Airborne Instrumentation for Astronomy V, ed. S. K. Ramsay, I. S. McLean, & H. Takami, Vol. 9147, International Society for Optics and Photonics (SPIE), 91476L, doi: 10.1117/12.2055137
2014 doi
-
[37]
E., Williams, C
Rasmussen, C. E., Williams, C. K., et al. 2006, Gaussian processes for machine learning, Vol. 1 (Springer)
2006
-
[38]
2010, in Society of Photo-Optical Instrumentation Engineers (SPIE) Conference Series, Vol
Rodrigues, M., Flores, H., Puech, M., Yang, Y., & Royer, F. 2010, in Society of Photo-Optical Instrumentation Engineers (SPIE) Conference Series, Vol. 7735, Ground-based and Airborne Instrumentation for Astronomy III, ed. I. S. McLean, S. K. Ramsay, & H. Takami, 77356L, doi: 1...
2010 doi
-
[39]
S., Rinsland, C
Rothman, L. S., Rinsland, C. P., Goldman, A., et al. 1998, JQSRT, 60, 665, doi: 10.1016/S0022-4073(98)00078-8
1998 doi
-
[40]
2000, A&A, 354, 1134
Monnet, G. 2000, A&A, 354, 1134
2000
-
[41]
M., Mlynczak, M
Russell, J. M., Mlynczak, M. G., Gordley, L. L., Tansock, J. J., & Esplin, R. W. 1999, in Society of Photo-Optical Instrumentation Engineers (SPIE) Conference Series, Vol. 3756, Optical Spectroscopic Techniques and Instrumentation for Atmospheric and Space Research III, ed. A....
1999 doi
-
[42]
Scargle, J. D. 1982, ApJ, 263, 835, doi: 10.1086/160554
1982 doi
-
[43]
2010, MNRAS, 408, 2495, doi: 10.1111/j.1365-2966.2010.17298.x
Sharp, R., & Parkinson, H. 2010, MNRAS, 408, 2495, doi: 10.1111/j.1365-2966.2010.17298.x
2010
-
[44]
2015, A&A, 576, A77, doi: 10.1051/0004-6361/201423932
Smette, A., Sana, H., Noll, S., et al. 2015, A&A, 576, A77, doi: 10.1051/0004-6361/201423932
2015 doi
-
[46]
T., Lilly, S
Soto, K. T., Lilly, S. J., Bacon, R., Richard, J., & Conseil, S. 2016, MNRAS, 458, 3210, doi: 10.1093/mnras/stw474
2016 doi
-
[47]
Speagle, J. S. 2019, arXiv preprint arXiv:1909.12313
2019 arXiv
-
[48]
2014, in Society of Photo-Optical Instrumentation Engineers (SPIE) Conference Series, Vol
Srinath, S., McGurk, R., Rockosi, C., et al. 2014, in Society of Photo-Optical Instrumentation Engineers (SPIE) Conference Series, Vol. 9148, Adaptive Optics Systems IV, ed. E. Marchetti, L. M. Close, & J.-P. Vran, 91482Z, doi: 10.1117/12.2055672
2014 doi
-
[49]
C., & Morris, E
Staudemeyer, R. C., & Morris, E. R. 2019, arXiv preprint arXiv:1909.09586
2019 arXiv
-
[50]
Q., Ellis, S
Trinh, C. Q., Ellis, S. C., Bland-Hawthorn, J., et al. 2013, AJ, 145, 51, doi: 10.1088/0004-6256/145/2/51
2013 doi
-
[51]
VanderPlas, J. T. 2018, ApJS, 236, 16, doi: 10.3847/1538-4365/aab766
2018 doi
-
[52]
2017, Advances in neural information processing systems, 30
Vaswani, A., Shazeer, N., Parmar, N., et al. 2017, Advances in neural information processing systems, 30
2017
-
[53]
E., et al
Virtanen, P., Gommers, R., Oliphant, T. E., et al. 2020, Nature Methods, 17, 261, doi: 10.1038/s41592-019-0686-2 Wes McKinney. 2010, in Proceedings of the 9th Python in Science Conference, ed. St´ efan van der Walt & Jarrod Millman, 56 – 61, doi: 10.25080/Majora-92bf1922-00a
2020 doi
-
[54]
2016, PASA, 33, e058, doi: 10.1017/pasa.2016.54
Zhang, B., Zhang, L., & Ye, Z. 2016, PASA, 33, e058, doi: 10.1017/pasa.2016.54
2016 doi
Reviewed August 11, 2026 · model on record in the stance chip above.
Discussion (0). Continue with ORCID to comment.