REVIEW 4 major objections 5 minor 68 references
SZ-X-ray Surface Brightness Fluctuations in the SPT-XMM clusters
T0 review · 4 major / 5 minor · reviewed 2026-08-11 · deepseek-v4-flash
Pith's one-line read Turbulent gas in galaxy clusters flows at half the sound speed on average.
desk verdict Solid first large-sample SZ/X-ray fluctuation study, but the headline Mach number rests on treating unresolved spectral endpoints as measured peaks. read the letter →
The pith
A machine-rendered reading of the paper's core claim, the machinery that carries it, and where it could break.
The reading
What carries the argument
The argument runs on the amplitude spectrum of density fluctuations, Aρ(k) = $\sqrt$(4π $k^{3}$ P3D(k)), obtained by deprojecting Mexican-hat wavelet ($\Delta$-variance) power spectra of normalized X-ray residual images, and on the peak of that spectrum, kpeak, taken as a proxy for the turbulent injection scale. The peak amplitude is converted to a Mach number with the linear relations Mρ = 4.0 Aρ(kpeak)(linj/0.4R500)^(−0.25) and MP = 2.4 AP(kpeak)(linj/0.4R500)^(−0.25) from stratified-atmosphere simulations; the linearity of this scaling, which holds only in stratified atmospheres like the ICM, is what makes turbulent velocities accessible from surface brightness fluctuations.
What would settle it
Measure the turbulent velocity directly from the widths or Doppler shifts of X-ray emission lines, such as Fe XXV or Fe XXVI, in a few of the 32 clusters and compare with Mρ inferred from fluctuation peaks; a systematic offset would falsify the linear calibration.
Extended reading notes
Core claim
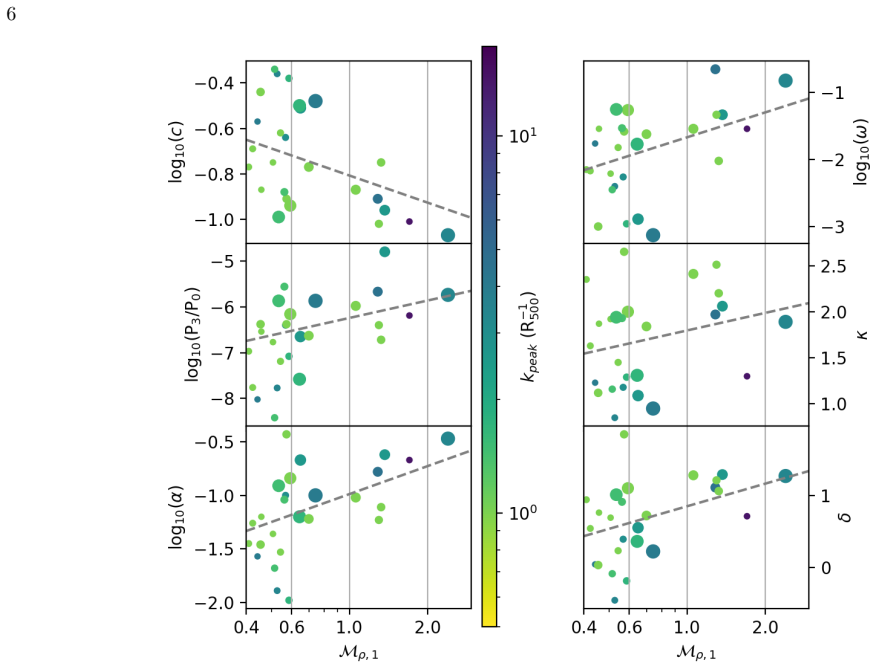
The central claim is that the average 3D turbulent Mach number inside 0.62 R500 is Mρ = 0.52 ± 0.14, matching the Mach numbers expected from cosmological simulations (0.49–0.52) over the same radii. The paper further claims that the distribution of inferred Mach numbers is bimodal or strongly skewed: most clusters are subsonic and turbulence-dominated, while a minority are supersonic, and every supersonic cluster is a known or suspected merger. For the seven clusters with both SZ and X-ray constraints, pressure-based and density-based Mach numbers broadly agree, with the exception of Abell 2744.
Load-bearing premise
The entire velocity measurement rests on the simulated linear calibration between the amplitude of density fluctuations at the spectrum's peak and the turbulent Mach number; if that relation is nonlinear, or if the observed spectra do not show the true peak, the absolute Mach numbers and the claimed agreement with simulations would shift.
Editorial extensions
If this is right
- If the average Mach number is right, the non-thermal pressure fraction within 0.62 R500 is αNT = 0.13 ± 0.06, implying a hydrostatic mass bias smaller than about 0.13 in that region.
- Clusters with inferred supersonic Mach numbers should be excluded from turbulence-based mass-bias corrections, since they are likely shock-dominated mergers rather than turbulence-dominated systems.
- The absence of correlation between Mach number and mass or redshift means turbulence at these radii is set by dynamical state rather than cluster scale, allowing samples at different redshifts to be compared without rescaling.
- Deeper SZ data, which the paper expects to improve pressure-fluctuation sensitivity by roughly a factor of ten, should extend the X-ray density constraints into a pressure-based comparison out toward R500.
- The few clusters with subsonic constraints in the outer ring give an upper limit on the hydrostatic mass bias near R500 of about 0.16 ± 0.08, though this rests on only four clusters.
Reading between the lines
- If the linear calibration holds, the apparent bimodality of Mach numbers gives a clean empirical separator between turbulence-dominated and shock-dominated systems that could be used to build a cleaner sample for hydrostatic mass-bias calibration.
- Because kpeak is used as a proxy for the injection scale and several amplitude spectra are flat, the absolute Mach numbers carry a systematic uncertainty tied to the injection-scale assumption; a direct spectroscopic velocity measurement of even a few clusters would anchor the calibration.
- A testable extension: applying the same peak-amplitude scaling to next-generation SZ survey maps should yield pressure-based Mach numbers near 0.5; agreement with the X-ray value would support the linear scaling across two independent tracers.
Editorial analysis
A structured set of objections, weighed in public.
Referee Report
Summary. The paper analyzes SZ and X-ray surface brightness fluctuations for 60 SPT-selected clusters with XMM-Newton data, deriving density and pressure fluctuation amplitude spectra within 0.62 R500. For 32 clusters with a detected density-fluctuation peak (SNR > 2), the authors infer 3D turbulent Mach numbers using the linear Gaspari & Churazov (2013) calibration, obtaining a sample average M_rho = 0.52 ± 0.14 for the 25 subsonic clusters and claiming agreement with cosmological simulations (B12, N14, A20). They also report mild correlations with dynamical state parameters, broad consistency between pressure- and density-inferred Mach numbers for seven clusters, and evidence for a bimodal or skewed unimodal Mach number distribution. Methodological details include substructure masking, wavelet-based power spectra, and robustness tests across SNR thresholds.
Significance. If the absolute Mach-number calibration is reliable, this is one of the largest observational constraints on ICM turbulence within R500, with direct implications for non-thermal pressure support and the hydrostatic mass bias. The combined SZ+X-ray approach and the explicit discussion of selection effects and systematics are strengths. The paper is transparent about its limitations, and the correlations with dynamical parameters are a useful step toward using surface brightness fluctuations as a dynamical-state probe. The claimed agreement with simulations is suggestive but, as detailed below, depends critically on the treatment of unresolved spectral peaks.
major comments (4)
- [Section 3.3, Eq. (2), Appendix C, Table 3] The central claim, M_rho = 0.52 ± 0.14, depends on identifying kpeak as the injection scale, but Table 3 shows that 18 of 32 clusters have kpeak = 1.0 R500^-1, which is the coarsest sampled node. Appendix C explicitly states that 'an average injection scale in either Ring is fairly unconstrained as we do not see a clear peak/turnover in the amplitude spectra.' For these clusters, A_rho(kpeak) is an adopted endpoint of a flat or rising spectrum, not a measured peak amplitude. The kpeak-dependent factor in Eq. (2) changes the amplitude-to-Mach conversion by roughly a factor of two across the sample, so the quoted mean and the agreement with B12, N14, and A20 are not robust. The stability tests in Section 3.3 vary only the SNR threshold and do not address this systematic. The authors should either restrict the claim to clusters with a genuine turnover, propagate a systematic uncertainty from kpeak, or present the result as conditional on the unresolved injection-scale assumption.
- [Abstract and Section 3.3] The abstract quotes 'average Mach number M3D = 0.52 ± 0.14' without specifying that ±0.14 is the intrinsic scatter of the distribution, not the uncertainty on the mean. The statistical uncertainties on the weighted means are ~0.02 (Section 3.3), while the intrinsic scatter is 0.12-0.14. As written, the abstract overstates the precision of the measurement and could mislead readers into interpreting ±0.14 as the error on the average. The text should clearly distinguish between measurement uncertainty and intrinsic scatter, e.g., by reporting the error on the mean separately.
- [Section 3.3, Figure 5, Eqs. (2)-(3)] The comparison between M_P and M_rho is presented as 'broad agreement,' but Eqs. (2) and (3) use different normalization coefficients (4.0 for density, 2.4 for pressure) and the same injection-scale scaling. A direct one-to-one comparison of the two Mach numbers is not meaningful unless the different calibrations are taken into account, since density and pressure fluctuations respond differently to the same velocity field. The authors should either compare the underlying fluctuation amplitudes A_rho and A_P, or rescale one relation to the other before claiming consistency. This is a secondary claim, but as it stands the comparison is not well posed.
- [Appendix B, Section 4.2] The substructure masking algorithm relies on cluster-independent tuning factors g_k that were chosen iteratively to achieve 'visual consistency' across cameras. The paper does not quantify how the choice of g_k affects the recovered fluctuation amplitudes and hence the inferred Mach numbers, despite noting in Section 4.2 that masking can either increase or decrease fluctuations (e.g., SPT-CLJ0014-3022 and SPT-CLJ0225-4155). Since the reported uncertainties do not include this systematic, the authors should provide a sensitivity test (e.g., varying g_k by ±20% and recomputing the mean Mach number) to justify the error budget that supports the central value.
minor comments (5)
- [Table 1, Note] The table note says 'obtained between either log Aρ(kpeak) or log Aρ(kpeak)' but the second quantity should be log Mρ(kpeak).
- [Appendix D] The text states 'Mρ,2 = 0.59 ± 18'; this should presumably be 0.59 ± 0.18.
- [Abstract] The abstract says 'within 0.6 R500' while the main text and Section 2 use 0.62 R500; the numbers should be made consistent.
- [Section 2.1.1] The phrase 'we did not investigate masking substructure' in the context of the pilot study is clear, but it would be helpful to state whether the pilot clusters were checked for substructure visually and found to be free of it, to justify the difference in treatment.
- [Section 3.1, Table 1] The correlation coefficients are reported with credible intervals that mostly exclude zero, but there is no correction for the number of parameters tested; a brief statement about multiple-testing would strengthen the interpretation.
Circularity Check
No significant circularity: the Mach numbers are measured fluctuation amplitudes converted with an externally published simulation calibration, and the simulation comparison uses separate, independent simulations.
full rationale
The paper's derivation chain is: measure X-ray and SZ surface brightness fluctuation power spectra, deproject to density/pressure amplitude spectra A_rho and A_P, define a peak k_peak among nodes with SNR > 2, and convert to Mach numbers using the published Gaspari & Churazov (2013) linear scalings (Eqs. 2-3). None of the coefficients in those scalings (4.0, 2.4, alpha_H = -0.25) are fit to the SPT-XMM data; they come from an earlier, independent simulation calibration. The headline M_3D = 0.52 +/- 0.14 is therefore a measured amplitude times a fixed external calibration, and the comparison to Battaglia et al. (2012), Nelson et al. (2014), and Angelinelli et al. (2020) uses simulations different from the calibration simulation, so the agreement is not enforced by construction. The paper's own robustness tests (2-5 sigma cuts, Section 3.3) vary only the selection threshold, not the calibration; that is a limitation on absolute accuracy given flat or unresolved spectra (Appendix C), but it is not circularity. Self-citations (Khatri & Gaspari 2016; Romero et al. 2023, 2024) are method lineage, and the load-bearing Eq. 2 calibration is independently published and parameter-free with respect to this dataset. No equation in the paper reduces to its own input, and no predicted quantity is a renamed fit. Score 2 reflects only minor non-load-bearing self-citation, not circularity.
Assumptions & free parameters
free parameters (1)
- Substructure masking tuning factors g_k =
0.5 < g < 2 (per smoothing kernel)
assumptions (5)
- domain assumption Linear scaling between density fluctuation amplitude and turbulent Mach number (Eq. 2) with coefficients from Gaspari & Churazov (2013).
- domain assumption kpeak is a valid proxy for the injection wavenumber kinj.
- domain assumption αH = -0.25 describes the ICM hydrodynamical regime with negligible thermal conduction.
- domain assumption Circular β models plus a background represent the smooth emission; residuals are fluctuations.
- domain assumption The deprojection from 2D surface brightness power spectra to 3D density and pressure power spectra is as in Romero et al. (2024).
Cite this review
Pith. "Pith review of SZ-X-ray Surface Brightness Fluctuations in the SPT-XMM clusters." pith.science (2026). https://pith.science/paper/QVDWNTZR
@misc{pith2026241205478,
  author       = {Pith},
  title        = {Pith review of: SZ-X-ray Surface Brightness Fluctuations in the SPT-XMM clusters},
  year         = {2026},
  howpublished = {\url{https://pith.science/paper/QVDWNTZR}},
  note         = {Machine review of arXiv:2412.05478}
}
abstract
The hot plasma in galaxy clusters, the intracluster medium (ICM), is expected to be shaped by subsonic turbulent motions, which are key for heating, cooling, and transport mechanisms. The turbulent motions contribute to the non-thermal pressure which, if not accounted for, consequently imparts a hydrostatic mass bias. Accessing information about turbulent motions is thus of major astrophysical and cosmological interest. Characteristics of turbulent motions can be indirectly accessed through surface brightness fluctuations. This study expands on our pilot investigations of surface brightness fluctuations in the SZ and X-ray by examining, for the first time, a large sample of 60 clusters using \textit{both} SPT-SZ and XMM-Newton data and span the redshift range $0.2 < z < 1.5$, thus constraining the respective pressure and density fluctuations within 0.6~$R_{500}$. We deem density fluctuations to be of sufficient quality for 32 clusters, finding mild correlations between the peak of the amplitude spectra of density fluctuations and various dynamical parameters. We infer turbulent velocities from density fluctuations with an average Mach number $\mathcal{M}_{\text{3D}} = 0.52 \pm 0.14$, in agreement with numerical simulations. For clusters with inferred turbulent Mach numbers from both pressure, $\mathcal{M}_{\text{P}}$ and density fluctuations, $\mathcal{M}_{\rho}$, we find broad agreement between $\mathcal{M}_{\text{P}}$ and $\mathcal{M}_{\rho}$. Our results suggest either a bimodal or skewed unimodal Mach number distribution, with the majority of clusters being turbulence-dominated (subsonic) while the remainder are shock-dominated (supersonic).
Figures


Figures from the paper (9 more)


Reference graph
Works this paper leans on
-
[1]
, " * write output.state after.block = add.period write newline
ENTRY address archivePrefix author booktitle chapter doi edition editor eprint howpublished institution journal key month number organization pages publisher school series title misctitle type volume year version url label extra.label sort.label short.list INTEGERS output.state before.all mid.sentence after.sentence after.block FUNCTION init.state.consts ...
-
[2]
write newline
" write newline "" before.all 'output.state := FUNCTION format.url url empty "" new.block "" url * "" * if FUNCTION format.eprint eprint empty "" archivePrefix empty "" archivePrefix "arXiv" = new.block " " eprint * " " * new.block " " eprint * " " * if if if FUNCTION format.doi doi empty "" " " doi * " " * if FUNCTION format.pid doi empty eprint empty ur...
-
[3]
<8 z**uW_+I ) v ڗ:M Cs(i 0,ӎJ쬸 g_ _KkQMϾf
thebibliography [1] 20pt to REFERENCES 6pt =0pt -12pt 10pt plus 3pt =0pt =0pt =1pt plus 1pt =0pt =0pt -12pt =13pt plus 1pt =20pt =13pt plus 1pt \@M =10000 =-1.0em =0pt =0pt 0pt =0pt =1.0em @enumiv\@empty 10000 10000 `\.\@m \@noitemerr \@latex@warning Empty `thebibliography' environment \@ifnextchar \@reference \@latexerr Missing key on reference command E...
-
[4]
2020, , 495, 864, 10.1093/mnras/staa975
Angelinelli , M., Vazza , F., Giocoli , C., et al. 2020, , 495, 864, 10.1093/mnras/staa975
-
[5]
2012, , 426, 1793, 10.1111/j.1365-2966.2012.21789.x
Ar \'e valo , P., Churazov , E., Zhuravleva , I., Hern \'a ndez-Monteagudo , C., & Revnivtsev , M. 2012, , 426, 1793, 10.1111/j.1365-2966.2012.21789.x
arXiv 2012
-
[6]
Astropy Collaboration , Robitaille , T. P., Tollerud , E. J., et al. 2013, , 558, A33, 10.1051/0004-6361/201322068
-
[7]
Astropy Collaboration , Price-Whelan , A. M., Lim , P. L., et al. 2022, , 935, 167, 10.3847/1538-4357/ac7c74
-
[8]
2020, Astronomische Nachrichten, 341, 224, 10.1002/asna.202023782
Barret , D., Decourchelle , A., Fabian , A., et al. 2020, Astronomische Nachrichten, 341, 224, 10.1002/asna.202023782
Show all 68 references
-
[9]
R., Pfrommer , C., & Sievers , J
Battaglia , N., Bond , J. R., Pfrommer , C., & Sievers , J. L. 2012, , 758, 74, 10.1088/0004-637X/758/2/74
2012 doi
- [10]
-
[11]
A., Ade , P
Benson , B. A., Ade , P. A. R., Ahmed , Z., et al. 2014, in , Vol. 9153, Millimeter, Submillimeter, and Far-Infrared Detectors and Instrumentation for Astronomy VII, 91531P, 10.1117/12.2057305
2014 doi
-
[12]
E., Stalder , B., de Haan , T., et al
Bleem , L. E., Stalder , B., de Haan , T., et al. 2015, , 216, 27, 10.1088/0067-0049/216/2/27
2015 doi
-
[13]
P., Schrabback , T., et al
Bocquet , S., Dietrich , J. P., Schrabback , T., et al. 2019, , 878, 55, 10.3847/1538-4357/ab1f10
2019 doi
-
[14]
N., Mohr , J
Bulbul , E., Chiu , I. N., Mohr , J. J., et al. 2019, , 871, 50, 10.3847/1538-4357/aaf230
2019 doi
-
[15]
2012, , 421, 1123, 10.1111/j.1365-2966.2011.20372.x
Churazov , E., Vikhlinin , A., Zhuravleva , I., et al. 2012, , 421, 1123, 10.1111/j.1365-2966.2011.20372.x
2012
-
[16]
W., Johnston-Hollitt , M., Bartalucci , I., Hodgson , T., & Pratt , G
Duchesne , S. W., Johnston-Hollitt , M., Bartalucci , I., Hodgson , T., & Pratt , G. W. 2021, , 38, e005, 10.1017/pasa.2020.51
2021 doi
-
[17]
2023, , 673, A91, 10.1051/0004-6361/202245779
Dupourqu \'e , S., Clerc , N., Pointecouteau , E., et al. 2023, , 673, A91, 10.1051/0004-6361/202245779
2023 doi
- [18]
-
[19]
2017, , 843, L29, 10.3847/2041-8213/aa7c1a
Eckert , D., Gaspari , M., Vazza , F., et al. 2017, , 843, L29, 10.3847/2041-8213/aa7c1a
2017 doi
-
[20]
W., Lang , D., & Goodman , J
Foreman-Mackey , D., Hogg , D. W., Lang , D., & Goodman , J. 2013, , 125, 306, 10.1086/670067
2013 doi
-
[21]
2014 a , , 783, L10, 10.1088/2041-8205/783/1/L10
Gaspari , M., Brighenti , F., Temi , P., & Ettori , S. 2014 a , , 783, L10, 10.1088/2041-8205/783/1/L10
2014 doi
-
[22]
2013, , 559, A78, 10.1051/0004-6361/201322295
Gaspari , M., & Churazov , E. 2013, , 559, A78, 10.1051/0004-6361/201322295
2013 doi
-
[23]
T., & Zhuravleva , I
Gaspari , M., Churazov , E., Nagai , D., Lau , E. T., & Zhuravleva , I. 2014 b , , 569, A67, 10.1051/0004-6361/201424043
2014 doi
-
[24]
2020, Nature Astronomy, 4, 10, 10.1038/s41550-019-0970-1
Gaspari , M., Tombesi , F., & Cappi , M. 2020, Nature Astronomy, 4, 10, 10.1038/s41550-019-0970-1
2020 doi
-
[25]
2019, , 884, 169, 10.3847/1538-4357/ab3c5d
Gaspari , M., Eckert , D., Ettori , S., et al. 2019, , 884, 169, 10.3847/1538-4357/ab3c5d
2019 doi
-
[26]
L., Valkonen , L
G \'o mez , P. L., Valkonen , L. E., Romer , A. K., et al. 2012, , 144, 79, 10.1088/0004-6256/144/3/79
2012 doi
-
[27]
2024, , 528, 7274, 10.1093/mnras/stae208
Heinrich , A., Zhuravleva , I., Zhang , C., et al. 2024, , 528, 7274, 10.1093/mnras/stae208
2024 doi
-
[28]
S., Nandra , K., Clerc , N., & Gaspari , M
Hofmann , F., Sanders , J. S., Nandra , K., Clerc , N., & Gaspari , M. 2016, , 585, A130, 10.1051/0004-6361/201526925
2016 doi
-
[29]
Kelly , B. C. 2007, , 665, 1489, 10.1086/519947
2007 doi
-
[30]
C., & David , L
Kempner , J. C., & David , L. P. 2004, , 349, 385, 10.1111/j.1365-2966.2004.07534.x
2004
-
[31]
2016, , 463, 655, 10.1093/mnras/stw2027
Khatri , R., & Gaspari , M. 2016, , 463, 655, 10.1093/mnras/stw2027
2016 doi
-
[32]
V., Churazov , E
Komarov , S. V., Churazov , E. M., Kunz , M. W., & Schekochihin , A. A. 2016, , 460, 467, 10.1093/mnras/stw963
2016 doi
- [33]
-
[34]
V., & Borgani , S
Kravtsov , A. V., & Borgani , S. 2012, , 50, 353, 10.1146/annurev-astro-081811-125502
2012 doi
-
[35]
T., Gaspari , M., Nagai , D., & Coppi , P
Lau , E. T., Gaspari , M., Nagai , D., & Coppi , P. 2017, , 849, 54, 10.3847/1538-4357/aa8c00
2017 doi
-
[36]
R., Jones , C., et al
Lovisari , L., Forman , W. R., Jones , C., et al. 2017, , 846, 51, 10.3847/1538-4357/aa855f
2017 doi
-
[37]
2024, , 682, A45, 10.1051/0004-6361/202346651
Lovisari , L., Ettori , S., Rasia , E., et al. 2024, , 682, A45, 10.1051/0004-6361/202346651
2024 doi
-
[38]
H., David , L., et al
Markevitch , M., Gonzalez , A. H., David , L., et al. 2002, , 567, L27, 10.1086/339619
2002 doi
-
[39]
R., & Nulsen , P
McNamara , B. R., & Nulsen , P. E. J. 2012, New Journal of Physics, 14, 055023, 10.1088/1367-2630/14/5/055023
2012 doi
-
[40]
2013, arXiv e-prints, arXiv:1306.2307
Nandra , K., Barret , D., Barcons , X., et al. 2013, arXiv e-prints, arXiv:1306.2307. 1306.2307
2013 arXiv
-
[41]
T., & Nagai , D
Nelson , K., Lau , E. T., & Nagai , D. 2014, , 792, 25, 10.1088/0004-637X/792/1/25
2014 doi
-
[42]
2023, , 954, 56, 10.3847/1538-4357/ace359
Olivares , V., Su , Y., Forman , W., et al. 2023, , 954, 56, 10.3847/1538-4357/ace359
2023 doi
-
[43]
2024, , 689, A218, 10.1051/0004-6361/202450697
Pasini , T., De Gasperin , F., Br \"u ggen , M., et al. 2024, , 689, A218, 10.1051/0004-6361/202450697
2024 doi
-
[44]
A., Ade , P
Plagge , T., Benson , B. A., Ade , P. A. R., et al. 2010, , 716, 1118, 10.1088/0004-637X/716/2/1118
2010 doi
-
[45]
W., Arnaud, M., Biviano, A., et al
Pratt, G. W., Arnaud, M., Biviano, A., et al. 2019, Space Science Reviews, 215, 25, 10.1007/s11214-019-0591-0
2019 doi
-
[46]
2021, , 500, 2236, 10.1093/mnras/staa3432
Raja , R., Rahaman , M., Datta , A., et al. 2021, , 500, 2236, 10.1093/mnras/staa3432
2021 doi
-
[47]
Romero , C. E. 2024, , 975, 197, 10.3847/1538-4357/ad794f
2024 doi
-
[48]
E., Gaspari , M., Schellenberger , G., et al
Romero , C. E., Gaspari , M., Schellenberger , G., et al. 2023, , 951, 41, 10.3847/1538-4357/acd3f0
2023 doi
- [49]
-
[50]
2017, , 468, 1917, 10.1093/mnras/stx493
Rossetti , M., Gastaldello , F., Eckert , D., et al. 2017, , 468, 1917, 10.1093/mnras/stx493
2017 doi
-
[51]
Schuecker , P., Finoguenov , A., Miniati , F., B \"o hringer , H., & Briel , U. G. 2004, , 426, 387, 10.1051/0004-6361:20041039
2004 doi
-
[52]
2020, , 495, 784, 10.1093/mnras/staa1221
Shi , X., Nagai , D., Aung , H., & Wetzel , A. 2020, , 495, 784, 10.1093/mnras/staa1221
2020 doi
-
[53]
A., Pierpaoli , E., Sayers , J., et al
Shitanishi , J. A., Pierpaoli , E., Sayers , J., et al. 2018, , 481, 749, 10.1093/mnras/sty2195
2018 doi
-
[54]
2019, , 215, 24, 10.1007/s11214-019-0590-1
Simionescu , A., ZuHone , J., Zhuravleva , I., et al. 2019, , 215, 24, 10.1007/s11214-019-0590-1
2019 doi
-
[55]
2022, , 658, A149, 10.1051/0004-6361/202141703
Simonte , M., Vazza , F., Brighenti , F., et al. 2022, , 658, A149, 10.1051/0004-6361/202141703
2022 doi
-
[56]
L., Mushotzky , R
Snowden , S. L., Mushotzky , R. F., Kuntz , K. D., & Davis , D. S. 2008, , 478, 615, 10.1051/0004-6361:20077930
2008 doi
-
[57]
A., & Zel'dovich , Y
Sunyaev , R. A., & Zel'dovich , Y. B. 1972, Comments Astrophys. Space Phys., 4, 173
1972
-
[58]
2018, astropy v3.0.5: a core python package for astronomy , 3.0.5, Zenodo, 10.5281/zenodo.1461536
The Astropy Collaboration . 2018, astropy v3.0.5: a core python package for astronomy , 3.0.5, Zenodo, 10.5281/zenodo.1461536
2018 doi
-
[59]
J., de Gasperin , F., Akamatsu , H., et al
van Weeren , R. J., de Gasperin , F., Akamatsu , H., et al. 2019, , 215, 16, 10.1007/s11214-019-0584-z
2019 doi
-
[60]
M., Meece , G., Li , Y., et al
Voit , G. M., Meece , G., Li , Y., et al. 2017, , 845, 80, 10.3847/1538-4357/aa7d04
2017 doi
-
[61]
2020, , 498, 4983, 10.1093/mnras/staa2747
Wittor , D., & Gaspari , M. 2020, , 498, 4983, 10.1093/mnras/staa2747
2020 doi
- [62]
-
[63]
2020, arXiv e-prints, arXiv:2003.04962
XRISM Science Team . 2020, arXiv e-prints, arXiv:2003.04962. 2003.04962
2020 arXiv
-
[64]
S., Han , J
Yuan , Z. S., Han , J. L., & Wen , Z. L. 2022, , 513, 3013, 10.1093/mnras/stac1037
2022 doi
-
[65]
C., Churazov , E., et al
Zhuravleva , I., Chen , M. C., Churazov , E., et al. 2023, , 10.1093/mnras/stad470
2023 doi
-
[66]
M., Schekochihin , A
Zhuravleva , I., Churazov , E. M., Schekochihin , A. A., et al. 2014, , 788, L13, 10.1088/2041-8205/788/1/L13
2014 doi
-
[67]
2015, , 450, 4184, 10.1093/mnras/stv900
Zhuravleva , I., Churazov , E., Ar \'e valo , P., et al. 2015, , 450, 4184, 10.1093/mnras/stv900
2015 doi
-
[68]
A., Kunz, M
ZuHone, J. A., Kunz, M. W., Markevitch, M., Stone, J. M., & Biffi, V. 2015, The Astrophysical Journal, 798, 90, 10.1088/0004-637X/798/2/90
2015 doi
Reviewed August 11, 2026 · model on record in the stance chip above.
Discussion (0). Continue with ORCID to comment.