REVIEW 3 major objections 4 minor 2 cited by
The Atacama Cosmology Telescope: Semi-Analytic Covariance Matrices for the DR6 CMB Power Spectra
T0 review · 3 major / 4 minor · reviewed 2026-08-11 · deepseek-v4-flash
Pith's one-line read This paper claims that a semi-analytic covariance matrix, upgraded to include inhomogeneous survey depth and Fourier-filter transfer functions, matches 1,600 Monte Carlo simulations to better than 3% for ACT DR6 power spectra, and that a…
desk verdict Solid, careful covariance pipeline for ACT DR6; the sub-percent validation is real but conditional on the simulation model, and the paper is honest about that. read the letter →
The pith
A machine-rendered reading of the paper's core claim, the machinery that carries it, and where it could break.
The reading
What carries the argument
The load-bearing object is the rotated Monte Carlo covariance matrix Σ_R = $Σ_A^{{-1/2}}$ Σ_M $Σ_A^{{-T/2}}$; if the analytic and Monte Carlo eigenbases nearly coincide, its diagonal gives the smooth ratio of the two eigenspectra, which is fit block-by-block with Gaussian processes and rotated back to produce the corrected matrix. The analytic part rests on the MASTER pseudospectrum covariance using the improved narrow-kernel approximation (INKA), which replaces each steep spectrum by a normalized pseudospectrum, together with separate effective masks for signal and noise and simulated transfer functions for the Fourier filter.
What would settle it
Build a covariance from simulations whose large-scale polarized noise is forced to match the data at ℓ below about 500 and rerun the chi-squared test; if the corrected matrix no longer lands within about 0.3% of expectation, the claimed accuracy was absorbing a simulation artifact rather than modeling the data.
Extended reading notes
Core claim
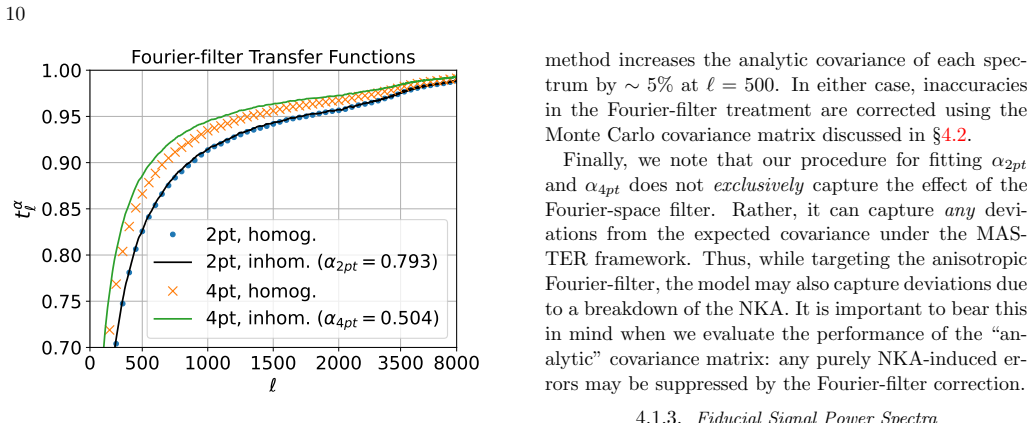
The paper's central claim is that the covariance bias introduced by the MASTER approximations can be reduced to the percent level for ACT DR6 by three moves: using different effective masks for signal and noise to encode survey depth, modeling the Fourier-space filter with two-point and four-point isotropic transfer functions whose exponents are fit from dedicated simulations, and correcting the remaining bias with a shrinkage step that assumes the analytic and Monte Carlo covariances share an eigenbasis and that their eigenspectrum ratio is smooth. The validation is a chi-squared test on simulated data vectors: the simulation mean chi-squared improves from 1812.8 for the uncorrected inhomogeneous prescription and 2039.0 for the homogeneous prescription toward the expected 1763, and after correction becomes 1764.7 and 1767.3, within about 0.3% of nominal. The paper concludes that the corrected semi-analytic matrix, built from either prescription, is well-suited for use in the ACT DR6 likelihood.
Load-bearing premise
The Monte Carlo covariance built from the simulated noise models is an unbiased stand-in for the true ACT DR6 covariance, so any bias in the simulations is inherited by the corrected matrix.
Editorial extensions
If this is right
- The corrected inhomogeneous matrix can replace the homogeneous default in the ACT DR6 likelihood with sub-percent agreement to simulations.
- Because the homogeneous matrix also reaches sub-percent after correction, the new shrinkage method can rescue even roughly 16%-biased analytic inputs.
- The eigenbasis/smooth-ratio shrinkage outperforms the common correlation-preserving reweighting, which leaves 1.7% to 4.9% biases in the chi-squared test.
- Future CMB experiments with atmospheric noise can use the same pipeline, and the inhomogeneous prescription may need a smaller simulation ensemble than the homogeneous one.
- The Fourier-filter transfer-function treatment raises analytic covariances by about 5% at ℓ = 500 relative to the DR4 fixed-exponent relation, changing error bars on that scale.
Reading between the lines
- If the eigenbasis assumption degrades for surveys with sharper mask holes or stronger striping, the shrinkage could require more than one Gaussian-process length scale; a natural test is to inspect the off-diagonal structure of Σ_R for such a survey.
- The admitted excess large-scale polarized noise in the simulations means the current validation is probably pessimistic for large-scale EE bins, so forcing simulated noise to match the data at ℓ below about 500 could shift those error bars down by 1 to 2 percent.
- The same effective-mask technology that separates signal and noise depth could improve analytic covariances for galaxy clustering surveys with strong depth gradients, not just CMB temperature and polarization.
- Because the correction discards bin-wise off-diagonal elements beyond the within-block diagonals, the final covariance implicitly assumes the true cross-bin correlation structure is analytic; this could be tested with a simulation ensemble large enough to resolve |b − b′| ≥ 2 correlations directly.
Signed reviews
Editorial analysis
A structured set of objections, weighed in public.
Referee Report
Summary. This paper presents a semi-analytic pipeline for the ACT DR6 power-spectrum covariance matrix. The authors generalize the MASTER pseudo-C_ell covariance to include inhomogeneous survey depth through separate effective signal and noise masks (Eq. 13, Appendix B.1), use the improved narrow-kernel approximation, and model the Fourier-space filter with isotropic transfer functions t^alpha with exponents alpha_2pt and alpha_4pt fitted to dedicated simulations (Section 4.1.2, Appendix B.2). The analytic matrix is then corrected with a new shrinkage procedure: the Monte Carlo covariance is rotated into the analytic eigenbasis, its block-diagonal elements are smoothed with a Gaussian process, and the result is rotated back (Eqs. 17-19). Validation uses 1,600 tiled-model simulations: the uncorrected inhomogeneous matrix gives a simulation chi-squared mean of 1812.8 +/- 1.5 against an expected 1763 (about 2.8% high, corresponding to roughly 1.4% error-bar underestimation), while the homogeneous prescription is about 15.7% discrepant; after correction based on 1,000 simulations and evaluation on the independent 600, both corrected matrices have chi-squared means of 1764.7 and 1767.3, respectively, consistent with 1763. The paper also compares against a directional-wavelet noise model, tests the effect of point-source holes, and shows that their correction outperforms a correlation-matrix-preserving alternative.
Significance. If the claimed accuracy holds, this is a timely and useful methodological contribution. The explicit derivation of the polarized pseudo-spectrum covariance in Appendix B.1, the use of an independent 600-simulation evaluation set, and the systematic comparison of two correction schemes are all strengths. The paper also gives a practical framework that should transfer to Simons Observatory and other high-resolution CMB experiments. However, the validation is carried out almost entirely against the authors' own tiled Monte Carlo model, and the manuscript itself documents large-scale polarized-noise deficiencies in that model. The significance of the paper therefore depends on how much weight one places on the Monte-Carlo-as-truth assumption, and the suitability claim for the ACT DR6 likelihood is currently stronger than the evidence provided.
major comments (3)
- [Sections 5.1-5.2 and 4.3, Figure 12] The correction and the headline validation share the same tiled Monte Carlo model as reference. Section 5.1 correctly uses independent simulation draws for the d^2 test, but that test cannot detect any bias that is common to the model and the corrected matrix. Section 5.2 and Figure 12 show that the tiled simulations have excess large-scale polarized noise after the Fourier filter, inflating some low-ell EE error bars by 1-2%, and Section 4.3 constructs the corrected matrix from exactly this Monte Carlo covariance. Because the paper claims the matrix is well-suited for the DR6 likelihood, it should either propagate the known simulation bias through the full covariance, including off-diagonal blocks rather than only the quoted three bins, or explicitly restrict the suitability claim to scales and spectra for which the simulation model is validated against the data.
- [Appendix E, Figures 14-15] The unfiltered, no-holes control test reports roughly 30% Monte Carlo versus analytic discrepancies for large-scale polarization and attributes them to a breakdown of the approximate noise model of Equation 10 as well as to the NKA. This is a load-bearing limitation because the baseline comparison in Figure 8 cannot distinguish a failure of the analytic ansatz from the known simulation noise excess; both are partly absorbed by the Fourier-filter transfer-function fit described in Appendix B.2. The paper should provide a quantitative demonstration that the Fourier filter and the DR6 scale cuts suppress this polarization discrepancy in the baseline configuration, or it should soften the conclusion that the semi-analytic matrix is well-suited for the DR6 likelihood.
- [Section 4.1.2, Appendix B.2] The 'uncorrected analytic' covariance is not fully analytic: the exponents alpha_2pt and alpha_4pt are fitted to 500 mock simulations, and the text itself notes that the fit can absorb NKA-induced errors. The reported better-than-3% agreement therefore conflates the analytic ansatz with the fitted transfer-function model. Please report the statistical uncertainty on the fitted exponents and the sensitivity of the quoted 3% and 1.4% figures to those values, so that the genuinely analytic part of the prescription can be separately assessed.
minor comments (4)
- [Figure 4 versus Figure 11] The polarization four-point exponent is quoted as alpha_4pt = 0.504 in the Figure 4 caption but as 0.469 in the Appendix B.2 fit shown in Figure 11; please clarify whether these are different polarization cases or different fit setups, and specify which value enters the baseline covariance.
- [Footnote 1] The footnote states that minor revisions were made to the dr6.02 maps, masks, scale cuts, fiducial signal spectra, and simulations after the paper was completed, but that these should not affect the conclusions; please provide a versioned record of the exact inputs used for the reported numbers, since the unverifiable nature of this statement makes the numerical results difficult to reproduce.
- [Section 4.3, text after Eq. (19)] The statement 'This procedure has no free parameters' is confusing immediately after two Gaussian-process hyperparameters are optimized; consider rephrasing to 'no hand-tuned parameters' or explicitly stating which quantities are held fixed.
- [Section 5.2] In the second robustness test, the phrases 'TT, TE, and EE spectra' and 'TB, EB, and BB spectra' should be clarified as power-spectrum data vectors or covariance blocks rather than individual spectra, since each of these labels denotes multiple array pairs.
Circularity Check
No significant circularity: the covariance pipeline is validated out-of-sample (1,000/600 split), and the fitted transfer-function parameters are calibrated on separate mock simulations; residual concerns about the Monte-Carlo-as-truth premise are validation risks, not circular steps.
full rationale
The paper's derivation chain is not circular in the target-result sense. The analytic covariance (Eq. 13 and 16) is built from MASTER/INKA ingredients: couplings, effective signal and noise masks, and fiducial signal and noise spectra. The Fourier-filter transfer-function parameters (t_ell, alpha_2pt, alpha_4pt) are fitted in Section 4.1.2 and Appendix B.2 using 50+500 dedicated mock simulations with a representative mask and noise-like spectra, not against the 1,600-realization full Monte Carlo covariance that is used for the claimed 3% agreement. The full Monte Carlo includes tiled anisotropic noise, all array/split/polarization blocks, and the real analysis masks, so the 3% comparison is an out-of-sample test of the approximate model. The Section 4.3 simulation-based correction is applied using 1,000 simulations and evaluated with the holdout 600 (footnote 17), and the Gaussian-process smoothing prevents overfitting the Monte Carlo noise; this is a legitimate train/test split rather than a fitted parameter renamed as a prediction. The sub-percent post-correction agreement therefore measures the shrinkage estimator's accuracy against the same simulation model, not the model's fidelity to ACT DR6 data. The paper explicitly flags the latter limitation: Section 5.2 reports an excess large-scale polarized noise power in the tiled simulations (Figure 12) that inflates a few low-ell EE error bars by 1-2%, and Appendix E reports roughly 30% Monte Carlo versus analytic discrepancies for large-scale polarization in the unfiltered no-holes test, attributed to a breakdown of the approximate noise model (Eq. 10) and the narrow-kernel approximation. These are external-validity caveats about using the simulation ensemble as ground truth, not structural circularity. The self-citations (Atkins et al. 2023 for the noise models, Choi et al. 2020 for the fiducial signal model) supply inputs to the reference simulations, but the paper cross-checks robustness with the directional-wavelet model and separately quantifies simulation-data mismatches, so the central covariance claim does not reduce to an unverified self-citation. Overall, no equation or fitted parameter is equivalent to the claimed prediction by construction.
Assumptions & free parameters
free parameters (3)
- Two-point Fourier-filter transfer exponent alpha2pt =
0.793 (temperature), 0.792 (polarization)
- Four-point Fourier-filter transfer exponent alpha4pt =
0.504 in baseline pipeline (0.469 in Appendix B.2 fit variant)
- Gaussian process RBF hyperparameters (amplitude and length scale) =
not reported
assumptions (6)
- domain assumption Narrow Kernel Approximation: the power spectrum of the mask is sufficiently compact relative to the field that C_ell can be moved out of mode-coupling sums.
- ad hoc to paper Approximate noise model of Equation 10: anisotropic stripy noise is replaced by isotropic Gaussian noise weighted by per-pixel standard deviation and pixel area.
- ad hoc to paper The Fourier-space filter can be represented as an isotropic transfer function t^alpha with separately fitted two-point and four-point exponents.
- domain assumption Signal and noise are zero-mean Gaussian and mutually uncorrelated; only the disconnected Gaussian covariance is modeled.
- domain assumption The eigenbases of the analytic and Monte Carlo covariance matrices are close, and the ratio of their eigenspectra is smooth.
- domain assumption The Monte Carlo covariance is an unbiased estimate of the true ACT DR6 covariance.
Cite this review
Pith. "Pith review of The Atacama Cosmology Telescope: Semi-Analytic Covariance Matrices for the DR6 CMB Power Spectra." pith.science (2026). https://pith.science/paper/X2J5GOQO
@misc{pith2026241207068,
  author       = {Pith},
  title        = {Pith review of: The Atacama Cosmology Telescope: Semi-Analytic Covariance Matrices for the DR6 CMB Power Spectra},
  year         = {2026},
  howpublished = {\url{https://pith.science/paper/X2J5GOQO}},
  note         = {Machine review of arXiv:2412.07068}
}
abstract
The Atacama Cosmology Telescope Data Release 6 (ACT DR6) power spectrum is expected to provide state-of-the-art cosmological constraints, with an associated need for precise error modeling. In this paper we design, and evaluate the performance of, an analytic covariance matrix prescription for the DR6 power spectrum that sufficiently accounts for the complicated ACT map properties. We use recent advances in the literature to handle sharp features in the signal and noise power spectra, and account for the effect of map-level anisotropies on the covariance matrix. In including inhomogeneous survey depth information, the resulting covariance matrix prescription is structurally similar to that used in the $\textit{Planck}$ Cosmic Microwave Background (CMB) analysis. We quantify the performance of our prescription using comparisons to Monte Carlo simulations, finding better than $3\%$ agreement. This represents an improvement from a simpler, pre-existing prescription, which differs from simulations by $\sim16\%$. We develop a new method to correct the analytic covariance matrix using simulations, after which both prescriptions achieve better than $1\%$ agreement. This correction method outperforms a commonly used alternative, where the analytic correlation matrix is assumed to be accurate when correcting the covariance. Beyond its use for ACT, this framework should be applicable for future high resolution CMB experiments including the Simons Observatory (SO).
Figures


Figures from the paper (12 more)


Forward citations
Cited by 2 Pith papers
-
Analytical covariances for catalogue-based pseudo-$C_\ell$s
A new analytic method computes disconnected covariance matrices for catalogue-based pseudo-Cℓ power spectra by smoothing source positions and treating self-pair shot noise exactly.
-
Cosmic birefringence from a joint analysis of ACT and Planck
A joint analysis of Planck and ACT CMB polarization finds a nonzero cosmic birefringence angle of 0.277° ± 0.057°, at 4.8σ, with systematics still to be understood.
Reference graph
Works this paper leans on
-
[1]
Aiola, S., Calabrese, E., Maurin, L., et al. 2020, JCAP, 2020, 47, doi: 10.1088/1475-7516/2020/12/047 Alonso, D., Fabbian, G., Storey-Fisher, K., et al. 2023, JCAP, 2023, 043, doi: 10.1088/1475-7516/2023/11/043 Alonso, D., Sanchez, J., Slosar, A., & LSST Dark Energy Science Collaboration. 2019, MNRAS, 484, 4127, doi: 10.1093/mnras/stz093 21 Astropy Collab...
arXiv 2020
-
[2]
−−” couplings are small compared to “++
This follows from the INKA, as well as the assumption that mask gradients can be neglected (Couchot et al. 2017), such that “ −−” couplings are small compared to “++” couplings. B.2. More Details on Fourier Filter In this section, we first examine the effect of a Fourier-space filter analytically by considering it in harmonic space, and then discuss how w...
work page 2017
-
[3]
Unlike Choi et al. (2020), we convert the frequency-dependent model components into power spectra for each frequency band in DR6 by integrating over the full array passband rather than using effective frequencies. C. UPDATES FOR MNMS NOISE SIMULATIONS In this section, we state changes to the noise model implementations of Atkins et al. (2023) that were ne...
work page 2020
-
[5]
Therefore, fields following Equations 9 and 10 are nearly identically distributed. B. ANALYTICAL PSEUDOSPECTRUM COV ARIANCE MATRICES In this section, we derive Equation 13 and give our expressions for the coupling “spin,” β. We also motivate our use of an isotropic transfer function to approximately model the Fourier-space filter, as described in §4.1.2, ...
work page 2016
-
[6]
(B10) Because ˜a is Gaussian, we expand the product of four fields using Wick’s theorem
is ˆ˜C yz ℓ , and the covariance of i, j, p, and q is: ˜Σi,j,p,q ℓℓ′ ≡ ⟨ˆ˜C ij ℓ ˆ˜C pq ℓ′ ⟩ − ⟨ˆ˜C ij ℓ ⟩⟨ ˆ˜C pq ℓ ⟩ = 1 2ℓ + 1 1 2ℓ′ + 1 X m,m′ ⟨˜ai ℓm˜aj∗ ℓm˜ap ℓ′m′ ˜aq∗ ℓ′m′⟩ − ⟨˜ai ℓm˜aj∗ ℓm⟩⟨˜ap ℓ′m′ ˜aq∗ ℓ′m′⟩. (B10) Because ˜a is Gaussian, we expand the product of four fields using Wick’s theorem. Also using the reality of the fields, Equation B...
work page 2004
-
[8]
Coupling spins as a function of input field polarizations. P refers to either E or B. Note, there are 16 possible polarization permutations, and in no case do we use the −− coupling. the leading-order power spectrum covariance matrix (Knox 1995). To derive a similar effect for a filter, first consider a filter applied to fields in harmonic space in the ab...
work page 1995
-
[9]
27 When there is a mask in addition to a harmonic-space filter, these expressions become inexact
In this case, we see an analogy to a mask: the covariance matrix increases as 1/tℓ. 27 When there is a mask in addition to a harmonic-space filter, these expressions become inexact. The pseudospectrum is then related to the power spectrum as: ⟨ ˆ˜Cℓ⟩ = 1 2ℓ + 1 X ℓ′ Cℓ′ X mm′ Kℓm,ℓ′m′(w)K ∗ ℓm,ℓ′m′(w)f 2 ℓ′m′. (B22) Ordinarily, at this point, the MASTER f...
work page 2000
-
[10]
The factor appears in the literature as early as Efstathiou (2004), and recurs throughout the Planck covariance matrices, but its whereabouts have not been explicitly discussed. A field that follows the model of Equation 9 has zero mean and is Gaussian, so its statistics are fully specified by its covariance. This is given by: ⟨nin† i ⟩ = σiYN 1 2 i Y†Ω⟨η...
work page 2004
Show all 16 references
-
[11]
representative
The fit for the pseudospectra ( α2pt = 0.792) is excellent, with errors at at the sub-percent level. The fit for the binned power spectrum covariance ( α4pt = 0.469) appears consistent given the noisier Monte Carlo estimates. When the final filter transfer functions — tα2pt ℓ ...
2020
-
[13]
Left: In the case that the simulation-based correction only smooths the main diagonal of ΣR
Ratios between the bin-wise diagonal of the Monte Carlo covariance matrix and the inhomogeneous and homogeneous semi-analytic covariances matrices, for the PA6 f150 x PA6 f150 T Eblock-diagonal. Left: In the case that the simulation-based correction only smooths the main diago...
2004
-
[14]
For each polarization combination, the power spectrum variance increases when point-source holes are added to the mask, as expected
Ratios between analytic noise covariance matrix diagonals for an analysis mask including point-source holes to an analysis mask without point-source holes. For each polarization combination, the power spectrum variance increases when point-source holes are added to the mask, a...
2000
-
[15]
Thus, as is evident in Figure 15, both cases share the same statistical fluctuations, further facilitating a direct comparison
In each case — with and without point-source holes — we construct a Monte Carlo covariance from the same 600 tile-based simulations. Thus, as is evident in Figure 15, both cases share the same statistical fluctuations, further facilitating a direct comparison. For the signal p...
2016
-
[193]
http://www.jstor.org/stable/2983768 Hunter, J. D. 2007, Computing in Science & Engineering, 9, 90, doi: 10.1109/MCSE.2007.55 Knox, L. 1995, PhRvD, 52, 4307, doi: 10.1103/PhysRevD.52.4307 Kogut, A., Spergel, D. N., Barnes, C., et al. 2003, ApJS, 148, 161, doi: 10.1086/377219 22...
2007
-
[500]
(2023) for this model
in Equation 3, the directional wavelet noise model includes the per-pixel noise standard deviations σi, whereas these were excluded in Atkins et al. (2023) for this model. Lastly, we found the PA6 inverse-variance maps to contain more arcminute-scale structure compared to PA4 ...
2023
-
[1763]
Nevertheless, large biases in the covariance matrix elements themselves can be problematic for subsequent analyses that manipulate the data vector and covariance, for example, by coadding them. Fortunately, Figure 13 demonstrates that accounting for these small off-diagonals i...
2000
-
[2016]
M., Hivon, E., Banday, A
http://dx.doi.org/10.5281/zenodo.59508 G´ orski, K. M., Hivon, E., Banday, A. J., et al. 2005, ApJ, 622, 759, doi: 10.1086/427976 Hadzhiyska, B., Garc ´ ıa-Garc ´ ıa, C., Alonso, D., Nicola, A., & Slosar, A. 2021, JCAP, 2021, 020, doi: 10.1088/1475-7516/2021/09/020 Hamimeche, ...
2005 doi
Reviewed August 11, 2026 · model on record in the stance chip above.
Discussion (0). Continue with ORCID to comment.