REVIEW 4 major objections 4 minor 5 references
Towards Quantitative Interpretation of 3D Atomic Force Microscopy at Solid-Liquid Interfaces
T0 review · 4 major / 4 minor · reviewed 2026-08-10 · deepseek-v4-flash
Pith's one-line read This paper concludes that the oscillatory force measured by 3D atomic force microscopy at solid–liquid interfaces directly encodes the intrinsic, unperturbed liquid density profile, so force maps can be inverted into quantitative…
desk verdict A candid, readable perspective on 3D-AFM density extraction; the abstract oversells 'quantitative' but the body is honest about the factor 2–3 limits of the solvent-tip approximation. read the letter →
The pith
A machine-rendered reading of the paper's core claim, the machinery that carries it, and where it could break.
The reading
What carries the argument
The central object is the solvent tip approximation (STA), the idea that the sensing end of an AFM probe in liquid can be treated as a single solvent molecule. Its load-bearing identity is Eq. (3), $\rho(\boldsymbol{r})/\rho_0 = Z(\boldsymbol{r})/Z_N$, which equates the local density ratio to the ratio of perturbed to unperturbed configurational partition functions; combining this with the free-energy gradient produces Eq. (4), $\Delta f(z) = k_B T/\rho(z)\,d\rho/dz$. The additional mechanism is the minitip effect, in which a local protrusion at the probe apex is claimed to dominate the interaction and make the one-molecule reduction valid. These identities carry the entire argument: they are what allow a measured force to be read as a density derivative without modeling the full probe.
What would settle it
Take a measured 3D-AFM force map at a well-characterized interface such as mica in water, invert it with Eq. (4), and compare the resulting density profile to an independent X-ray reflectivity or explicit-tip MD density profile; a systematic discrepancy in the position or height of the first density peak beyond the reported factor-of-2–3 scatter would refute the central claim.
Extended reading notes
Core claim
The paper's central claim is that the perturbation-induced AFM force paradoxically represents the intrinsic, unperturbed liquid density profile. The oscillatory force arises from the probe modulating the configurational entropy of the interfacial liquid; taking the gradient of the resulting free-energy change gives $\Delta f(z)=k_B T/\rho(z)\,d\rho/dz$, where $\rho(z)$ is the density profile in the absence of the probe. The paper further claims that the entire probe can be represented by one terminating solvent molecule, justified by the minitip effect, and that this simple model already gives density–force conversion accurate to within a factor of 2–3, comparable to much costlier all-atom simulations. Consequently, the quantitative atomic-scale liquid density distribution can be derived from force maps for one-component solvents and dilute electrolytes, with first-layer and concentrated-electrolyte cases explicitly acknowledged as less reliable.
Load-bearing premise
The load-bearing premise is that the tip's only significant effect on the liquid is to displace molecules, so the density measured through the force is proportional to the density that would exist without the tip; if direct chemical forces between the tip and the first solvation layer add a significant enthalpy term, the simple density-inversion formula stops being reliable.
Editorial extensions
If this is right
- For one-component solvents and dilute aqueous electrolytes, force maps can be converted to liquid density profiles at sub-angstrom lateral and vertical resolution, including near defects and steps that scattering cannot resolve.
- The interlayer spacing and decay of force oscillations reflect the bulk liquid's pair-correlation structure, so 3D-AFM can serve as a local probe of liquid structure rather than only of the solid surface.
- STA-derived density carries an absolute calibration uncertainty within a factor of 2–3, so quantitative comparison across experiments should be done with that tolerance until better tip characterization exists.
- The first solvation peak is the least trustworthy feature because hard-sphere and entropy-only models miss specific substrate–molecule interactions; interpreting first-layer adsorption from force maps requires additional information.
- For concentrated electrolytes and ionic liquids, the single-component STA is not expected to hold, and density–force conversion needs multi-component models.
Reading between the lines
- Editorial extension: Eq. (4) is invertible without modeling the probe tip, so integrated force maps could be compared directly with X-ray reflectivity or MD density profiles at the same interface as a quantitative test of the whole argument.
- Editorial extension: The entropy-modulation logic, if correct, should apply to lateral force components as well; the same constant would turn a 2D force slice into a full 3D density map, a step the paper does not explicitly take.
- Editorial extension: For concentrated electrolytes and ionic liquids, the paper concedes the single-component model breaks down; a component-resolved version treating cation, anion, and solvent as separate terminating species is a natural next step, but is not developed here.
- Editorial extension: The claim that the perturbed system reports the unperturbed density has the flavor of a linear-response relation; a formal derivation from a free-energy functional would strengthen the foundation, whereas the paper argues from evidence and comparison rather than proof.
Editorial analysis
A structured set of objections, weighed in public.
Referee Report
Summary. This perspective paper argues that 3D-AFM force maps at solid–liquid interfaces can be quantitatively interpreted as the intrinsic, unperturbed liquid density profile. The authors review DC and AC 3D-AFM imaging modes, survey computational and scattering evidence for oscillatory interfacial density, and present the solvent-tip approximation (STA) as the key analytical link. The central formula is Eq. (4), Δf(z) = (kT/ρ) dρ/dz, derived from the assumption in Eq. (3) that the local density ratio equals the configurational partition function ratio. The paper supports this with comparisons to MD, classical DFT, and experimental force curves, reporting factor-of-2–3 agreement, and discusses limitations including first-peak deviations and concentrated electrolytes.
Significance. If the STA inversion is valid, Eq. (4) would enable extraction of interfacial liquid density from 3D-AFM force maps at sub-angstrom lateral resolution, a capability of substantial value for electrochemistry, catalysis, and nanofluidics. The paper performs a useful service by consolidating the scattered literature on 3D-AFM quantification and by honestly reporting the current accuracy floor of order 2–3. It also correctly identifies the empirical 'minitip' effect as an important justification for local-probe models. However, the central theoretical step is an assumption rather than a derivation, and the empirical evidence presented has an accuracy too low to support the abstract's unqualified claim of 'quantitative, atomic-scale liquid density distribution.'
major comments (4)
- [Section 4.1, Eqs. (3) and (4)] The proportionality ρ(r)/ρ0 = Z(r)/Z_N in Eq. (3) is the load-bearing assumption of the derivation of Eq. (4). The paper presents it as a hypothesis of Watkins and Reischl, but the abstract and conclusion treat it as established. For a finite-size probe, the exact force is F_z = −∫ ρ(r;z) ∂U_tip(r;z)/∂z d³r, which depends on the perturbed density and tip–solvent potential, not the unperturbed singlet density alone. The authors should derive Eq. (3) from controlled approximations (e.g., hard-sphere limit, point-like tip) or explicitly frame it as an ansatz with a specified domain of validity; otherwise the central claim that force maps directly yield the unperturbed density is not established.
- [Section 5.2 and Section 6] The paper acknowledges that the first force/density peak deviates from the analytical forms due to enthalpy or direct interactions (Section 5.2) and that the STA is limited to dilute solutions with factor-of-2–3 accuracy (Section 6). These caveats are in tension with the abstract's claim of 'quantitative, atomic-scale liquid density distribution.' Since the first solvation peak often carries the chemically relevant information (e.g., specific adsorption), the claim as stated is overstated. The manuscript should either restrict the quantitative claim to the asymptotic (beyond-first-peak) region or provide a quantitative error bound for the inversion.
- [Section 6, minitip argument] The minitip argument is empirical and does not establish the single-molecule representation. The observed independence of force curves on tip radius over 10–250 nm is consistent with a small active region, but it does not rule out a cluster of a few molecules or direct tip–molecule interactions. The paper should cite direct tests of the STA's microscopic premise (e.g., force curves with chemically modified tips, or temperature dependence of the oscillatory force) or explicitly acknowledge that the single-molecule representation is a fitting assumption rather than a demonstrated physical picture.
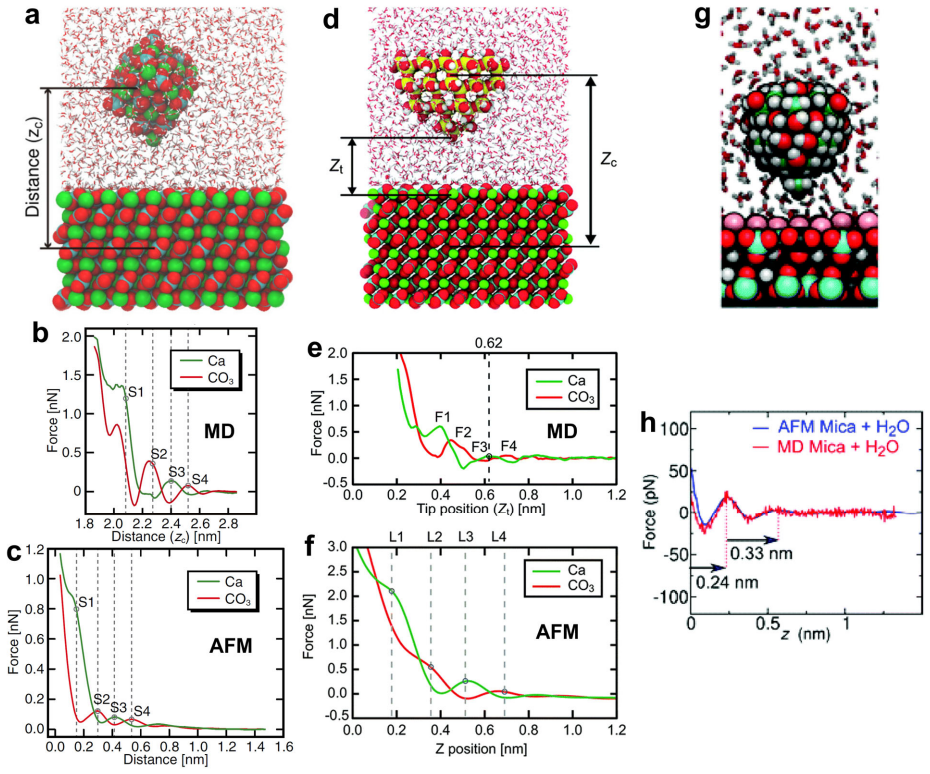
- [Section 4.2, Figure 6] The factor-of-two agreement between STA and experiment is based on two selected published comparisons. No systematic meta-analysis of all published STA comparisons is provided, and the tip-to-tip variability mentioned in Section 5.1 is not quantified. A table of quantitative comparisons with associated uncertainties would substantiate the claim that the STA is a quantitative inversion tool rather than a qualitative descriptor.
minor comments (4)
- [Section 4.1, Eq. (1)] The constant in Eq. (1) is not simply additive because the full partition function Q includes momentum and internal degrees of freedom; the authors should clarify that only z-dependent terms matter for the force gradient.
- [Section 5.2, Eqs. (5) and (6)] The amplitude and phase parameters Δ_ρ, Δ_f, φ_ρ, and φ_z in Eqs. (5) and (6) are introduced without explicit definitions; please define them and state whether they are fitted to data or derived from the DFT framework.
- [Section 2.2 and Eq. (4)] The symbol Δf is used both for the oscillatory part of the force in Section 2.2 and for the total conservative force in Eq. (4); the notation should be disambiguated.
- [General] The manuscript text contains numerous spacing/OCR-like typographical errors (e.g., 'hypothesi s', 'Engin eering', '3D scanni ng'); the final version should be carefully proofread.
Circularity Check
No significant circularity: the central STA formula is an explicitly attributed prior hypothesis, and the paper's support comes from independent simulations, scattering data, and other labs' experiments.
full rationale
The derivation in Section 4.1 does not present Eq. 3 as a theorem proved in this paper; it explicitly states that 'Watkins and Reischl hypothesized' the proportionality ρ(r)/ρ0 = Z(r)/Z_N and then differentiates it to obtain Eq. 4. This is a transparent modeling premise, not a concealed circular step. The paper's conclusion that the force profile reflects the unperturbed density is indeed the content of that hypothesis, but the paper tests the hypothesis against external evidence: MD and all-atom tip simulations (Sections 4.2 and 5.1), classical DFT (Section 5.2), X-ray/neutron scattering (Section 3), and experiments by independent groups. The acknowledged factor-of-2-3 agreement and first-peak deviations in Section 5.2, as well as the stated limitations for concentrated electrolytes in Section 6, weaken the strength of the quantitative claim but do not make the argument circular. The authors' own prior measurements (refs 49-52) are used as examples of DC-mode 3D-AFM, not as the load-bearing justification for Eq. 4, and no fitted parameter is relabeled as a prediction. The minitip argument is supported by independent tip-radius studies by Onishi and Fukuma. Overall, the derivation chain is an explicit conditional derivation from a cited approximation, with external benchmarks, so no circularity is present.
Assumptions & free parameters
free parameters (2)
- Damped-oscillation amplitude and phase factors (Delta_rho, Delta_f, phi_rho, phi_z) in Eqs. 5-6 =
Not specified (fitted in ref 38)
- Common decay length 1/alpha and oscillation period 2*pi/q in Eqs. 5-6 =
Not specified
assumptions (5)
- standard math Helmholtz free energy is F = -kT ln Z with configurational partition function Z; perturbed free energy difference Delta F = -kT ln(Z(r)/ZN) (Eqs. 1-2).
- domain assumption Density ratio equals configurational partition function ratio, rho(r)/rho0 = Z(r)/ZN (Eq. 3).
- domain assumption The AFM probe can be represented as a single terminating solvent molecule at the tip end (STA/minitip).
- domain assumption The oscillatory part of the measured force comes mainly from configurational entropy modulation, with negligible direct enthalpy contributions.
- domain assumption AC-mode cantilever oscillation can be treated as quasi-equilibrium, with the conservative force independent of z-rate.
Cite this review
Pith. "Pith review of Towards Quantitative Interpretation of 3D Atomic Force Microscopy at Solid-Liquid Interfaces." pith.science (2026). https://pith.science/paper/WVTGXCB7
@misc{pith2026250102939,
  author       = {Pith},
  title        = {Pith review of: Towards Quantitative Interpretation of 3D Atomic Force Microscopy at Solid-Liquid Interfaces},
  year         = {2026},
  howpublished = {\url{https://pith.science/paper/WVTGXCB7}},
  note         = {Machine review of arXiv:2501.02939}
}
read the original abstract
Three-dimensional atomic force microscopy (3D-AFM) has been a powerful tool to probe the atomic-scale structure of solid-liquid interfaces. As a nanoprobe moves along the 3D volume of interfacial liquid, the probe-sample interaction force is sensed and mapped, providing information on not only the solid morphology, but also the liquid density distribution. To date 3D-AFM force maps of a diverse set of solid-liquid interfaces have been recorded, revealing remarkable force oscillations that are typically attributed to solvation layers or electrical double layers. However, despite the high resolution down to sub-angstrom level, quantitative interpretation of the 3D force maps has been an outstanding challenge. Here we will review the technical details of 3D-AFM and the existing approaches for quantitative data interpretation. Based on evidences in recent literature, we conclude that the perturbation-induced AFM force paradoxically represents the intrinsic, unperturbed liquid density profile. We will further discuss how the oscillatory force profiles can be attributed to the probe-modulation of the liquid configurational entropy, and how the quantitative, atomic-scale liquid density distribution can be derived from the force maps.
Figures


Figures from the paper (6 more)




Reference graph
Works this paper leans on
-
[161]
(14) Sivula, K.; van de Krol, R
https://doi.org/10.1016/j.ensm.2015.07.001. (14) Sivula, K.; van de Krol, R. Semiconducti ng Materials for Photoelectrochemical Energy Conversion. Nat. Rev. Mater. 2016, 1, 15010. (15) Zhang, J.; Xia, Z.; Dai, L. Carbon-Based Electrocatalysts for Advanced Energy Conversion and Storage. Sci. Adv. 2015, 1 (7), e1500564. https://doi.org/10.1126/sciadv.150056...
-
[786]
https://doi.org/10.1038/s41929-020-00512-x. (33) Toney, M. F.; Howard, J. N.; Richer, J.; Borges, G. L.; Gordon, J. G.; Melroy, O. R.; Wiesler, D. G.; Yee, D.; Sorensen, L. B. Voltage-Dependent Ordering of Water Molecules at an Electrode– Electrolyte Interface. Nature 1994, 368 (6470), 444–446. https://doi.org/10.1038/368444a0. (34) Steinrück, H.-G.; Cao,...
-
[6758]
(77) Gäding, J.; Della Balda, V.; Lan, J.; Konrad, J.; Iannuzzi, M.; Meißner, R
https://doi.org/10.1063/1.463652. (77) Gäding, J.; Della Balda, V.; Lan, J.; Konrad, J.; Iannuzzi, M.; Meißner, R. H.; Tocci, G. The Role of the Water Contact Layer on Hydration and Transport at Solid/Liquid Interfaces. Proc. Natl. Acad. Sci. 2024, 121 (38), e2407877121. https://doi.org/10.1073/pnas.2407877121. (78) Venturi, G.; Formisano, F.; Cuello, G. ...
-
[9349]
https://doi.org/10.1021/acs.jpcc.6b02549. (59) Jurado, L. A.; Espinosa-Marzal, R. M. Insight into the Electrical Double Layer of an Ionic Liquid on Graphene. Sci. Rep. 2017, 7 (1), 4225. https://doi.org/10.1038/s41598-017-04576-x. (60) Carrasco, C.; Ares, P.; de Pablo, P. J.; Gó mez-Herrero, J. Cutting down the Forest of Peaks in Acoustic Dynamic Atomic F...
arXiv 2017
-
[9462]
https://doi.org/10.1073/pnas.0504034102. (37) Uhlig, M. R.; Martin-Jimenez, D.; Garcia, R. Atomic-Scale Mapping of Hydrophobic Layers on Graphene and Few-Layer MoS2 and WSe2 in Water. Nat. Commun. 2019, 10 (1), 2606. https://doi.org/10.1038/s41467-019-10740-w. (38) Hernández-Muñoz, J.; Uhlig, M. R.; Benag lia, S.; Chacón, E.; Tarazona, P.; Garcia, R. Subn...
Reviewed August 10, 2026 · model on record in the stance chip above.
Discussion (0). Continue with ORCID to comment.