REVIEW 4 major objections 6 minor 35 references
Order-by-order uncertainties of nucleon-nucleon Wolfenstein amplitudes in chiral effective field theory
T0 review · 4 major / 6 minor · reviewed 2026-08-10 · deepseek-v4-flash
Pith's one-line read This paper claims that, with a momentum-transfer-dependent expansion parameter and a single reference amplitude, the five nucleon-nucleon Wolfenstein amplitudes from a semi-local chiral potential converge regularly at NLO and beyond…
desk verdict A careful BUQEYE application to Wolfenstein amplitudes with useful per-amplitude breakdown scales, but the abstract's coverage claim outruns the body's results. read the letter →
The pith
A machine-rendered reading of the paper's core claim, the machinery that carries it, and where it could break.
The reading
What carries the argument
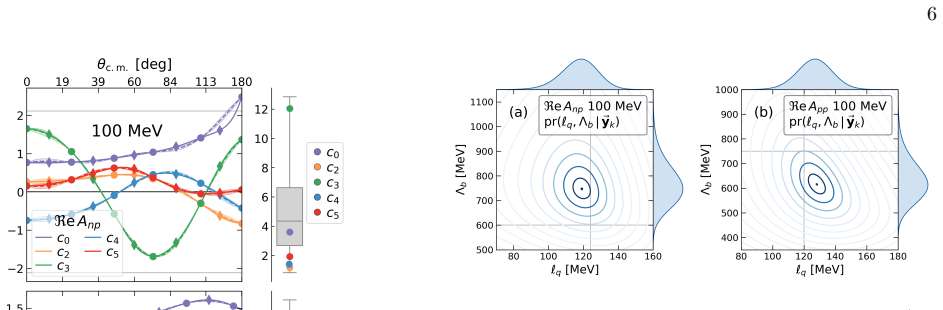
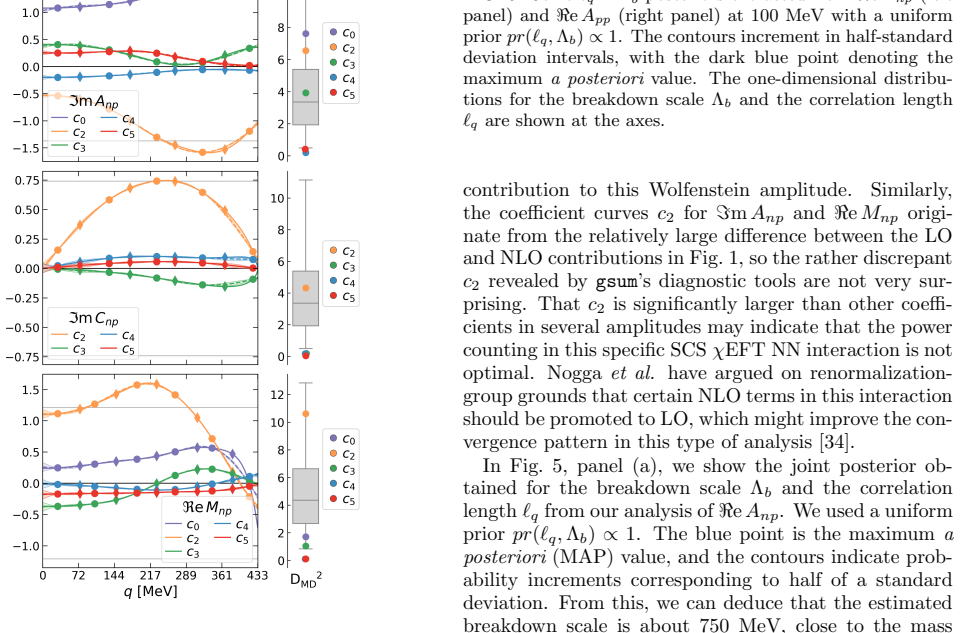
The machinery is the Gaussian-process model of Eq. (5): each dimensionless coefficient curve $c_n(q;E)$, defined as the difference between successive chiral orders divided by $y_{\mathrm{ref}}$ and by $Q^n$, is treated as an independent draw from a zero-mean GP with a common variance and a squared-exponential correlation in momentum transfer. The expansion parameter $Q = (s_{\max}(p,q)+m_\pi)/(\Lambda_b+m_\pi)$ folds both the relative momentum and the momentum transfer into the counting, and $y_{\mathrm{ref}} = \mathrm{Im}\, A_{np}$ sets the overall scale for both np and pp amplitudes. The Mahalanobis distance and credible-interval diagnostics test whether the single-GP hypothesis is consistent with the computed curves and produce joint posteriors for the correlation length $\ell_q$ and the breakdown scale $\Lambda_b$.
What would settle it
Run the identical GP analysis, with the same $y_{\mathrm{ref}} = \mathrm{Im}\, A_{np}$ and the same $Q$ of Eq. (9), on order-by-order Wolfenstein amplitudes from the same chiral potential at a different cutoff (for example, R = 1.0 fm) or from a momentum-space chiral potential; if the Mahalanobis distances for NLO and higher coefficients fall outside the chi-squared bands, or if the extracted $\Lambda_b$ shifts by more than the quoted uncertainties, the regular convergence and the 750–800 MeV breakdown scale are specific to the chosen potential rather than a general property of chiral EFT.
Extended reading notes
Core claim
The central discovery is that the order-by-order convergence of the nucleon-nucleon Wolfenstein amplitudes in a semi-local coordinate-space chiral potential is regular at NLO and beyond, provided the coefficient curves are defined with the expansion parameter $Q = (s_{\max}(p,q)+m_\pi)/(\Lambda_b+m_\pi)$ and the reference amplitude $y_{\mathrm{ref}} = \mathrm{Im}\, A_{np}$ at the same energy. Under those choices, the coefficients $c_n(q;E)$ of Eq. (3) pass the Gaussian-process diagnostics, so the truncation uncertainties computed from the GP model cover both higher chiral orders and the empirical amplitudes from a high-precision phenomenological potential across most of the angular range. The extracted breakdown scale is stable around 750–800 MeV, with a momentum correlation length near the pion mass. Leading order, in contrast, fails its own 95% bands in several amplitudes, most clearly for proton-proton scattering, indicating that one-pion exchange plus S-wave counterterms is not a reliable starting point for this expansion.
Load-bearing premise
The analysis hangs on the assumption that, after rescaling with the chosen reference amplitude and expansion parameter, the successive-order coefficient curves at each energy are independent draws from a single zero-mean Gaussian process with a common size and correlation length; if the coefficient curves actually have different shapes or sizes across orders, the reported truncation uncertainties and the 750–800 MeV breakdown scale do not follow.
Editorial extensions
If this is right
- Truncation errors for the Wolfenstein amplitudes at NLO, N2LO, N3LO, and N4LO can be reported as correlated 95% bands in scattering angle between 25 and 200 MeV, and these bands contain the next chiral order and the empirical amplitudes over most of the angular range.
- The chiral-EFT breakdown scale in the NN sector is pinned near 750–800 MeV, so the expansion parameter at the highest energy considered, roughly 0.5, is as large as expected and there is no hidden breakdown below the rho-meson mass.
- Leading-order truncation errors are not dependable, particularly for proton-proton scattering and for the imaginary parts of the central and tensor amplitudes, where the LO band fails to cover the NLO and final results.
- Because the analysis is carried out in the invariant operator basis of the amplitude, the correlated uncertainties can be propagated directly to ab initio calculations that use that operator structure, such as nucleon-nucleus scattering from spin-0 targets.
- The momentum correlation length extracted from the amplitudes, roughly 140–160 MeV, is close to the physical pion mass and roughly constant across energy, which gives a simple prior for future truncation-error analyses.
Reading between the lines
- The paper fixes the reference amplitude and the momentum-transfer dependence of $Q$ by checking the same data they are later used to describe, so the reported band coverage and $\Lambda_b$ posteriors are partly tuned; a cleaner test would freeze these choices on one energy and then predict the others.
- If the leading-order failure is generic, it supports a modified power counting in which some NLO contact interactions are promoted to leading order; that promotion would make the $c_2$ coefficients comparable to $c_0$ and might restore regular convergence from the first chiral order.
- The same Gaussian-process machinery applied to other operator decompositions, such as the spin-isospin channels entering nuclear matter or electroweak currents, could use the inferred pion-scale correlation length as a shared prior.
- The closeness of $\Lambda_b$ to the rho-meson mass suggests that vector-meson physics, not just pion physics, sets the radius of convergence of the chiral expansion in the NN system, which would motivate comparing against potentials that explicitly include vector-meson exchanges.
Editorial analysis
A structured set of objections, weighed in public.
Referee Report
Summary. The manuscript applies the BUQEYE Gaussian-process framework to the five NN Wolfenstein amplitudes computed with the semi-local coordinate-space chiral EFT potential at laboratory energies from 25 to 200 MeV. It defines order-by-order coefficient functions c_n via Eq. (3), using a momentum-transfer-dependent expansion parameter Q (Eq. (9)) and a reference amplitude yref taken from the imaginary part of the np A amplitude, with unspecified scaling and offsets. GP hyperparameters and the breakdown scale Lambda_b are inferred from these coefficient curves, yielding quoted average Lambda_b values of 750 to 800 MeV. Truncation-error bands at each chiral order are then compared with higher-order results and with CD-Bonn amplitudes. The authors conclude that the BUQEYE model describes the coefficients well and that truncation uncertainties cover both higher-order and empirical amplitudes at NLO and beyond, while LO is a poor starting point, especially for pp scattering. The presentation is clear and the diagnostics are shown in detail, but the headline coverage claim is stronger than the evidence in the body, and the selection of yref and Q makes part of the validation in-sample.
Significance. If the central claim were established, the paper would provide a useful step toward correlated, angle-dependent truncation uncertainties for invariant NN amplitudes, with direct relevance to ab initio calculations using operator representations and to power-counting discussions for chiral NN potentials. The manuscript's strengths are its transparency: the Mahalanobis and credibility-interval diagnostics are displayed, the gsum package is identified, and the comparison with CD-Bonn provides an external, empirically constrained benchmark. The authors also explicitly acknowledge several amplitudes and angular regions where coverage fails, which is a sign of care. However, the claim of regular convergence at NLO and beyond is not as cleanly supported as the abstract suggests, and the tuning of yref and Q on the basis of the same diagnostics used for validation weakens the evidentiary value of the coverage results. The work is therefore of moderate significance: a careful revision that qualifies the claims and documents or tests the tuning choices would make it a solid contribution.
major comments (4)
- [Sec. II.C, Figs. 2-3; Sec. III] The validation of the GP model is partly in-sample. The choices of yref = scaled/offset Im A_np and the Q of Eq. (9) are justified by improved Mahalanobis and CD-Bonn coverage diagnostics on the same coefficient curves that are later used to claim that truncation bands cover higher-order results. Consequently, the statement that the NLO-and-beyond uncertainties 'cover higher-order results well' is not an independent test of the GP hypothesis in Eq. (5); it is a calibration check. Please reframe the conclusions accordingly, or provide a genuine holdout analysis, for example by inferring hyperparameters from a subset of orders or energies and testing on the remainder.
- [Abstract vs. Secs. III-IV] The blank claim that truncation uncertainties cover higher-order and empirical amplitudes 'well for all orders other than the leading order' is contradicted by the body. For Re M_pp at 100 MeV the NLO band is underestimated at low q (Fig. 11); for Im C_np at 200 MeV the CD-Bonn curve is in tension even with the N4LO band (Fig. 8); for Re A_np at 100 MeV coverage begins only at N2LO (Fig. 6); and for Im C_pp at 200 MeV the NLO and N2LO bands do not envelop the higher-order errors or the CD-Bonn result (Fig. 13). The abstract should be revised to state that coverage holds on average, with these explicit exceptions.
- [Eq. (5) and Secs. III-IV] The GP hypothesis that all c_n are independent draws from a single zero-mean process is violated by the reported LO and NLO coefficient curves, with c0 and c2 exceeding 2cbar for several amplitudes (e.g., Re A_np, Im A_np, Im C_np, Re M_np in Fig. 4; Re App, Im App, Re Mpp in Fig. 10). Since these curves are included in the training data used to infer cbar, ell_q, and Lambda_b, the extracted hyperparameters and the resulting truncation errors are conditioned on a misspecified model. Please either exclude the offending orders from the GP fit for those amplitudes, or quantify how the coverage conclusions change when the outliers are removed.
- [Sec. II.C, Eq. (3)] The scaling and offset applied to yref are not specified. The text says only that 'we took the freedom to scale Im A_np and, in some cases applied an offset,' without giving the scale factors or offsets for each energy. Because the coefficient curves and all subsequent inferences are defined relative to yref, this is a reproducibility problem. Please provide a table of the yref choices for every energy and amplitude, or demonstrate that the results are insensitive to reasonable variations of those choices.
minor comments (6)
- [Eq. (11)] The expression 1.01^{N p} + 1.01^{N q} requires p and q to be dimensionless; please state explicitly that p and q are to be taken in MeV, or define dimensionless variables in the smooth maximum.
- [Appendix B, Figs. 20-22] The captions for Figs. 20-22 refer to Re Gnp and Re Hnp, but these panels are for pp scattering; they should read Re Gpp and Re Hpp.
- [Abstract and Secs. III-IV] The quoted average Lambda_b values should be reconciled: the text reports an np average of 800 MeV (860 MeV if Re H_np is included) and a pp average of 750 MeV (740 MeV without Re H_pp), while the abstract states 'between 750 and 800 MeV' without explaining the averaging.
- [Sec. II.B and throughout] Calling CD-Bonn results 'empirical Wolfenstein amplitudes' is imprecise, since CD-Bonn is a potential fit to data rather than a direct measurement; consider 'empirically constrained amplitudes' or 'CD-Bonn proxy.'
- [Sec. V] There is a typo in the conclusions: 'momentum-indepedent counterterms' should be 'momentum-independent counterterms.'
- [Sec. II.C] The paper would benefit from a table listing, for each amplitude and energy, the number of training and testing points used, since the text states that these are chosen case-by-case without reporting the actual numbers.
Circularity Check
Post-hoc selection of yref and Q on the CD-Bonn validation data, together with GP fits trained on the same coefficient curves used for higher-order coverage tests, makes the 'regular convergence' claim substantially in-sample.
-
fitted input called prediction
[Sec. II C (specific analysis choices; Fig. 3), invoked in the abstract and Sec. V]
"The use of ℑm Anp for yref and Eq. (9) for Q is supported by overall improvements in the Mahalanobis distance and credible interval diagnostics (across all amplitudes). Specifically, the spread of squared Mahalanobis distances better follow a χ2 distribution (see Fig. 3 for an example), and the credible intervals are more consistent with the amplitudes given by the CD-Bonn potential."
The CD-Bonn amplitudes are the paper's proxy for empirical Wolfenstein amplitudes, and they are used both to select yref and the momentum-transfer-dependent Q of Eq. (9) and then, in the DCI diagnostic and in Figs. 6-8, to claim that the resulting truncation uncertainties 'cover both higher-order results and empirical Wolfenstein amplitudes well.' Because the choices were tuned to improve CD-Bonn coverage, that coverage is an in-sample property of the chosen analysis setup rather than an independent validation of the predicted error bands.
-
fitted input called prediction
[Sec. II B (Eqs. (3)-(8)) and Sec. III (Fig. 6 discussion)]
"The parameters ¯c2 and ℓq are estimated based on the training data supplied, i.e., the discrete sets of points we choose from each cn to represent the curve. ... The curves cn will best fulfill the criterion that they are described by a GP for a particular value of the χEFT breakdown scale Λb."
The truncation band at order k is set by the fitted GP variance ¯c^2, which is estimated from all coefficient curves cn, including c_{k+1}. The higher-order result y_{k+1} differs from y_k by c_{k+1} yref Q^{k+1}, so testing whether the order-k band covers y_{k+1} is equivalent to testing whether an in-sample coefficient lies within the fitted 2¯c band. The paper's statement that 'the truncation errors fulfill this expectation for ℜe Anp starting only at N2LO' is therefore a description of the training data, not an out-of-sample prediction.
full rationale
The paper contains a real external benchmark, the high-precision CD-Bonn potential, and the BUQEYE Gaussian-process framework is a legitimate statistical model with its own diagnostics. However, the central validation loop is compromised in two ways. First, the reference amplitude yref and the expansion parameter Q of Eq. (9) are explicitly selected on the basis of improved Mahalanobis and CD-Bonn credible-interval diagnostics on the same amplitudes later claimed as validated, so the CD-Bonn coverage is not an independent test. Second, the GP hyperparameters and the breakdown scale Lambda_b are estimated from the same order-by-order coefficient curves used to test whether each order's band covers the next order, making the higher-order coverage statements in-sample. The abstract's blanket claim that the bands cover 'all orders other than the leading order' also conflicts with the body's own caveats, such as Re Anp coverage only starting at N2LO, LO and NLO underestimation for Re Mpp, and tension in Im C. Because the CD-Bonn potential is at least an external input, even though it was used for selection, the analysis is not purely self-referential; a moderate score of 5 is appropriate rather than a score of 8-10.
Assumptions & free parameters
free parameters (4)
- breakdown scale Lambda_b =
750 MeV (adopted); MAP values range from about 600 MeV to above 1000 MeV across amplitudes and energies
- GP variance cbar^2 =
Not tabulated; fitted per amplitude and per energy
- GP momentum correlation length lq =
About 120 to 160 MeV, varying by amplitude
- yref scaling and offset =
Values not reported
assumptions (5)
- domain assumption The order-by-order coefficient curves are independent, identically distributed draws from a single zero-mean Gaussian process with common variance and squared-exponential correlation (Eq. 5).
- standard math Five complex Wolfenstein functions (A, C, M, G, H) plus separate np and pp amplitudes suffice to represent the on-shell NN amplitude.
- domain assumption The SCS chiral EFT NN potential of Epelbaum, Krebs, and Meissner at R = 0.9 fm provides the correct order-by-order NN amplitudes for this analysis.
- domain assumption CD-Bonn potential amplitudes serve as a proxy for experimental data with negligible uncertainty.
- ad hoc to paper The expansion parameter Q = [smax(p,q) + m_pi] / (Lambda_b + m_pi), with physical m_pi and the smooth maximum of Eq. (11), is the appropriate soft scale.
Cite this review
Pith. "Pith review of Order-by-order uncertainties of nucleon-nucleon Wolfenstein amplitudes in chiral effective field theory." pith.science (2026). https://pith.science/paper/QU7ZWWPB
@misc{pith2026250109231,
  author       = {Pith},
  title        = {Pith review of: Order-by-order uncertainties of nucleon-nucleon Wolfenstein amplitudes in chiral effective field theory},
  year         = {2026},
  howpublished = {\url{https://pith.science/paper/QU7ZWWPB}},
  note         = {Machine review of arXiv:2501.09231}
}
abstract
Quantum mechanical invariance principles dictate the most general operator structure that can be present in the nucleon-nucleon (NN) interaction. Five independent operators appear in the on-shell NN amplitude together with five corresponding coefficient functions. The usual choice for these coefficient functions is known as the NN Wolfenstein amplitudes. We analyze the order-by-order convergence of each of the five NN Wolfenstein amplitudes predicted by a semi-local coordinate space potential implementation of chiral effective field theory ($\chi$EFT). We do this at laboratory kinetic energies between 25 and 200 MeV for both neutron-proton and proton-proton scattering. Our analysis uses the Gaussian-Process methods developed by the BUQEYE collaboration to describe the contributions of each $\chi$EFT order, and so yields truncation uncertainties for each Wolfenstein amplitude that are correlated across scattering angles. We combine information on the size of different orders in the EFT to infer the $\chi$EFT breakdown scale for each amplitude, finding, on average, $\Lambda_b$ between 750 and 800 MeV. With this choice of $\Lambda_b$, the EFT truncation uncertainties cover both higher-order results and empirical Wolfenstein amplitudes well for all orders other than the leading order.
Figures


Figures from the paper (14 more)


Reference graph
Works this paper leans on
-
[1]
E. Epelbaum, H.-W. Hammer, and U.-G. Meißner, Rev. Mod. Phys. 81, 1773 (2009), arXiv:0811.1338
arXiv 2009
- [2]
-
[3]
R. Machleidt and F. Sammarruca, Prog. Part. Nucl. Phys. 137, 104117 (2024), arXiv:2402.14032 [nucl-th]
arXiv 2024
-
[4]
R. J. Furnstahl, N. Klco, D. R. Phillips, and S. Wesolowski, Phys. Rev. C 92, 024005 (2015), arXiv:1506.01343 [nucl-th]
arXiv 2015
-
[5]
J. A. Melendez, S. Wesolowski, and R. J. Furnstahl, Phys. Rev. C 96, 024003 (2017), arXiv:1704.03308 [nucl- th]
arXiv 2017
-
[6]
J. A. Melendez, R. J. Furnstahl, D. R. Phillips, M. T. Pratola, and S. Wesolowski, Phys. Rev. C 100, 044001 (2019), arXiv:1904.10581 [nucl-th]
arXiv 2019
-
[7]
E. Epelbaum, J. Golak, K. Hebeler, H. Kamada, H. Krebs, Ulf-G. Meißner, A. Nogga, P. Rein- ert, R. Skibi´ nski, K. Topolnicki, Y. Volkotrub, and H. Wita la, Eur. Phys. J. A 56, 92 (2020), arXiv:1907.03608 [nucl-th]
arXiv 2020
-
[8]
S. Binder, A. Calci, E. Epelbaum, R. J. Furn- stahl, J. Golak, K. Hebeler, T. H¨ uther, H. Kamada, H. Krebs, P. Maris, Ulf-G. Meißner, A. Nogga, R. Roth, R. Skibi´ nski, K. Topolnicki, J. P. Vary, K. Vobig, and H. Wita la (LENPIC Collaboration), Phys. Rev. C 98, 014002 (2018), arXiv:1802.08584 [nucl-th]
arXiv 2018
Show all 35 references
-
[9]
Maris et al., Phys
P. Maris et al., Phys. Rev. C 103, 054001 (2021), arXiv:2012.12396 [nucl-th]
2021 arXiv
-
[10]
Maris et al
P. Maris et al. (LENPIC), Phys. Rev. C 106, 064002 (2022), arXiv:2206.13303 [nucl-th]
2022 arXiv
-
[11]
R. B. Baker, B. McClung, C. Elster, P. Maris, S. P. Weppner, M. Burrows, and G. Popa, Phys. Rev. C 106, 064605 (2022), arXiv:2112.02442 [nucl-th]
2022 arXiv
-
[12]
Drischler, R
C. Drischler, R. J. Furnstahl, J. A. Melendez, and D. R. Phillips, Phys. Rev. Lett. 125, 202702 (2020), arXiv:2004.07232 [nucl-th]
2020 arXiv
-
[13]
Drischler, J
C. Drischler, J. A. Melendez, R. J. Furnstahl, and D. R. Phillips, Phys. Rev. C 102, 054315 (2020), arXiv:2004.07805 [nucl-th]
2020 arXiv
-
[14]
P. J. Millican, R. J. Furnstahl, J. A. Melendez, D. R. Phillips, and M. T. Pratola, Phys. Rev. C 110, 044002 (2024), arXiv:2402.13165 [nucl-th]
2024 arXiv
-
[15]
Okubo and R
S. Okubo and R. E. Marshak, Annals Phys.4, 166 (1958)
1958
-
[16]
Veerasamy, C
S. Veerasamy, C. Elster, and W. Polyzou, (2012)
2012
-
[17]
Golak, W
J. Golak, W. Gl¨ ockle, R. Skibinski, H. Witala, D. Rozpedzik, K. Topolnicki, I. Fachruddin, Ch. El- ster, and A. Nogga, Phys. Rev. C 81, 034006 (2010), arXiv:1001.1264 [nucl-th]
2010 arXiv
-
[18]
Fachruddin, C
I. Fachruddin, C. Elster, and W. Gloeckle, Phys.Rev. C62, 044002 (2000)
2000
-
[19]
Wolfenstein and J
L. Wolfenstein and J. Ashkin, Phys. Rev. 85, 947 (1952)
1952
-
[20]
Wolfenstein, Ann
L. Wolfenstein, Ann. Rev. Nucl. Part. Sci. 6, 43 (1956)
1956
-
[21]
C. E. Rasmussen and C. K. I. Williams, Gaussian Processes for Machine Learning, Adaptive computation and machine learning series (University Press Group Limited, Cambridge, MA, 2006)
2006
-
[22]
L. S. Bastos and A. O’Hagan, Technometrics 51, 425 (2009)
2009
-
[23]
Epelbaum, H
E. Epelbaum, H. Krebs, and U. G. Meißner, Eur. Phys. J. A 51, 53 (2015), arXiv:1412.0142 [nucl-th]
2015 arXiv
-
[24]
Epelbaum, H
E. Epelbaum, H. Krebs, and U. G. Meißner, Phys. Rev. Lett. 115, 122301 (2015), arXiv:1412.4623 [nucl-th]
2015 arXiv
-
[25]
Hoshizaki, Prog
N. Hoshizaki, Prog. Theor. Phys. Suppl. 42, 1 (1968)
1968
-
[26]
Bystricky, F
J. Bystricky, F. Lehar, and P. Winternitz, J. Phys. (France) 39, 1 (1978)
1978
-
[27]
Gloeckle, The Quantum Mechanical Few-Body Problem, Texts and Monographs in Physics (Springer Verlag, 1983)
W. Gloeckle, The Quantum Mechanical Few-Body Problem, Texts and Monographs in Physics (Springer Verlag, 1983)
1983
-
[28]
J. A. Melendez, “ gsum,” (2020), Python package available for download from Github, github.com/buqeye/gsum
2020
-
[29]
Machleidt, Phys
R. Machleidt, Phys. Rev. C 63, 024001 (2001), arXiv:nucl-th/0006014 [nucl-th]
2001 arXiv
- [30]
-
[31]
Assessing Correlated Trun- cation Errors in Modern Nucleon-Nucleon Potentials,
P. J. Millican, R. J. Furnstahl, J. A. Melendez, D. R. Phillips, and M. T. Pratola, “Assessing Correlated Trun- cation Errors in Modern Nucleon-Nucleon Potentials,” In preparation
-
[32]
Epelbaum, PoS CD2018, 006 (2019)
E. Epelbaum, PoS CD2018, 006 (2019)
2019
-
[33]
Burrows, R
M. Burrows, R. B. Baker, Ch. Elster, S. P. Weppner, K. D. Launey, P. Maris, and G. Popa, Phys. Rev. C 102, 034606 (2020), arXiv:2005.00111 [nucl-th]
2020 arXiv
-
[34]
Nogga, R
A. Nogga, R. G. E. Timmermans, and U. van Kolck, Phys. Rev. C72, 054006 (2005)
2005
-
[35]
H. P. Stapp, T. J. Ypsilantis, and N. Metropolis, Phys. Rev. 105, 302 (1957)
1957
Reviewed August 10, 2026 · model on record in the stance chip above.
Discussion (0). Continue with ORCID to comment.