REVIEW 3 major objections 5 minor 47 references
Simons Observatory: Characterization of the Large Aperture Telescope Receiver
T0 review · 3 major / 5 minor · reviewed 2026-08-10 · deepseek-v4-flash
Pith's one-line read The Large Aperture Telescope Receiver, the largest cryogenic camera built for CMB observations, meets the thermal, optical, and detector specifications needed for the Simons Observatory's planned sky survey.
desk verdict A solid, honest instrument characterization; the 13-OT compliance claim is a labeled extrapolation and the Zotefoam switch is the real open item. read the letter →
The pith
A machine-rendered reading of the paper's core claim, the machinery that carries it, and where it could break.
The reading
What carries the argument
The central mechanism is the LATR's five-stage cryogenic architecture — 80 K, 40 K, 4 K, 1 K, and 100 mK stages connected by pulse-tube cryocoolers, a dilution refrigerator, and copper heat straps — combined with a linear extrapolation model for thermal loading, $q_{13} = q_{\mathrm{dark}} + \frac{13}{7}(q_7 - q_{\mathrm{dark}})$, that turns measurements from one, three, and seven optics tubes into a prediction for thirteen. A 65 µW resistive heater on the 100 mK bus simulates the full receiver's expected load and directly tests the coldest stage. For the detectors, the validating tools are in-situ noise-equivalent power measurements, I-V yield curves, and SVD common-mode subtraction of dark time-ordered data from telescope scans.
What would settle it
Measure the 40 K and 4 K stage loads in a cooldown with all thirteen optics tubes installed (or with a representative set of dummy loads) and compare them to the paper's predictions of $66 \pm 2$ W at 40 K and $1.7 \pm 0.2$ W at 4 K; a measured 40 K load near or above the 110 W pulse-tube capacity, or a 100 mK focal-plane temperature above 100 mK, would show the linear scaling model fails and the receiver would not meet its cryogenic specification.
Extended reading notes
Core claim
The paper's central claim is that the LATR meets the cryogenic, optical, and detector specifications required for high-sensitivity CMB measurements. Concretely, the five cryogenic stages stay within their loading and temperature budgets in extrapolations to the full thirteen-optics-tube receiver; the deployed MF arrays meet their yield targets and their dark noise-equivalent powers are consistent with or below forecast values; and the optical chain, including the removal of a 1 K low-pass edge filter, maintains the expected bandpass and loading. The strongest evidence comes from dark testing inside the LAT with six optics tubes installed, where scanning at the planned 1 deg/s rate left detector noise and cold-stage temperatures at the same level as when the telescope was stationary.
Load-bearing premise
The conclusion that the fully populated 13-tube receiver stays cold enough rests on assuming the heat load added by each optics tube is the same, so a measurement with 7 tubes can be scaled up by a simple ratio of 13/7; the paper says this is only a good approximation and the tested configurations were not identical.
Editorial extensions
If this is right
- With the LAT mirrors installed, the six already-tested optics tubes should support on-sky observations at detector noise at or below the forecast levels used in the Simons Observatory sensitivity predictions.
- The full thirteen-tube receiver is projected to cool to base temperature in 10–11 days and to keep all focal-plane stages below the 100 mK requirement, based on the linear loading model and the heater simulation.
- LAT scanning at 1 deg/s with 60-degree throws does not raise detector noise or cold-stage temperatures above specification, so the planned scan strategy is compatible with the receiver's thermal environment.
- The switch to Zotefoam filters preserves sub-4 K thermal performance and leaves the MF bandpass unaffected, so the current configuration can proceed while further study continues.
Reading between the lines
- The paper does not test the full 13-tube configuration; the linear scaling model is an extrapolation that a future cooldown with all tubes installed could validate or refute by comparing measured loads to the predicted $66 \pm 2$ W at 40 K and $1.7 \pm 0.2$ W at 4 K.
- The reported SVD common-mode subtraction removes about 99% of low-frequency dark noise because the dominant low-frequency component is common to all detectors; the same approach may work on sky, which would make the planned maximum-likelihood mapmaker more likely to converge cleanly.
- The heater-driven method used to measure TES-to-bath coupling (0.025 pW/mK) could serve as a standard acceptance test for future CMB receivers, since it directly quantifies how much thermal fluctuation contaminates detector timestreams.
- If the Zotefoam replacement continues to pass bandpass and loading checks, it removes the need for the more fragile double-sided infrared blocking filters, simplifying filter procurement and installation for the remaining seven optics tubes.
Editorial analysis
A structured set of objections, weighed in public.
Referee Report
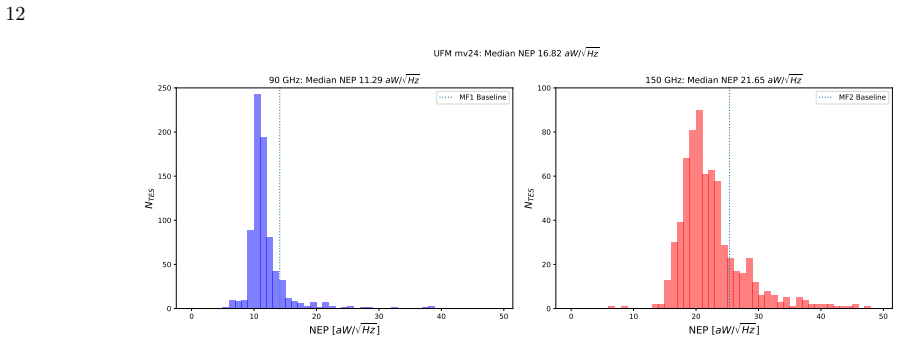
Summary. This paper reports the laboratory and on-telescope characterization of the Simons Observatory Large Aperture Telescope Receiver (LATR). The authors describe the receiver design, cryogenic validation of the 80 K, 40 K, 4 K, 1 K, and 100 mK stages, readout and detector validation with deployed MF UFMs, in-lab vibration testing, and initial dark testing after integration with the LAT. The central claim is that the LATR meets the cryogenic, optical, and detector specifications needed for high-sensitivity CMB observations, with six optics tubes currently installed and the remaining seven under development. The 13-OT cryogenic conclusion is obtained by extrapolation from measured dark and 7-OT configurations via a linear loading model, and the paper notes that a change from DSIR filters to Zotefoam alters the warmer-stage loading and is still under investigation.
Significance. If the six-OT results are representative of the final receiver, the paper provides valuable evidence that the LATR is ready to support the planned LAT survey once mirrors are installed. The study's strengths include direct cryogenic loading measurements on progressively populated configurations, NEP distributions that meet the stated dark baseline specifications for the majority of detectors, detector yields exceeding the 70% threshold, thermal-stability measurements at the 100 mK stage, and scan-stability tests showing close agreement between scanning and staring noise. The main advertised result, however, is the 13-OT compliance claim, and that claim currently rests on a linear extrapolation and on a filter stack that has been superseded by Zotefoam in the flight configuration. These caveats are acknowledged in the text but are not reflected in the abstract or in the framing of the central conclusion, so the paper overstates the support for the full 13-OT cryogenic specification.
major comments (3)
- [Section 3.2, Eq. (1)] The 13-OT 40 K and 4 K loading estimates are obtained by linear scaling q13 = qdark + (13/7)(q7 - qdark), applied to the dark and 7-OT DSIR-era measurements. The paper itself notes that the configurations are not strictly well-defined and that the scaling is only approximate. After the DSIR-to-Zotefoam change described in Section 6, the 6-OT measurement gives 61 W at 40 K with a dark load of 33 W; applying the same linear scaling to these points would give approximately 94 W for 13 OTs, rather than the reported 66 +/- 2 W. While 94 W would still be below the 110 W capacity, the reported forecast and the associated statement that the 13-OT receiver meets cryogenic specifications are not supported for the current filter stack. Please recompute the 13-OT projection for the Zotefoam configuration or clearly qualify the 13-OT claim as applying only to the previous DSIR stack and as still under verification.
- [Section 6] The final flight configuration now uses Zotefoam instead of DSIRs, and the paper reports that this change increased 40 K loading to about 65 W and changed 80 K loading substantially, with the statement 'We are currently investigating this change further.' Because Tables 1 and 2 are based on the DSIR filter stack and are used to support the cryogenic-compliance conclusions of Section 3, the paper's central compliance claim is based on hardware no longer in use. The manuscript should state explicitly which conclusions apply to the current Zotefoam configuration and should provide updated loading estimates or measurements for that configuration, or defer the 13-OT compliance claim until such data are available.
- [Section 3.1] The 13-OT 100 mK estimate depends on an assumed loading of 5 uW per OT and a single-point heater test in which 65 uW was applied to one resistive heater to simulate the full 13-OT configuration. This is a projection rather than a measured validation: the text reports a measured single-OT load of <=6 uW and a two-OT load of 10 uW, and the resulting 80 mK hottest-FPB estimate also relies on an assumed worst-case BUS-to-FPB gradient from previous cooldowns. Please present the systematic uncertainty in this projection and label the result as an extrapolated estimate rather than a direct measurement.
minor comments (5)
- [Section 5.2] The subsection titled 'Ambient RF' is empty; Section 6 immediately follows the heading. Either supply the content or remove the heading.
- [Table 1 and Table 2 captions] The captions contain typos ('T able', 'specfications') and the final rows describing the 6-OT measurements do not state that those data were taken with the Zotefoam stack; please add a note pointing to Section 6.
- [Section 3.1] The sentence 'we estimated the FPB temperature in a 13 OT cooldown to be >= 91 mK' appears to be a typographical error; given the 100 mK requirement and the surrounding discussion, it should likely read '<= 91 mK' or otherwise be clarified.
- [Section 5.1] There are minor typographical errors in this section, including 'accelorometer' for 'accelerometer'.
- [Section 2.2] The phrase 'The UFMs are distributied across' contains a typo ('distributied' should be 'distributed').
Circularity Check
No significant circularity: the validation claims rest on direct measurements against internally defined specifications; extrapolations are explicit modeling approximations, not fitted inputs renamed as predictions.
full rationale
The paper's central claim is that the LATR meets cryogenic, optical, and detector specifications. These specifications are project-defined budgets and forecasts (e.g., from Zhu et al. 2021 and BoloCalc in Hill et al. 2018), but the validation consists of direct measurements: stage temperatures, loading values, detector yields, NEPs, and noise ASDs. None of these measurements is derived from the specification it is compared against. The main extrapolation, Eq. 1, q13 = qdark + (13/7)(q7 - qdark), is an explicit linear-scaling model with no free parameters fitted to the 13-OT result; it uses the measured dark and 7-OT points and is labeled 'to a good approximation,' so it is a stated modeling assumption rather than a circular reduction. Similarly, the 100 mK 13-OT temperature estimate is a heater-based thermal-response test under an explicitly stated assumed 5 uW per OT load, not a fitted prediction disguised as a measurement. Self-citations (Zhu et al. 2021, Haridas et al. 2024, Satterthwaite et al. 2024) provide prior single-OT measurements, companion dark-noise data, and UFM performance results; these are independent inputs or companion measurements, not the load-bearing derivation of the present claims. Concerns about the linearity of Eq. 1 and the switch to Zotefoam filters changing the 40 K and 80 K loading are legitimate correctness risks, but they are not circularity because the paper explicitly flags them as approximations or open investigations. No step in the derivation chain reduces, by the paper's own equations or by self-citation, to its own inputs.
Assumptions & free parameters
free parameters (2)
- 100 mK per-OT loading assumption =
5 µW
- Cooldown time per OT =
0.5 days
assumptions (4)
- domain assumption Thermal loading at 40 K and 4 K scales linearly with the number of OTs (Eq. 1).
- domain assumption The heater test with 65 µW reproduces the thermal state of 13 OTs at 100 mK.
- domain assumption BoloCalc forecasted NEPs and K/pW conversions are reliable predictors for dark and sky loading.
- domain assumption Zotefoam filter replacement does not change detector loading at 1 K and 100 mK.
Cite this review
Pith. "Pith review of Simons Observatory: Characterization of the Large Aperture Telescope Receiver." pith.science (2026). https://pith.science/paper/A3IHIMS7
@misc{pith2026250109241,
  author       = {Pith},
  title        = {Pith review of: Simons Observatory: Characterization of the Large Aperture Telescope Receiver},
  year         = {2026},
  howpublished = {\url{https://pith.science/paper/A3IHIMS7}},
  note         = {Machine review of arXiv:2501.09241}
}
read the original abstract
The Simons Observatory (SO) is a ground-based cosmic microwave background (CMB) survey experiment that currently consists of three 0.42m small-aperture telescopes (SATs) and one 6m large-aperture telescope (LAT), located at an elevation of 5200m in the Atacama Desert in Chile. At the LAT's focal plane, SO will install >62,000 transition-edge sensor detectors across 13 optics tubes (OTs) within the Large Aperture Telescope Receiver (LATR), the largest cryogenic camera ever built to observe the CMB. Here we report on the validation of the LATR in the laboratory and the subsequent dark testing and validation within the LAT. We show that the LATR meets cryogenic, optical, and detector specifications required for high-sensitivity measurements of the CMB. At the time of writing, the LATR is installed in the LAT with six OTs (corresponding to >31,000 detectors), and the LAT mirrors and remaining seven OTs are undergoing development.
Figures


Figures from the paper (11 more)




Reference graph
Works this paper leans on
-
[1]
2015, Astroparticle Physics, 63, 66, doi: https://doi.org/10.1016/j.astropartphys.2014.05.014
Abazajian, K., Arnold, K., Austermann, J., et al. 2015, Astroparticle Physics, 63, 66, doi: https://doi.org/10.1016/j.astropartphys.2014.05.014
-
[2]
Ade, P. A. R., Pisano, G., Tucker, C., & Weaver, S. 2006, in Millimeter and Submillimeter Detectors and Instrumentation for Astronomy III, ed. J. Zmuidzinas, W. S. Holland, S. Withington, & W. D. Duncan, Vol. 6275, International Society for Optics and Photonics (SPIE), 62750U, doi: 10.1117/12.673162 20
-
[3]
Ade, P. A. R., Ahmed, Z., Amiri, M., et al. 2022, The Astrophysical Journal, 927, 77, doi: 10.3847/1538-4357/ac4886
-
[4]
2020, Astronomy and Astrophysics, 641, A6, doi: 10.1051/0004-6361/201833910
Aghanim, N., Akrami, Y., Ashdown, M., et al. 2020, Astronomy and Astrophysics, 641, A6, doi: 10.1051/0004-6361/201833910
- [5]
-
[6]
Millimeter, Submillimeter, and Far-Infrared Detectors and Instrumentation for Astronomy XI, ed. J. Zmuidzinas & J.-R. Gao, Vol. 12190, International Society for Optics and Photonics (SPIE), 1219012, doi: 10.1117/12.2629557
-
[7]
E., Bocquet, S., Stalder, B., et al
Bleem, L. E., Bocquet, S., Stalder, B., et al. 2020, The Astrophysical Journal Supplement Series, 247, 25, doi: 10.3847/1538-4365/ab6993
-
[8]
Carlstrom, J. E., Ade, P. A. R., Aird, K. A., et al. 2011, PASP, 123, 568, doi: 10.1086/659879
doi:10.1086/659879 2011
Show all 47 references
-
[9]
2013, Review of Scientific Instruments, 84, 114502, doi: 10.1063/1.4827081
Choi, J., Ishitsuka, H., Mima, S., et al. 2013, Review of Scientific Instruments, 84, 114502, doi: 10.1063/1.4827081
2013 doi
-
[10]
2018, in 2018SPIE10708, ed
Coppi, G., Xu, Z., Ali, A., et al. 2018, in 2018SPIE10708, ed. J. Zmuidzinas & J.-R. Gao, Vol. 10708, International Society for Optics and Photonics (SPIE), 246 – 258, doi: 10.1117/12.2312679
2018 doi
-
[11]
W., Datta, R., et al
Dahal, S., Appel, J. W., Datta, R., et al. 2022, The Astrophysical Journal, 926, 33, doi: 10.3847/1538-4357/ac397c DESI Collaboration, Aghamousa, A., Aguilar, J., et al. 2016, The DESI Experiment Part I: Science,Targeting, and Survey Design. https://arxiv.org/abs/1611.00036
2022 arXiv
-
[12]
Thangaraj, J. C. T. 2020, Superconductor Science Technology, 33, 06LT01, doi: 10.1088/1361-6668/ab82f0
2020 doi
-
[13]
R., Gallardo, P
Dicker, S. R., Gallardo, P. A., Gudmundsson, J. E., et al. 2018, in 2018SPIE10700, ed. H. K. Marshall & J. Spyromilio, Vol. 10700, International Society for Optics and Photonics (SPIE), 1064 – 1076, doi: 10.1117/12.2313444
2018 doi
-
[14]
M., Austermann, J., Beall, J
Duff, S. M., Austermann, J., Beall, J. A., et al. 2024, Journal of Low Temperature Physics, doi: 10.1007/s10909-024-03117-x
2024 doi
-
[15]
M., Groh, J
Dutcher, D., Duff, S. M., Groh, J. C., et al. 2024, Journal of Low Temperature Physics, 214, 247, doi: 10.1007/s10909-023-03045-2 D¨ unner, R., Hasselfield, M., Marriage, T. A., et al. 2012, The Astrophysical Journal, 762, 10, doi: 10.1088/0004-637x/762/1/10
2024 doi
-
[16]
2024, The Astrophysical Journal Supplement Series, 274, 33, doi: 10.3847/1538-4365/ad64c9
Galitzki, N., Tsan, T., Spisak, J., et al. 2024, The Astrophysical Journal Supplement Series, 274, 33, doi: 10.3847/1538-4365/ad64c9
2024 doi
-
[17]
E., Gallardo, P
Gudmundsson, J. E., Gallardo, P. A., Puddu, R., et al. 2021, Appl. Opt., 60, 823, doi: 10.1364/AO.411533
2021 doi
-
[18]
K., Ahmed, Z., Bhandarkar, T., et al
Haridas, S. K., Ahmed, Z., Bhandarkar, T., et al. 2024, The Simons Observatory: Dark Characterization of the Large Aperture Telescope. https://arxiv.org/abs/2407.09669
2024 arXiv
-
[19]
W., Ahmed, Z., Brown, D., et al
Henderson, S. W., Ahmed, Z., Brown, D., et al. 2018, in
2018
-
[20]
Millimeter, Submillimeter, and Far-Infrared Detectors and Instrumentation forAstronomy IX, ed. J. Zmuidzinas & J.-R. Gao (SPIE), doi: 10.1117/12.2314435
-
[21]
A., Bruno, S
Hill, C. A., Bruno, S. M., Simon, S. M., et al. 2018, in
2018
-
[22]
Millimeter, Submillimeter, and Far-Infrared Detectors and Instrumentation for Astronomy IX, ed. J. Zmuidzinas & J.-R. Gao (SPIE), doi: 10.1117/12.2313916
-
[23]
2021, ApJS, 253, 3, doi: 10.3847/1538-4365/abd023
Hilton, M., Sif´ on, C., Naess, S., et al. 2021, ApJS, 253, 3, doi: 10.3847/1538-4365/abd023
2021 doi
-
[24]
2005, Transition-Edge Sensors (Berlin, Heidelberg: Springer Berlin Heidelberg), 63–150, doi: 10.1007/10933596 3
Irwin, K., & Hilton, G. 2005, Transition-Edge Sensors (Berlin, Heidelberg: Springer Berlin Heidelberg), 63–150, doi: 10.1007/10933596 3
2005 doi
-
[25]
1997, Physical Review Letters, 78, 2058, doi: 10.1103/physrevlett.78.2058
Kamionkowski, M., Kosowsky, A., & Stebbins, A. 1997, Physical Review Letters, 78, 2058, doi: 10.1103/physrevlett.78.2058
1997 doi
-
[26]
J., Lashner, J., Saunders, L
Koopman, B. J., Lashner, J., Saunders, L. J., et al. 2020, in Software and Cyberinfrastructure for Astronomy VI, ed. J. C. Guzman & J. Ibsen (SPIE), 6, doi: 10.1117/12.2561771
2020 doi
-
[27]
J., Bhimani, S., Galitzki, N., et al
Koopman, B. J., Bhimani, S., Galitzki, N., et al. 2024, The Simons Observatory: Deployment of the observatory control system and supporting infrastructure. https://arxiv.org/abs/2406.15703
2024 arXiv
-
[28]
2023, ApJ, 956, 36, doi: 10.3847/1538-4357/ace599
Li, Y., Biermann, E., Naess, S., et al. 2023, ApJ, 956, 36, doi: 10.3847/1538-4357/ace599
2023 doi
-
[29]
S., Qu, F
Madhavacheril, M. S., Qu, F. J., Sherwin, B. D., et al. 2024, ApJ, 962, 113, doi: 10.3847/1538-4357/acff5f
2024 doi
-
[30]
2021, The Astrophysical Journal, 922, 38, doi: 10.3847/1538-4357/ac2232
McCarrick, H., Healy, E., Ahmed, Z., et al. 2021, The Astrophysical Journal, 922, 38, doi: 10.3847/1538-4357/ac2232
2021 doi
-
[31]
E., Bhandarkar, T., DiGia, B., et al
Moore, J. E., Bhandarkar, T., DiGia, B., et al. 2022, in
2022
-
[32]
Millimeter, Submillimeter, and Far-Infrared Detectors and Instrumentation for Astronomy XI, ed. J. Zmuidzinas & J.-R. Gao, Vol. 12190, International Society for Optics and Photonics (SPIE), 1219025, doi: 10.1117/12.2630527
-
[33]
Niemack, M. D. 2016, Appl. Opt., 55, 1688, doi: 10.1364/AO.55.001688
2016 doi
-
[34]
C., Battaglia, N., et al
Orlowski-Scherer, J., Venterea, R. C., Battaglia, N., et al. 2024, The Astrophysical Journal, 964, 138, doi: 10.3847/1538-4357/ad21fe
2024 doi
-
[35]
L., Zhu, N., Xu, Z., et al
Orlowski-Scherer, J. L., Zhu, N., Xu, Z., et al. 2018, in 2018SPIE10708, ed. J. Zmuidzinas & J.-R. Gao, Vol. 10708, International Society for Optics and Photonics (SPIE), 644 – 657, doi: 10.1117/12.2312868 21 POLARBEAR Collaboration, Adachi, S., Fa´ undez, M. A. O. A., et al. ...
2018 doi
-
[36]
P., Ahmed, Z., Bae, K., et al
Satterthwaite, T. P., Ahmed, Z., Bae, K., et al. 2024, in Society of Photo-Optical Instrumentation Engineers (SPIE) Conference Series, Vol. 13102, Society of Photo-Optical Instrumentation Engineers (SPIE) Conference Series, ed. J. Zmuidzinas & J.-R. Gao, 1310223, doi: 10.1117/...
2024 doi
- [37]
-
[38]
2022, in
Silva-Feaver, M., Ahmed, Z., Arnold, K., et al. 2022, in
2022
-
[39]
Millimeter, Submillimeter, and Far-Infrared Detectors and Instrumentation for Astronomy XI, ed. J. Zmuidzinas & J.-R. Gao, Vol. 12190, International Society for Optics and Photonics (SPIE), 121900U, doi: 10.1117/12.2629024 The Simons Observatory Collaboration, 2019, JCAP, 2019...
-
[40]
J., Ade, P
Thornton, R. J., Ade, P. A. R., Aiola, S., et al. 2016, ApJS, 227, 21, doi: 10.3847/1538-4365/227/2/21
2016 doi
-
[41]
2022, Journal of Low Temperature Physics, 209, 944, doi: 10.1007/s10909-022-02870-1
Wang, Y., Zheng, K., Atkins, Z., et al. 2022, Journal of Low Temperature Physics, 209, 944, doi: 10.1007/s10909-022-02870-1
2022 doi
-
[42]
2009, AIP Conference Proceedings, 1185, 681, doi: 10.1063/1.3292433
Woodcraft, A., & Gary, A. 2009, AIP Conference Proceedings, 1185, 681, doi: 10.1063/1.3292433
2009 doi
-
[43]
2020, in
Xu, Z., Bhandarkar, T., Coppi, G., et al. 2020, in
2020
-
[44]
Millimeter, Submillimeter, and Far-Infrared Detectors and Instrumentation for Astronomy X, ed. J. Zmuidzinas & J.-R. Gao, Vol. 11453, International Society for Optics and Photonics (SPIE), 1145315, doi: 10.1117/12.2576151
-
[45]
E., Adachi, S., et al
Xu, Z., Chesmore, G. E., Adachi, S., et al. 2021, Applied Optics, 60, 864, doi: 10.1364/ao.411711
2021 doi
-
[46]
C., et al
Yu, C., Ahmed, Z., Frisch, J. C., et al. 2023, Review of Scientific Instruments, 94, 014712, doi: 10.1063/5.0125084
2023 doi
-
[47]
2021, The Astrophysical Journal Supplement, 256, 23, doi: 10.3847/1538-4365/ac0db7 ˇZeljko Ivezi´ c, Kahn, S
Zhu, N., Bhandarkar, T., Coppi, G., et al. 2021, The Astrophysical Journal Supplement, 256, 23, doi: 10.3847/1538-4365/ac0db7 ˇZeljko Ivezi´ c, Kahn, S. M., Tyson, J. A., et al. 2019, The Astrophysical Journal, 873, 111, doi: 10.3847/1538-4357/ab042c
2021 doi
Reviewed August 10, 2026 · model on record in the stance chip above.
Discussion (0). Continue with ORCID to comment.