REVIEW 3 major objections 8 minor 14 references
Topology of Out-of-Distribution Examples in Deep Neural Networks
T0 review · 3 major / 8 minor · reviewed 2026-08-10 · deepseek-v4-flash
Pith's one-line read A well-trained ResNet18 does not topologically simplify out-of-distribution embeddings, leaving their average persistence statistically longer than for training or test examples.
desk verdict OOD examples show longer average H0 persistence in ResNet18 embeddings, but the 'no topological simplification' reading is undercut by that statistic being a scale measure; still deserves peer review with a normalization control. read the letter →
The pith
A machine-rendered reading of the paper's core claim, the machinery that carries it, and where it could break.
The reading
What carries the argument
The central object is the 0-dimensional persistent homology (H0) of the Vietoris-Rips filtration on bootstrap subsamples of the embedding layer. Each H0 feature is born at filtration radius zero when a point appears and dies when it merges into another component; the lifetime is that death radius. The summary statistic is the average lifetime over all H0 features in a subsample. The authors use Ripser to compute persistence diagrams and bootstrap resampling (50,000 iterations, subsample sizes 25–150) to obtain distributions and 95% confidence intervals that separate OOD from in-distribution data.
What would settle it
Recompute the H0 average lifetime on embeddings after normalizing each point to unit norm. If the OOD versus in-distribution gap vanishes under this normalization, the reported effect is a scale artifact, not a topological property.
Extended reading notes
Core claim
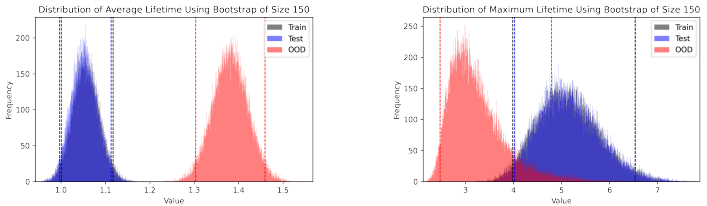
The central claim is that the average lifetime (persistence) of OOD examples is statistically longer than that of training or test examples. The authors measure this by computing persistent homology of bootstrap subsamples of 512-dimensional embeddings from the penultimate layer of ResNet18. For H0, average lifetime separates the OOD distribution from the in-distribution distributions with non-overlapping 95% confidence intervals, while the training and test distributions nearly coincide. For H1, the differences are much weaker, indicating that the signal lives primarily in the connected-component structure. The authors argue that this is a 'topological landmark' for OOD inputs: the network trivializes in-distribution embeddings by merging clusters, but cannot do the same for unfamiliar data.
Load-bearing premise
The argument assumes that average H0 lifetime measures topological simplification rather than the overall scale or spread of the embedding points, because larger or more variable embeddings would mechanically lengthen lifetimes.
Editorial extensions
If this is right
- A detector could flag inputs as OOD when a bootstrap subsample of their embeddings has an average H0 lifetime above a threshold calibrated on in-distribution data.
- Topological simplification appears to be a property of well-trained networks that holds for test data, not just for the training set.
- The distance between average-lifetime distributions might serve as a quantitative measure of how far a new dataset is from a model's learned manifold.
- Because only H0 is needed, the approach is computationally feasible for realistic architectures and could scale to deployment.
Reading between the lines
- If the gap is driven by embedding scale, normalizing embeddings would shrink it; if it survives normalization, the topological interpretation would be strengthened, and this is a testable next step.
- Average H0 lifetime could be combined with existing OOD scores (like softmax confidence or energy) to improve detection without retraining the network.
- The near-overlap of H1 distributions across OOD and in-distribution data suggests that higher-dimensional homology contributes little for these datasets, so a practical detector could ignore H1 entirely.
- The method's sensitivity to subsample size (tested up to 150) is unexplored; larger subsamples might sharpen the separation but increase computation, so an efficiency–accuracy tradeoff remains open.
Signed reviews
Editorial analysis
A structured set of objections, weighed in public.
Referee Report
Summary. The paper studies the persistent homology of latent embeddings from a ResNet18 classifier, comparing bootstrap subsamples of training, test, and out-of-distribution (OOD) data. For two settings (MNIST vs. EMNIST and CIFAR-10 vs. CIFAR-100), it computes H0 and H1 summary statistics, primarily average and maximum lifetimes, over 50,000 bootstrap iterations. The central empirical claim is that the average H0 lifetime of OOD embeddings is longer than that of in-distribution training or test embeddings, which the authors interpret as evidence that well-trained DNNs do not induce the same topological simplification on OOD inputs that they induce on in-distribution data.
Significance. If the central claim survives scrutiny, the paper would extend the topological-simplification observations of Naitzat et al. (2020) to realistic architectures and datasets, and would identify a simple persistent-homology summary as a potentially useful signal for OOD detection. The computational pipeline, using bootstrap subsampling and GPU-accelerated Ripser, is a practical strength, and the comparison across four benchmark datasets is a reasonable first step. However, the current evidence is not yet convincing: the headline statistic is scale-dependent, the paper lacks a formal statistical test, and the connection between the measured quantity and the stated topological conjecture is not established.
major comments (3)
- [§5.2 and §6] The headline result rests on the H0 average lifetime, but this quantity is not a topological invariant in the sense needed by the paper's argument. Because every H0 feature is born at filtration value zero, the average lifetime equals the average death time, which is exactly the average merge distance of the single-linkage clustering of the bootstrap subsample. A change in the overall scale or spread of the embedding points therefore changes the average lifetime even if the connectivity structure is unchanged. The paper reports no normalization of embedding norms, pairwise distances, or per-dimension scales, so the observed OOD gap in Tables 1 and 2 may simply reflect larger-norm or more dispersed OOD embeddings rather than a failure of topological simplification. I ask the authors to repeat the analysis after normalizing each bootstrap subsample (e.g., by the median pairwise distance or by per-dimension standard deviation) and to report whether the separation survives; a comparison with the trivial baseline of mean pairwise distance would additionally show what TDA adds.
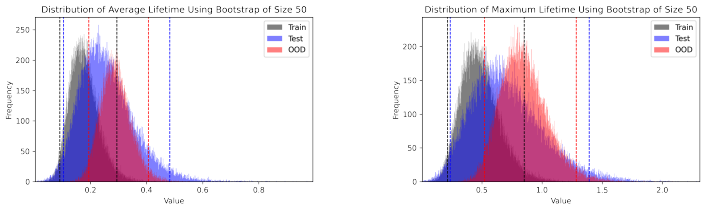
- [§6, Tables 1–2] The abstract and Section 6 claim the OOD average lifetime is "statistically longer," but the paper never performs a statistical test. The 95% bootstrap confidence intervals for the n=150 samples do not overlap, which is suggestive, but the text does not report a p-value, an effect size, or any correction for the multiple sample sizes shown in Appendix A. Moreover, only one trained model per dataset is examined, so no statement can be made about variability across training runs. I request a formal two-sample test (bootstrap or permutation test) on the lifetime distributions, results for all sample sizes, and at least a few independently trained models to establish that the gap is not specific to one training run.
- [§3 and §6] The paper's conceptual claim is about topological simplification, operationalized in Section 3 as the trivialization of each class subset to β0=1 and the multi-class conjecture β0(f(X))=n. However, the reported summary statistics never directly measure Betti numbers or the number of connected components; H0 average lifetime is a summary of merge distances, not a count of components. To connect the measurements to the stated conjecture, the authors should report, for the same bootstrap subsamples, the number of H0 features (or the persistence diagram rank) and the class-wise behavior, and verify that ID subsamples actually exhibit approximately ten connected components for CIFAR-10/MNIST before claiming that OOD data "does not hold" the trivialization property.
minor comments (8)
- [Abstract and §5.1] The text uses "CIF AR-10" and "CIF AR-100" with a space; the standard notation is CIFAR-10 and CIFAR-100, and the inconsistent spacing should be fixed throughout.
- [§2] The word "complimentary" in the paragraph on activation graphs should be "complementary."
- [§4.3] The sentence "converges (asymptotically) to the the ground truth" contains a duplicated article and should read "to the ground truth."
- [§4.3] The sentence beginning "Rabadán and Blumberg [2019] present a simplified explanation of approach developed by Fasy et al. [2013], Chazal et al. [2013] demonstrates..." is ungrammatical and should be revised for clarity.
- [§5.1] Training details for the ResNet18 models (epochs, optimizer, learning rate, and test accuracy) are not reported, which makes it difficult to assess how "well-trained" the models are; these details should be added or referenced.
- [§6.1] The text asserts that the trivialization effect "holds for all classes and both training and test splits," but no class-wise results are shown; please either add class-wise figures/tables or soften the claim.
- [Figures 3 and 5] The captions describe H1 features as "connected components," but H1 features are loops or holes; the captions should be corrected.
- [§1.1] The term "landmarks" is introduced in the abstract and contributions but is not defined or used again; either define it or remove it.
Circularity Check
No load-bearing circularity: the H0 lifetime comparisons are computed directly from bootstrap subsamples, with no fitted parameters and no self-citation chain; the scale-sensitivity of H0 lifetimes is a correctness/interpretation caveat, not an equation-level circularity.
full rationale
The paper's central empirical claim is that average H0 lifetime for OOD embeddings exceeds that of training/test embeddings. This quantity is computed directly from persistent homology of bootstrap subsamples (Sections 5.2-5.3), so there is no parameter fitted to the target comparison and no prediction reducing to a fit. The 'topological simplification' framing is inherited from Naitzat et al. (2020) as an external prior, not from the authors' own prior work, and no uniqueness theorem is imported. The H0 average lifetime being equal to average death time (because births are 0 by construction) is a genuine property of the estimator, but the paper's inference from longer average lifetime to 'no topological simplification' is an interpretive leap; it could be confounded by embedding scale/spread. That is a threat to construct validity and should be addressed by a normalization control, but it is not a circular derivation: the measured statistic is not defined in terms of the conclusion, and the empirical separation is externally falsifiable. Accordingly, under the hard rules, no specific circular step is identified.
Assumptions & free parameters
free parameters (1)
- Headline summary statistic selection (H0 average lifetime)
assumptions (3)
- domain assumption Well-trained DNNs induce topological simplification of per-class training data (Naitzat et al. 2020).
- domain assumption The training set T is sufficient for characterizing the topology of the data manifold M.
- ad hoc to paper In a multi-class problem, each class subset is trivialized to a separate connected component (β0 = n).
Cite this review
Pith. "Pith review of Topology of Out-of-Distribution Examples in Deep Neural Networks." pith.science (2026). https://pith.science/paper/NBIBSMO6
@misc{pith2026250112522,
  author       = {Pith},
  title        = {Pith review of: Topology of Out-of-Distribution Examples in Deep Neural Networks},
  year         = {2026},
  howpublished = {\url{https://pith.science/paper/NBIBSMO6}},
  note         = {Machine review of arXiv:2501.12522}
}
read the original abstract
As deep neural networks (DNNs) become increasingly common, concerns about their robustness do as well. A longstanding problem for deployed DNNs is their behavior in the face of unfamiliar inputs; specifically, these models tend to be overconfident and incorrect when encountering out-of-distribution (OOD) examples. In this work, we present a topological approach to characterizing OOD examples using latent layer embeddings from DNNs. Our goal is to identify topological features, referred to as landmarks, that indicate OOD examples. We conduct extensive experiments on benchmark datasets and a realistic DNN model, revealing a key insight for OOD detection. Well-trained DNNs have been shown to induce a topological simplification on training data for simple models and datasets; we show that this property holds for realistic, large-scale test and training data, but does not hold for OOD examples. More specifically, we find that the average lifetime (or persistence) of OOD examples is statistically longer than that of training or test examples. This indicates that DNNs struggle to induce topological simplification on unfamiliar inputs. Our empirical results provide novel evidence of topological simplification in realistic DNNs and lay the groundwork for topologically-informed OOD detection strategies.
Figures


Figures from the paper (10 more)




Reference graph
Works this paper leans on
-
[1]
M. Abdelsalam, R. Krishnan, Y. Huang, and R. Sandhu. Malware detection in cloud infrastructures using convolutional neural networks. In 2018 IEEE 11th international conference on cloud computing (CLOUD) , pages 162–169. IEEE,
work page 2018
- [4]
-
[9]
URL http://arxiv.org/ abs/2105.04404. arXiv:2105.04404 [cs, stat]. S. Liang, Y. Li, and R. Srikant. Enhancing the reliability of out- of-distribution image detection in neural networks. arXiv preprint arXiv:1706.02690,
-
[12]
doi: 10.1109/ ICCVW60793.2023.00348. Y. Skaf and R. Laubenbacher. Topological data analysis in biomedicine: A review. Journal of Biomedical Informatics , 130:104082,
arXiv 2023
-
[2008]
I. J. Goodfellow, J. Shlens, and C. Szegedy. Explaining and harnessing adversarial examples. arXiv preprint arXiv:1412.6572 ,
-
[2015]
19 D. Hendrycks and K. Gimpel. A baseline for detecting misclassified and out-of-distribution examples in neural networks. arXiv preprint arXiv:1610.02136,
-
[2016]
R. Ballester, C. Casacuberta, and S. Escalera. Topological data analysis 18 for neural network analysis: A comprehensive survey. arXiv preprint arXiv:2312.05840,
-
[2017]
A. Singh. Surround-view vision-based 3d detection for autonomous driv- ing: A survey. In 2023 IEEE/CVF International Conference on Com- puter Vision Workshops (ICCVW) , pages 3235–3244,
work page 2023
Show all 14 references
-
[2018]
URL https://doi.org/10.21105/joss
doi: 10.21105/joss.00925. URL https://doi.org/10.21105/joss. 00925. M. Wheeler, J. Bouza, and P. Bubenik. Activation landscapes as a topologi- cal summary of neural network performance. In 2021 IEEE International Conference on Big Data (Big Data) , pages 3865–3870. IEEE,
2021 doi
-
[2019]
Rieck, M
B. Rieck, M. Togninalli, C. Bock, M. Moor, M. Horn, T. Gumbsch, and K. Borgwardt. Neural persistence: A complexity measure for deep neural networks using algebraic topology.arXiv preprint arXiv:1812.09764,
-
[2021]
Amodei, C
D. Amodei, C. Olah, J. Steinhardt, P. Christiano, J. Schulman, and D. Man´ e. Concrete problems in ai safety. arXiv preprint arXiv:1606.06565,
-
[2022]
B. T. Fasy, F. Lecci, A. Rinaldo, L. Wasserman, S. Balakrishnan, and A. Singh. Statistical inference for persistent homology: Confidence sets for persistence diagrams. arXiv preprint arXiv:1303.7117 ,
-
[2023]
Gebhart and P
T. Gebhart and P. Schrater. Adversary detection in neural networks via persistent homology. arXiv preprint arXiv:1711.10056 ,
-
[2024]
Zhang, M
S. Zhang, M. Xiao, and H. Wang. Gpu-accelerated computation of vietoris- rips persistence barcodes. arXiv preprint arXiv:2003.07989 ,
2003
Reviewed August 10, 2026 · model on record in the stance chip above.
Discussion (0). Continue with ORCID to comment.