REVIEW 4 major objections 5 minor 42 references
Breaking the degeneracy in stellar spectral classification from single wide-band images
T0 review · 4 major / 5 minor · reviewed 2026-08-10 · deepseek-v4-flash
Pith's one-line read A PSF-aware classifier recovers stellar spectral classes from single wide-band images by comparing each star to an approximate chromatic PSF model.
desk verdict Genuinely new PSF-aware classification idea with mostly honest body text, but the 91% headline is the perfect-PSF ceiling and no experiment touches model misspecification; worth serious review. read the letter →
The pith
A machine-rendered reading of the paper's core claim, the machinery that carries it, and where it could break.
The reading
What carries the argument
The load-bearing object is the similarity feature vector of Eq. 4: for each wavelength bin $\lambda_k$, one minus the squared Frobenius distance between the observed star image and the approximate monochromatic PSF at that wavelength, normalized so the eight features sum to one. Because the true star image is a sum of monochromatic PSFs weighted by the SED (Eq. 2), high similarity at a wavelength marks a large SED weight, so the vector acts as a proxy for the star's spectrum. The classifier is a C-support vector machine with radial-basis-function kernels applied to these feature vectors. The authors adopt the WaveDiff PSF model both as the simulator generating ground-truth observations and as the approximate PSF model fitted to subsets of the stars, and the eight-bin SED discretization comes from Pickles templates restricted to the Euclid VIS passband.
What would settle it
Take a set of Euclid-like single-band star images with spectroscopically known spectral types, fit an approximate PSF model independently of the truth, apply the similarity-feature SVM, and compare predicted and known classes; if the top-two accuracy on such real data does not exceed the pixel-only baseline, the central claim fails. A sharper simulation test generates ground-truth observations with a PSF simulator different in family from WaveDiff and then fits the approximate model with WaveDiff; if class separation degrades sharply, the reported gains depend on using the same model family for truth and approximation.
Extended reading notes
Core claim
The central claim is that the degeneracy between PSF size and spectral type, the reason pixel-only classifiers stall around 75% top-two accuracy, can be broken by supplying the classifier with an approximate chromatic PSF model evaluated at the star's field position. In the discrete observation model, the star image is a sum of monochromatic PSFs weighted by the star's SED; the paper's similarity features measure, at each of eight wavelengths, how much the observation resembles the corresponding monochromatic PSF, normalized across wavelengths. These features act as a proxy for the SED weights, and an SVM with an RBF kernel trained on them assigns one of 13 Pickles spectral classes. With the ground-truth PSF the method reaches 91% top-two accuracy; with approximate WaveDiff PSF models the paper reports 88.6% top-two accuracy from 1000 training stars (0.9% relative error) and about 76% from 50 stars (2.4% error), and it concludes that even PSF models too coarse for weak-lensing analyses carry enough spectral information to outperform pixel-only classifiers.
Load-bearing premise
The approximate chromatic PSF model must be accurate enough, and close enough in family to the true PSF, that the similarity features separate stellar classes; in these simulations the true and approximate PSFs are both WaveDiff models, making the model family perfectly matched, and a 2.4% relative PSF error already drops top-two accuracy to about 76%, where the advantage over pixel-only methods nearly disappears.
Editorial extensions
If this is right
- Pixel-only classification does not improve when PCA is replaced by a CNN, which the paper reads as evidence that the PSF-size/spectral-type degeneracy, rather than feature extraction, caps accuracy.
- Approximate PSF models with 1% relative error recover 87% top-two accuracy, so the classifier does not require a final lensing-grade PSF to be useful.
- In the proof-of-concept, adding 2,000 stars with classified SEDs to 50 stars with known SEDs reduces the PSF relative error from 2.5% to 0.78%, a reduction of almost 70%, approaching the ideal case of 2,000 stars with known SEDs.
- The paper expects the method to work with any PSF modelling method that captures spectral variation, not just WaveDiff.
Reading between the lines
- The margin shown at 2.4% PSF error suggests that on real data the gain could be fragile: if the real PSF departs from the model family, the similarity features could lose their class-discriminating power even when the PSF error is small by the paper's metric.
- Because the similarity features are continuous proxies for the SED weights, the same pipeline could be extended to regress effective temperature or other continuous stellar parameters instead of choosing among 13 discrete templates.
- A single-pass pipeline underestimates the method's possible value: classification and PSF fitting could be alternated so that improved PSF models yield better features and better classifications in the next round; the paper only demonstrates one pass.
- In a real survey, the flat distribution of stellar types used here inflates accuracy relative to a magnitude-limited field where red stars dominate, so rebalancing or class-weighted evaluation would change the headline number.
Editorial analysis
A structured set of objections, weighed in public.
Referee Report
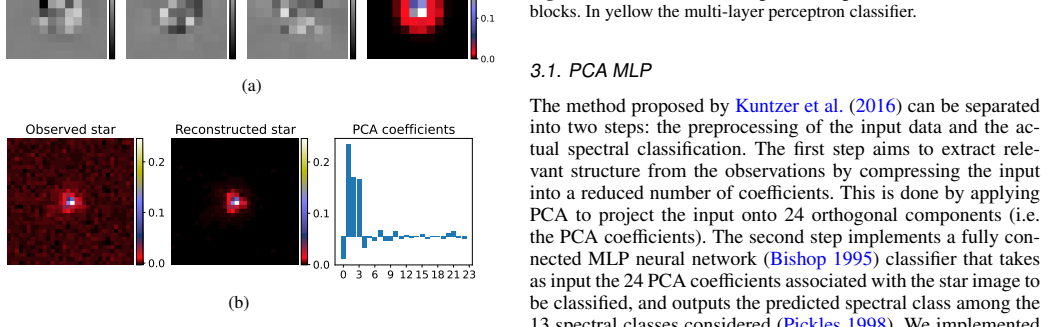
Summary. The manuscript addresses the problem of assigning spectral templates to unresolved stars observed in a single wide band, motivated by chromatic PSF modelling for weak-lensing surveys. The proposed classifier forms a vector of similarity features by comparing the observed star stamp with monochromatic PSFs from a preliminary PSF model at eight wavelengths, then applies an SVM in that feature space. The method is evaluated on WaveDiff-simulated Euclid-like images against two pixel-only baselines (PCA+MLP, following Kuntzer et al. 2016, and a CNN+MLP variant). The reported top-two accuracies are 0.91 with the ground-truth PSF, 0.886 with the best approximate PSF (2000 training stars), and 0.755 with the least accurate approximate PSF (50 stars). A proof-of-concept experiment shows that adding stars classified by this method can reduce the PSF relative error from about 2.4% to 0.78%.
Significance. If the result transfers to real data, the method would be a practical way to multiply the number of SED-labelled stars available for chromatic PSF modelling in Euclid-like exposures, which is a genuine bottleneck for data-driven PSF extraction. The paper's strengths are the clear problem formulation, the use of a public, physically motivated simulator, the public implementation, and the direct comparison with two relevant baselines. However, the significance is currently limited by the fact that the evidence is entirely simulated within the WaveDiff model family; the abstract's headline 91% is a perfect-PSF upper bound, and the claimed advantage over pixel-only methods is not demonstrated in the regime of largest PSF error. I would regard the central idea as promising and worth publishing after the internal-validity issues are addressed.
major comments (4)
- [§5.1, §6.3.1, Table E.1, Appendix C] The entire evaluation stays inside the WaveDiff parametric family: the ground-truth PSF is generated by WaveDiff (§5.1) and every approximate model is a WaveDiff fit to WaveDiff-simulated stars (Appendix C, §6.3.1). Consequently the approximate models differ from the truth only through a smaller number of training stars; no model misspecification (wrong Zernike order, wrong spatial polynomial degree, wrong chromatic dependence, or a non-parametric component outside the parameterization) is tested. This is load-bearing because this family match is what makes the similarity features informative. At the only point where the approximate PSF is poor (S1, 2.4% relative error), Table E.1 reports top-two accuracy 0.755, essentially equal to PCA+MLP (0.757) and CNN+MLP (0.746); absent uncertainty intervals these numbers are indistinguishable. The 91% figure in the Abstract is obtained with the ground-truth PSF. I recommend adding a misspecification experiment—for example, fitting a deliberately reduced WaveDiff model to data generated with a higher-order or non-parametric perturbation—or explicitly restricting the claims to the same-family regime.
- [§6.3.2, Table E.1] No uncertainty quantification is reported for the classification metrics. Every accuracy/F1/top-two value is a point estimate computed on a single 1000-star test set from one random PSF field. This matters not only for the headline claims but for the detailed comparison: the difference between S1 and the pixel-only baselines is 0.2–0.9 percentage points in top-two accuracy, and the claim in §6.3.2 that the method outperforms both baselines 'for every considered error level' cannot be supported without error bars. Please provide bootstrap confidence intervals over test stars or (better) variance over several independent simulated PSF fields.
- [§4.2, Eq. (4)] The sentence 'The resulting similarity features serve as a proxy for the SED values b_k' is asserted rather than derived. Equation (4) is a normalized distance that is not obviously equivalent to the SED weights in Eq. (2); its informativeness depends on the PSF model and on noise. Since the whole method rests on these features, the paper should either provide a short derivation linking Eq. (4) to Eq. (2) under stated assumptions, or include an explicit validation (e.g., correlation between the feature vector and the true b_k, or classification performance when the true SED is used as the feature vector).
- [§6.3.3] The proof-of-concept PSF-improvement experiment is partly circular: the 2000 additional stars are assigned SED templates by a classifier that uses the same approximate PSF model that is later refined with those labels. Because the observations and the classifier both come from the WaveDiff family, the errors in the labels are correlated with the model error, so the reported drop from 2.4% to 0.78% is a self-consistency result rather than an external validation of the improvement. The text itself calls the test 'highly idealised' (§6.3.3); the conclusions section should carry the same caveat when stating that classified stars reduce the PSF error by almost 70%.
minor comments (5)
- [Abstract] The sentence 'The proposed approach achieves a 91% top-two accuracy' should be qualified as the ground-truth-PSF upper bound; the approximate-PSF results range from 75.5% to 88.6% (Table E.1).
- [§4.3, §3.1] There are several typos: 'radial basis functio' should be 'radial basis function' (§4.3), 'coefficients' appears as 'coefficients' (§3.1), and the ligature 'WaveDi ff' appears at multiple page breaks.
- [Figure 8 caption] The caption states that the S1 relative error is 2.5%, while §6.3.1, Table 2, and Table E.1 use 2.4%; make the numbers consistent.
- [§6.1.1, Eq. (8)] Equation (8) defines CM_{ij} with 1[\hat y = i], but a confusion-matrix entry should count a true class i assigned to predicted class j; the surrounding text also mixes the notions of 'row' and 'predicted labels' and should be aligned with the formula.
- [§6.2, §6.3.2] The statement that the method surpasses pixel-only classifiers by 'around 10%' should specify the metric (top-two accuracy) and the PSF-quality range, since the S1 row in Table E.1 does not show a clear advantage over the baselines.
Circularity Check
No circularity: the pipeline is a standard supervised setup; the same-model simulation is a validity limitation, not a logical circle.
full rationale
The paper's derivation chain is self-contained and does not reduce to its inputs by construction. The similarity features (Eq. 4) are functions of the observed star image and the approximate PSF model; they are not fitted to the stellar labels. The SVM classifier is trained on these features with known labels and evaluated on a held-out test set of 1,000 stars, so reported accuracies (e.g., 91% top-two with ground-truth PSF) are measured outcomes, not re-statements of the training data. The approximate PSF models are fitted to separate star observations, and the PSF-aware classifier uses them only as auxiliary inputs; no parameter is renamed as a prediction. The proof-of-concept PSF improvement loop (Sect. 6.3.3) uses SEDs inferred from an approximate PSF to refine that same PSF, but the relative error of the improved PSF is evaluated against ground-truth PSF samples on test stars, so the improvement is not guaranteed by the loop's construction. The citations to WaveDiff and the PSF-model notation (Liaudat et al. 2023a,b) are normal tool/notation citations with overlapping authors, but they are not load-bearing: the method is not mathematically derived from WaveDiff, and the paper states similar performance is expected from any chromatic PSF model. The use of the same simulator to generate both ground truth and approximate PSF models means the study does not test PSF model misspecification on real data, a limitation for external validity, but this is not a circularity of the paper's derivation. No step in the argument asserts that X is true because the paper's own prior work says so; the empirical claims rest on the simulations and metrics presented here.
Assumptions & free parameters
free parameters (3)
- n_lambda: number of spectral bins / similarity features =
8
- SVM hyperparameters (C, gamma for RBF kernel) =
not reported (scikit-learn defaults assumed)
- PCA components and CNN architecture for baseline models =
24 PCA coefficients; 32 channels, 6 convolutional layers
assumptions (6)
- domain assumption An unresolved star observation is a SED-weighted sum of monochromatic PSFs plus additive Gaussian noise (Eq. 2)
- ad hoc to paper The WaveDiff WFE representation captures the true PSF without model misspecification
- ad hoc to paper Eight wavelength bins are sufficient to discriminate the 13 spectral types
- domain assumption Top-two accuracy is the relevant metric for PSF modelling use
- domain assumption The star sample is free of contamination by galaxies, binaries, and other sources
- domain assumption Pickles (1998) templates represent stellar SEDs in the Euclid VIS passband
Cite this review
Pith. "Pith review of Breaking the degeneracy in stellar spectral classification from single wide-band images." pith.science (2026). https://pith.science/paper/JPTIKLNV
@misc{pith2026250116151,
  author       = {Pith},
  title        = {Pith review of: Breaking the degeneracy in stellar spectral classification from single wide-band images},
  year         = {2026},
  howpublished = {\url{https://pith.science/paper/JPTIKLNV}},
  note         = {Machine review of arXiv:2501.16151}
}
read the original abstract
The spectral energy distribution (SED) of observed stars in wide-field images is crucial for chromatic point spread function (PSF) modelling methods, which use unresolved stars as integrated spectral samples of the PSF across the field of view. This is particularly important for weak gravitational lensing studies, where precise PSF modelling is essential to get accurate shear measurements. Previous research has demonstrated that the SED of stars can be inferred from low-resolution observations using machine-learning classification algorithms. However, a degeneracy exists between the PSF size, which can vary significantly across the field of view, and the spectral type of stars, leading to strong limitations of such methods. We propose a new SED classification method that incorporates stellar spectral information by using a preliminary PSF model, thereby breaking this degeneracy and enhancing the classification accuracy. Our method involves calculating a set of similarity features between an observed star and a preliminary PSF model at different wavelengths and applying a support vector machine to these similarity features to classify the observed star into a specific stellar class. The proposed approach achieves a 91\% top-two accuracy, surpassing machine-learning methods that do not consider the spectral variation of the PSF. Additionally, we examined the impact of PSF modelling errors on the spectral classification accuracy.
Figures


Figures from the paper (7 more)


Reference graph
Works this paper leans on
-
[1]
2019, The Wide Field Infrared Survey Telescope: 100 Hubbles for the 2020s
Akeson, R., Armus, L., Bachelet, E., et al. 2019, The Wide Field Infrared Survey Telescope: 100 Hubbles for the 2020s
work page 2019
-
[2]
2022, Frontiers in Astronomy and Space Sciences, 9
Akhaury, U., Starck, J.-L., Jablonka, P., Courbin, F., & Michalewicz, K. 2022, Frontiers in Astronomy and Space Sciences, 9
work page 2022
-
[3]
Baer, R. L. 2006, in Society of Photo-Optical Instrumentation Engineers (SPIE) Conference Series, V ol. 6068, Sensors, Cameras, and Systems for Scien- tific/Industrial Applications VII, ed. M. M. Blouke, 37–48
work page 2006
-
[4]
2003, The Messenger, 114, 10
Bagnulo, S., Jehin, E., Ledoux, C., et al. 2003, The Messenger, 114, 10
2003
-
[5]
2012, in Proceedings of Machine Learning Research, V ol
Baldi, P. 2012, in Proceedings of Machine Learning Research, V ol. 27, Pro- ceedings of ICML Workshop on Unsupervised and Transfer Learning, ed. I. Guyon, G. Dror, V . Lemaire, G. Taylor, & D. Silver (Bellevue, Washington, USA: PMLR), 37–49
work page 2012
-
[6]
1996, A&AS, 119, 373
Baranne, A., Queloz, D., Mayor, M., et al. 1996, A&AS, 119, 373
1996
-
[7]
2004, in Scientific Detectors for Astron- omy, ed
Basden, A., Tubbs, B., & Mackay, C. 2004, in Scientific Detectors for Astron- omy, ed. P. Amico, J. W. Beletic, & J. E. Beletic (Dordrecht: Springer Nether- lands), 599–602
work page 2004
-
[8]
2011, in Astronomical Society of the Pacific Conference Series, V ol
Bertin, E. 2011, in Astronomical Society of the Pacific Conference Series, V ol. 442, Astronomical Data Analysis Software and Systems XX, ed. I. N. Evans, A. Accomazzi, D. J. Mink, & A. H. Rots, 435
2011
Show all 42 references
-
[9]
& Arnouts, S
Bertin, E. & Arnouts, S. 1996, A&AS, 117, 393
1996
-
[10]
1995, Neural networks for pattern recognition (Oxford University
Bishop, C. 1995, Neural networks for pattern recognition (Oxford University
1995
-
[11]
2023, MNRAS, 518, 3123
Chaini, S., Bagul, A., Deshpande, A., et al. 2023, MNRAS, 518, 3123
2023
-
[12]
2013, Monthly Notices of the Royal Astronomical Society, 431, 3103 Euclid Collaboration, Cropper, M., Al-Bahlawan, A., et al
Cropper, M., Hoekstra, H., Kitching, T., et al. 2013, Monthly Notices of the Royal Astronomical Society, 431, 3103 Euclid Collaboration, Cropper, M., Al-Bahlawan, A., et al. 2024a, Euclid. II. The VIS Instrument Euclid Collaboration, Mellier, Y ., Abdurro’uf, et al. 2024b, Euc...
2013
-
[13]
Farrens, S., Lacan, A., Guinot, A., & Vitorelli, A. Z. 2022, A&A, 657, A98 Gaia Collaboration, Prusti, T., de Bruijne, J. H. J., et al. 2016, A&A, 595, A1
2022
-
[14]
R., Schrabback, T., Marggraf, O., et al
Gillis, B. R., Schrabback, T., Marggraf, O., et al. 2020, Monthly Notices of the Royal Astronomical Society, 496, 5017
2020
-
[15]
2020, Metrics for Multi-Class Classifica- tion: an Overview
Grandini, M., Bagli, E., & Visani, G. 2020, Metrics for Multi-Class Classifica- tion: an Overview
2020
-
[16]
W., Rhodes, J., Massey, R., & Ellis, R
High, F. W., Rhodes, J., Massey, R., & Ellis, R. 2007, PASP, 119, 1295
2007
-
[17]
M., Miller, C
Hopkins, A. M., Miller, C. J., Connolly, A. J., et al. 2002, The Astronomical Journal, 123, 1086 Ivezi´c, Z., Kahn, S. M., Tyson, J. A., et al. 2019, The Astrophysical Journal, 873, 111
2002
-
[18]
M., Amon, A., et al
Jarvis, M., Bernstein, G. M., Amon, A., et al. 2020, Monthly Notices of the Royal Astronomical Society, 501, 1282
2020
-
[19]
Kramer, M. A. 1991, AIChE Journal, 37, 233
1991
-
[20]
Krizhevsky, A., Sutskever, I., & Hinton, G. E. 2012, in Advances in Neural Infor- mation Processing Systems, ed. F. Pereira, C. Burges, L. Bottou, & K. Wein- berger, V ol. 25 (Curran Associates, Inc.)
2012
-
[21]
2016, A&A, 591, A54
Kuntzer, T., Tewes, M., & Courbin, F. 2016, A&A, 591, A54
2016
-
[22]
Lauer, T. R. 1999, PASP, 111, 1434
1999
-
[23]
2011, arXiv e-prints, arXiv:1110.3193
Laureijs, R., Amiaux, J., Arduini, S., et al. 2011, arXiv e-prints, arXiv:1110.3193
2011 arXiv
-
[24]
S., et al
LeCun, Y ., Boser, B., Denker, J. S., et al. 1989, Neural Computation, 1, 541
1989
-
[25]
2021, A&A, 646, A27 LSST Science Collaboration, Abell, P
Liaudat, T., Bonnin, J., Starck, J.-L., et al. 2021, A&A, 646, A27 LSST Science Collaboration, Abell, P. A., Allison, J., et al. 2009, LSST Science
2021
-
[26]
2018, Annual Review of Astronomy and Astrophysics, 56, 393
Mandelbaum, R. 2018, Annual Review of Astronomy and Astrophysics, 56, 393
2018
-
[27]
2012, Monthly Notices of the Royal Astronomical Society, 429, 661
Massey, R., Hoekstra, H., Kitching, T., et al. 2012, Monthly Notices of the Royal Astronomical Society, 429, 661
2012
-
[28]
W., Keenan, P
Morgan, W. W., Keenan, P. C., & Kellman, E. 1943, An atlas of stellar spectra, with an outline of spectral classification (The University of Chicago press) Ngolè, F., Starck, J.-L., Okumura, K., Amiaux, J., & Hudelot, P. 2016, Inverse Problems, 32, 124001
1943
-
[29]
Noll, R. J. 1976, J. Opt. Soc. Am., 66, 207
1976
-
[30]
Paulin-Henriksson, S., Amara, A., V oigt, L., Refregier, A., & Bridle, S. L. 2008, A&A, 484, 67
2008
-
[31]
2018, Scikit-learn: Machine Learning in Python
Pedregosa, F., Varoquaux, G., Gramfort, A., et al. 2018, Scikit-learn: Machine Learning in Python
2018
-
[32]
Perryman, M. A. C., de Boer, K. S., Gilmore, G., et al. 2001, A&A, 369, 339
2001
-
[33]
Pickles, A. J. 1998, Publications of the Astronomical Society of the Pacific, 110, 863 Sánchez-Blázquez, P., Peletier, R. F., Jiménez-Vicente, J., et al. 2006, MNRAS, 371, 703
1998
-
[34]
J., Teuben, P
Sault, R. J., Teuben, P. J., & Wright, M. C. H. 1995, in Astronomical Society of the Pacific Conference Series, V ol. 77, Astronomical Data Analysis Software and Systems IV , ed. R. A. Shaw, H. E. Payne, & J. J. E. Hayes, 433
1995
-
[35]
Schaefer, C., Geiger, M., Kuntzer, T., & Kneib, J. P. 2018, A&A, 611, A2
2018
-
[36]
H., Cañameras, R., et al
Schuldt, S., Suyu, S. H., Cañameras, R., et al. 2021, A&A, 651, A55
2021
-
[37]
2019, Monthly Notices of the Royal Astronomical Society, 491, 2280 Article number, page 11 of 15 A&A proofs: manuscript no
Sharma, K., Kembhavi, A., Kembhavi, A., et al. 2019, Monthly Notices of the Royal Astronomical Society, 491, 2280 Article number, page 11 of 15 A&A proofs: manuscript no. aanda
2019
-
[38]
2015, Wide-Field InfrarRed Survey Telescope-Astrophysics Focused Telescope Assets WFIRST-AFTA 2015 Re- port
Spergel, D., Gehrels, N., Baltay, C., et al. 2015, Wide-Field InfrarRed Survey Telescope-Astrophysics Focused Telescope Assets WFIRST-AFTA 2015 Re- port
2015
-
[39]
A., Singh, H
Valdes, F., Gupta, R., Rose, J. A., Singh, H. P., & Bell, D. J. 2004, ApJS, 152, 251
2004
-
[40]
Yang, Y . & Li, X. 2024, Universe, 10, 214
2024
-
[41]
Zeiler, M. D. & Fergus, R. 2013, Visualizing and Understanding Convolutional Networks
2013
-
[42]
2πi λ WFE(x, y|ui, vi) #)
Zeiler, M. D., Taylor, G. W., & Fergus, R. 2011, in 2011 International Conference on Computer Vision, 2018–2025 Article number, page 12 of 15 E. Centofanti: PSF-aware spectral classification Appendix A: PSF modelling notation Table A.1. Coordinates and notation used throughout...
2023
Reviewed August 10, 2026 · model on record in the stance chip above.
Discussion (0). Continue with ORCID to comment.