REVIEW 3 major objections 5 minor 17 references
SOLAS: Superpositioning an Optical Lens in Automotive Simulation
T0 review · 3 major / 5 minor · reviewed 2026-08-10 · deepseek-v4-flash
Pith's one-line read This paper claims that an open-source ray tracer, KrakenOS, produces point spread functions matching Ansys Zemax OpticStudio to about 0.02 RMSE, and that convolving these PSFs onto fisheye automotive simulations adds realistic spatially…
desk verdict A useful validation of KrakenOS against Zemax, but the realism claim for the fisheye degradation is explicitly conceded by the authors; treat this as a proof-of-concept pipeline paper, not a realism result. read the letter →
The pith
A machine-rendered reading of the paper's core claim, the machinery that carries it, and where it could break.
The reading
What carries the argument
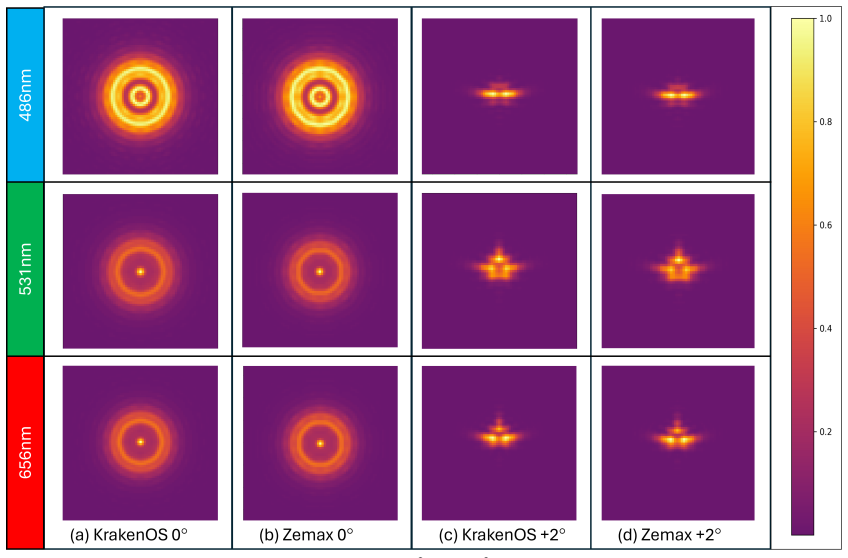
The load-bearing object is an optical doublet system under test, specified by six surfaces (object plane, BK7 front element, F2 rear element, air gap, aperture stop, and image plane). Around this system the paper builds PSF grids: an 8x8 and a 32x32 array of 160x160-pixel point spread functions, computed separately for red (656 nm), green (531 nm), and blue (486 nm) light over a ±2 degree field of view. Each grid tile is convolved with the spatially corresponding region of a 1280x960 fisheye image, so the PSF grid is the mechanism that turns ray-tracing output into image degradation. Matching these PSFs to Zemax is what supports the claim of industrial equivalence, and convolving them is what carries the optical artifacts into the simulations.
What would settle it
Compute KrakenOS and Zemax point spread functions for the same doublet at larger field angles, such as 10, 30, and 60 degrees, and compare them; if the RMSE grows well beyond 0.02, or if a fisheye image convolved with wide-angle PSFs no longer shows the reported center-versus-periphery sharpness pattern, then the equivalence claim holds only for the narrow field of view tested.
Extended reading notes
Core claim
On the paper's own terms, the central discovery is that KrakenOS-generated Fraunhofer point spread functions for a BK7-F2 optical doublet are nearly indistinguishable from Ansys Zemax OpticStudio's, with RMSE values around 0.02 for most wavelength and field-angle combinations and the green channel at 531 nm matching best. When arranged into 8x8 or 32x32 RGB PSF grids and convolved onto two fisheye automotive simulations, these PSFs transfer the doublet's coma and astigmatism into the images, blurring the periphery more than the center. Measured with the ISO 12233:2023 slanted-edge method, MTF50 drops by about 0.057 cycles/pixel in the middle region and 0.086 cycles/pixel at the edge, while the center is essentially unchanged. The authors conclude that KrakenOS can match industrial performance and that the degradation is spatially variant rather than a uniform Gaussian blur.
Load-bearing premise
The load-bearing assumption is that a simple doublet's point spread functions, computed over a ±2 degree field of view, represent the optical blur of the fisheye camera whose simulation images are being degraded.
Editorial extensions
If this is right
- Synthetic automotive data can be optically degraded with an open-source ray tracer, lowering the cost of lens-realistic simulation.
- Because the blur is spatially varying, downstream perception models trained on degraded images may learn to cope with field-dependent sharpness and aberrations rather than uniform Gaussian blur.
- The same pipeline can be reused for more complex lenses by swapping the doublet for a different system under test and recomputing its PSF grid.
- Sharpness measured by MTF50 gives a quantitative way to compare degraded simulations with real camera behavior, enabling lens-aware sim-to-real transfer.
Reading between the lines
- The authors' own caveat implies the pipeline becomes realistic only when the simulation warp and the convolution use the same lens; a natural extension is to estimate or measure the actual Woodscape fisheye lens PSFs and degrade with those.
- The ±2 degree field of view of the doublet is far smaller than a fisheye's field of view, so the reported spatially varying pattern should be treated as a demonstration of the mechanism rather than a model of a real fisheye lens.
- A testable extension is to feed both baseline and degraded simulations to a monocular depth estimator; given prior evidence that chromatic aberration and field-dependent blur affect depth accuracy, the degraded set should reproduce more of that behavior.
- Porting KrakenOS's ray tracing to a GPU would make fine PSF grids practical at full fisheye resolution, turning this offline pipeline into a plausible real-time augmentation for large-scale training.
Editorial analysis
A structured set of objections, weighed in public.
Referee Report
Summary. The paper proposes SOLAS, a pipeline that uses the open-source Python ray-tracing library KrakenOS to generate point-spread-function (PSF) grids for an optical doublet and convolves them with synthetic fisheye automotive images from SynWoodscape and Parallel Domain Woodscape, with the goal of introducing realistic optical aberrations into simulation. The authors compare KrakenOS PSFs against Ansys Zemax OpticStudio at three field angles and three wavelengths, reporting an average RMSE of about 0.02, and they measure image sharpness before and after degradation using the ISO 12233 slanted-edge method, reporting that edge and middle regions lose contrast while the center does not. The paper claims that KrakenOS can match industrial ray-tracing performance and that the proposed pipeline introduces spatially varying optical artifacts into fisheye simulations.
Significance. If the central claims were fully supported, the paper would make a useful contribution: an open-source alternative to commercial ray-tracing for automotive simulation, a concrete pipeline for PSF-based degradation of synthetic fisheye data, and a quantitative sharpness evaluation. The external benchmark against Zemax and the use of an independent MTF50 metric are strengths, as is the explicit code-adjacent methodology that enables replication. However, the paper's headline claim of 'realistic optical artifacts' is explicitly contradicted by its own Limitations section, and the restricted scope of the validation (three field angles for a ±2° doublet applied to ~180° fisheye images) means the practical significance for automotive perception is not established. As a proof-of-concept for degrading fisheye simulations with a generic doublet, the pipeline is demonstrated; as a claim of realistic fisheye degradation, it falls short.
major comments (3)
- [Abstract and Limitations] The abstract states the pipeline introduces 'realistic optical artifacts' into fisheye simulations, and the contributions claim a 'novel optical degradation pipeline' with 'realistic' degradations, but the Limitations section explicitly concedes: 'The degradation itself is not realistic because the warped simulation is convolved with a completely different lens.' This is a load-bearing contradiction: the central realism claim is unsupported. The authors should either reframe the contribution as a proof-of-concept for a generic degradation pipeline, or replace the doublet with a fisheye-appropriate lens model and recompute the PSF grids for the actual field angles of the Woodscape MVL images.
- [Table 2 and Section 'Build & Finetune KrakenOS'] The RMSE comparison between KrakenOS and Zemax is reported for only three field angles (0°, −2°, +2°) and three wavelengths, with no description of how the PSFs were normalized, resampled, or aligned before computing RMSE. The statement 'KrakenOS can match industrial performance' is therefore not established by the presented evidence, because a raw RMSE value of 0.02 depends entirely on the PSF normalization convention (e.g., peak value, total energy, or unit-integral scaling) and on the pixel grid alignment. The authors should specify the exact comparison methodology, report RMSE as a function of PSF normalization, and include a figure or table showing the per-pixel difference maps.
- [Methodology steps 3–4 and Figure 5] The load-bearing transfer from the ±2° doublet PSF computation to the fisheye image convolution is physically mismatched: the PSF grid is sampled in object-space field angle for a doublet that is not the Woodscape fisheye lens, while the MVL fisheye images span a much larger angular range under a strongly nonlinear projection. Assigning each image patch a PSF purely by its pixel position therefore has no direct physical correspondence to the angles at which light reached the fisheye camera. The observed center-to-edge MTF50 decrease could be generated by the arbitrary patch-to-PSF mapping rather than by field-dependent aberrations of a real fisheye lens. The authors should either (a) simulate a fisheye lens whose distortion and field map match the Woodscape camera, or (b) clearly label the experiment as a test of the degradation pipeline with a deliberately mismatched lens and discuss how the results would change with a matched lens.
minor comments (5)
- [Methodology step 3] The notation for surface labels in Table 1 (e.g., 'POb j' and 'PI ma') appears to contain word fragments; please replace these with standard abbreviations such as 'Object Plane' and 'Image Plane' for clarity.
- [Figure 2 caption] The caption describes '8 × 8' and '32 × 32' grid sizes, but the text in Methodology step 4 states the images are 1280×960 and the grids are resized to 8×6 and 32×24; please harmonize the caption with the actual grid dimensions.
- [Related Work] The sentence 'An image was chosen of one camera position from both the SynWoodscape [10], and Parallel Domain Woodscape [11] datasets' is grammatically unclear; it should state that one MVL image was selected from each dataset.
- [Section 'Optical Degradations of Fisheye Automotive Simulation'] The qualitative claim that the degraded images show 'coma and astigmatism towards the periphery' is based on visual inspection of Figure 4, but no direct PSF shape analysis at the corresponding image coordinates is provided; adding a panel that overlays the local PSF at a periphery location would strengthen the qualitative argument.
- [Conclusion] The sentence 'The optical doublet, a key lens component of optical systems (including fisheye), can be replaced for more complex optical systems in our pipeline' is ambiguous: it should be clarified whether 'replaced' means 'substituted with' a more complex lens or 'used in place of' one.
Circularity Check
No significant circularity: the KrakenOS-vs-Zemax benchmark is an external implementation comparison and the MTF50 sharpness measurement is an independent metric; the paper's own limitation undermines the realism claim but does not make the derivation circular.
full rationale
The quantitative core of the paper is a side-by-side simulation of the same optical doublet in KrakenOS and Ansys Zemax OpticStudio, with the lens geometry fixed by Table 1. The reported RMSE (~0.02) is a comparison of two independent ray-tracing implementations against an external industrial tool, not a quantity constructed from KrakenOS's own outputs. The MTF50 evaluation uses the ISO 12233 slanted-edge method via the authors' previously published SS-SFR tool, but this self-citation is applied as a measurement instrument, not as a fitted parameter or as the source of the predicted spatial variation; therefore it is not load-bearing. The paper explicitly concedes "The degradation itself is not realistic because the warped simulation is convolved with a completely different lens," which seriously weakens the "realistic optical artifacts" contribution, but that is a validity and generalization limitation, not a circular derivation. No fitted parameter is renamed as a prediction, no uniqueness theorem is imported from the authors' prior work, and no ansatz is smuggled in via citation. The only mild concern is the wording that KrakenOS was "fine-tuned to reflect the optical outputs" of Zemax before the RMSE comparison, which somewhat reduces the strength of the match as an independent validation, but it does not make the central pipeline result equivalent to its inputs by construction.
Assumptions & free parameters
free parameters (3)
- Optical doublet prescription (radii, thicknesses, stop diameter) =
R1=92.847, R2=-30.716, R3=-78.197 mm; thicknesses 6.0, 3.0, 57.376 mm; stop 5.0 mm (Table 1)
- PSF grid size =
8x6 and 32x24
- Field of view range =
+/-2 degrees
assumptions (3)
- domain assumption Convolution with a PSF grid is a valid model of optical image degradation
- ad hoc to paper The fisheye-warped simulation images can be degraded by a non-fisheye doublet PSF to produce a meaningful proof-of-concept
- domain assumption ISO12233 slanted-edge method is applicable to synthetic scenes
Cite this review
Pith. "Pith review of SOLAS: Superpositioning an Optical Lens in Automotive Simulation." pith.science (2026). https://pith.science/paper/JRAHLY6P
@misc{pith2026250117872,
  author       = {Pith},
  title        = {Pith review of: SOLAS: Superpositioning an Optical Lens in Automotive Simulation},
  year         = {2026},
  howpublished = {\url{https://pith.science/paper/JRAHLY6P}},
  note         = {Machine review of arXiv:2501.17872}
}
read the original abstract
Automotive Simulation is a potentially cost-effective strategy to identify and test corner case scenarios in automotive perception. Recent work has shown a significant shift in creating realistic synthetic data for road traffic scenarios using a video graphics engine. However, a gap exists in modeling realistic optical aberrations associated with cameras in automotive simulation. This paper builds on the concept from existing literature to model optical degradations in simulated environments using the Python-based ray-tracing library KrakenOS. As a novel pipeline, we degrade automotive fisheye simulation using an optical doublet with +/-2 deg Field of View (FOV), introducing realistic optical artifacts into two simulation images from SynWoodscape and Parallel Domain Woodscape. We evaluate KrakenOS by calculating the Root Mean Square Error (RMSE), which averaged around 0.023 across the RGB light spectrum compared to Ansys Zemax OpticStudio, an industrial benchmark for optical design and simulation. Lastly, we measure the image sharpness of the degraded simulation using the ISO12233:2023 Slanted Edge Method and show how both qualitative and measured results indicate the extent of the spatial variation in image sharpness from the periphery to the center of the degradations.
Figures


Figures from the paper (2 more)


Reference graph
Works this paper leans on
-
[1]
Surround-view fisheye optics in computer vision and simulation: Survey and challenges,
D. Jakab, B. M. Deegan, S. Sharma, E. M. Grua, J. Horgan, E. Ward, P. v. d. Ven, A. Scanlan, and C. Eising, “Surround-view fisheye optics in computer vision and simulation: Survey and challenges,” (a) (b) Figure 5: Mean MTF50 measurement using the SS-SFR technique where (a) depicts the SS-SFR categorization using radial annuli and (b) the MTF measurements...
work page 2024
-
[2]
Image quality is not all you want: Task-driven lens design for image classification,
X. Yang, Q. Fu, Y . Nie, and W. Heidrich, “Image quality is not all you want: Task-driven lens design for image classification,” arXiv preprint arXiv:2305.17185, 2023
arXiv 2023
-
[3]
Aberration-aware depth-from-focus,
X. Yang, Q. Fu, M. Elhoseiny, and W. Heidrich, “Aberration-aware depth-from-focus,” IEEE Transactions on Pattern Analysis and Ma- chine Intelligence, 2023
work page 2023
-
[4]
Realistic Image Degradation with Measured PSF
C. Wittpahl, H. B. Zakour, M. Lehmann, and A. Braun, “Realistic image degradation with measured psf,” 2 2018. [Online]. Available: http://arxiv.org/abs/1801.02197
work page Pith review arXiv 2018
-
[5]
Resolution and accuracy of non-linear regression of psf with artificial neural networks,
M. Lehmann, C. Wittpahl, H. B. Zakour, and A. Braun, “Resolution and accuracy of non-linear regression of psf with artificial neural networks,” in Optical Instrument Science, Technology, and Applica- tions, vol. 10695. SPIE, 2018, pp. 52–63
work page 2018
-
[6]
High-quality computational imaging through simple lenses,
F. Heide, M. Rouf, M. B. Hullin, B. Labitzke, W. Heidrich, and A. Kolb, “High-quality computational imaging through simple lenses,” ACM Transactions on Graphics (ToG) , vol. 32, no. 5, pp. 1–14, 2013
work page 2013
-
[7]
Measuring natural scenes sfr of automotive fisheye cameras,
D. Jakab, E. M. Grua, B. M. Deegan, A. Scanlan, P. Van De Ven, and C. Eising, “Measuring natural scenes sfr of automotive fisheye cameras,” Electronic Imaging, vol. 36, pp. 1–6, 2024
work page 2024
-
[8]
Krakenos: Python-based general exact ray trac- ing library,
J. Herrera, C. A. Guerrero, M. R. Najera, A. Sotelo-Burke, and I. Plauchu-Frayn, “Krakenos: Python-based general exact ray trac- ing library,” Optical Engineering , vol. 61, no. 1, pp. 015 101– 015 101, 2022
work page 2022
Show all 17 references
-
[9]
Ansys zemax opticstudio comprehensive optical design software,
“Ansys zemax opticstudio comprehensive optical design software,” https://www.ansys.com/products/optics/ansys-zemax-opticstudio, 2024, accessed: 2024-12-12
2024
-
[10]
Synwoodscape: Synthetic surround-view fisheye camera dataset for autonomous driving,
A. R. Sekkat, Y . Dupuis, V . R. Kumar, H. Rashed, S. Yoga- mani, P. Vasseur, and P. Honeine, “Synwoodscape: Synthetic surround-view fisheye camera dataset for autonomous driving,” IEEE Robotics and Automation Letters, vol. 7, no. 3, pp. 8502–8509, 2022
2022
-
[11]
Parallel domain synthetic data for the woodscape challenge 2023,
“Parallel domain synthetic data for the woodscape challenge 2023,” https://paralleldomain.com/open-datasets/woodscape-challenge, 2023, accessed: 2024-07-12
2023
-
[12]
B. S. Institute, BS ISO 12233:2023 Photography - Electronic still picture imaging - Resolution and spatial frequency responses. BSI Standards Publication, 2023
2023
-
[13]
Near-field perception for low-speed vehicle automation using surround-view fisheye cam- eras,
C. Eising, J. Horgan, and S. Yogamani, “Near-field perception for low-speed vehicle automation using surround-view fisheye cam- eras,” IEEE Transactions on Intelligent Transportation Systems , 2022
2022
-
[14]
Woodscape: A multi-task, multi-camera fisheye dataset for au- tonomous driving,
S. Yogamani, C. Witt, H. Rashed, S. Nayak, S. Mansoor, P. Varley, X. Perrotton, D. Odea, P. Perez, C. Hughes, J. Horgan, G. Sistu, S. Chennupati, M. Uricar, S. Milz, M. Simon, and K. Amende, “Woodscape: A multi-task, multi-camera fisheye dataset for au- tonomous driving,” vol....
2019
-
[15]
Deep optics for monocular depth esti- mation and 3d object detection,
J. Chang and G. Wetzstein, “Deep optics for monocular depth esti- mation and 3d object detection,” in Proceedings of the IEEE/CVF International Conference on Computer Vision , 2019, pp. 10 193– 10 202
2019
-
[16]
A tool for deriving camera spatial frequency response from natural scenes (ns- sfr),
O. Van Zwanenberg, S. Triantaphillidou, and R. Jenkin, “A tool for deriving camera spatial frequency response from natural scenes (ns- sfr),” Electronic Imaging 2023: Image Quality & System Perfor- mance XX, 2023
2023
-
[17]
Ss-sfr: Synthetic scenes spatial frequency response on virtual kitti and degraded au- tomotive simulations for object detection,
D. Jakab, A. Braun, C. Agnew, R. Mohandas, B. M. Deegan, D. Molloy, E. Ward, T. Scanlan, and C. Eising, “Ss-sfr: Synthetic scenes spatial frequency response on virtual kitti and degraded au- tomotive simulations for object detection,” inthe Proceedings of the Irish Machine Vis...
2024
Reviewed August 10, 2026 · model on record in the stance chip above.
Discussion (0). Continue with ORCID to comment.