REVIEW 3 major objections 4 minor 66 references
Learning Universal Multi-level Market Irrationality Factors to Improve Stock Return Forecasting
T0 review · 3 major / 4 minor · reviewed 2026-08-08 · deepseek-v4-flash
Pith's one-line read The paper claims that learnable stock-level and market-level irrationality factors, extracted self-supervised from price data, improve stock return forecasting on US and Chinese markets and transfer as inputs to other forecasting models.
desk verdict UMI deserves serious referee time: the factor construction is new and the reported gains are plausible, but the 'irrationality' interpretation rests on a stationarity constraint that is never validated out of sample. read the letter →
The pith
A machine-rendered reading of the paper's core claim, the machinery that carries it, and where it could break.
The reading
What carries the argument
The load-bearing object is the cointegration attention: for each stock $i$, candidate rational prices $\tilde p_t^{(i)}(j) = \beta_{ij} p_t^{(j)}$ from all other stocks are combined with learned attention weights $\mathrm{ATT}_{ij}$ into a virtual rational price $\tilde p_t^{(i)}(\Sigma)$. A regression loss minimizes the squared gap to the actual price while a stationary regularization forces the autoregressive coefficient $\rho^{(i)}$ of $u_t^{(i)} = \tilde p_t^{(i)}(\Sigma) - p_t^{(i)}$ to satisfy $|\rho^{(i)}| < 1$, so that $u_t$ is a stationary 'soft cointegrated' residual; this residual is the stock-level factor. The market-level machinery builds dynamic stock representations, weights them by stock-ID-dependent weights $\eta_t^{(i)}$ into a market representation $\boldsymbol m_t$, and trains it with InfoNCE sub-market comparative learning plus a cross-entropy market synchronism prediction task. The forecasting model then concatenates the stock factor, the Transformer-encoded history, the graph-attention relation representation, and $\boldsymbol m_t$, and is optimized with MSE plus a RankIC loss.
What would settle it
Freeze the cointegration-attention parameters after training and apply them to unseen stocks and periods; if the resulting $u_t$ series is not stationary (its estimated $\rho$ approaches or exceeds 1) or if buying stocks with low $u_t$ and selling those with high $u_t$ does not produce out-of-sample reversals, the irrationality interpretation of the factor collapses.
Extended reading notes
Core claim
UMI's central discovery is that the discrepancy $u_t^{(i)} = \tilde p_t^{(i)}(\Sigma) - p_t^{(i)}$ between a stock's actual price and a cointegrated 'rational' price constructed from other stocks' prices 'serves as a factor to indicate stock-level irrational events' (Sec. 3.2), and that the market representation $\boldsymbol m_t$, pushed by sub-market comparative learning and market synchronism prediction to encode anomalous synchronous fluctuations, 'is incorporated with the information of market-level irrationality' (Sec. 4.2.2). Fed into a Transformer plus graph-attention forecaster trained with a RankIC loss, these factors produce the best reported results on US (IC 0.057, Sharpe 2.007) and Chinese (IC 0.078, Sharpe 2.680) markets, and adding the same factors to DoubleAdapt, D-Va and Co-CPC improves those baselines' investment metrics, which the paper calls their universality.
Load-bearing premise
The load-bearing premise is that a stock's rational price can be learned as a weighted combination of the other stocks' contemporaneous prices, so the gap between actual and estimated price is a meaningful measure of mispricing rather than a fitted regression residual.
Editorial extensions
If this is right
- Appending the extracted factors to DoubleAdapt, D-Va, and Co-CPC improves their annualized returns and Sharpe ratios on both US and Chinese markets, so the factors transfer as model-agnostic inputs.
- Because the factors are trained self-supervised before the forecasting stage, they can be learned on one market and tuned on another: the cross-market variant UMI+CM outperforms the same-market UMI in the reported experiments.
- The RankIC loss makes the model's rank accuracy (IC, RankIC) improve more than its point accuracy (RMSE, MAE), which matters for long-short ranking strategies.
- The stock-level factor is more valuable than the market-level factor in the ablations, since it carries stock-specific rather than uniform information.
Reading between the lines
- A testable implication the paper leaves implicit: if $u_t$ really tracks mispricing, its sign should forecast subsequent return reversals after controlling for known anomalies such as size, liquidity, and short-term reversal; the paper does not run this controls check.
- The rational-price premise could break in markets with few liquid peers or with common factor exposure dominating the cross-section, so the same method may need a smaller or factor-residualized proxy set; this is an extension, not a claim of the paper.
- The market-synchronism definition depends on a threshold, and one could make the label continuous rather than three-class to test whether the factor's predictive gain is robust to the discretization.
- Because the paper reports that daily Sharpe improvements compound into large cumulative-wealth differences, the practical consequence for investors is that small out-of-sample IC gains are economically meaningful; this is an interpolation of their cumulative-wealth figure, not a separate result.
Editorial analysis
A structured set of objections, weighed in public.
Referee Report
Summary. The paper proposes UMI, a factor-learning framework for stock return forecasting that extracts two types of irrationality factors. A stock-level factor u_t is defined as the difference between the actual price and an estimated rational price, where the rational price is an attention-weighted combination of contemporaneous prices of other stocks and is trained with an MSE loss plus an AR(1) stationarity penalty. A market-level factor is learned from market representations via sub-market contrastive learning and a market-synchronism prediction task. These factors are then appended to a Transformer plus graph-attention forecasting model trained with MSE and RankIC losses. Experiments on US and Chinese markets report consistent improvements over seven baselines, and the authors show that the factors can be appended to three existing forecasters to improve their investment performance.
Significance. If the construction can be validated, UMI would be a useful contribution: the two-level factor design is clearly formulated, the ablation isolates the contribution of each module, the cross-market transfer experiment is a nice addition, and the authors provide a code link. The self-supervised framing of market irrationality is also a reasonable way to inject domain knowledge into forecasting models. However, the central interpretational claim that u_t measures stock-level irrationality rests on an out-of-sample stationarity property that is never tested, and the headline empirical gains are reported without error bars or significance tests. As presented, the contribution is a potentially interesting framework whose main claims are not yet fully supported.
major comments (3)
- [3.2, Equations (11)-(14)] The cointegration property is load-bearing but is only enforced in-sample. Equation (13) fits an AR(1) model to u_t and constrains |rho_i| < 1, while Equation (11) simultaneously shrinks the residual toward zero; neither operation is a cointegration test. Near-unit-root OLS estimates of rho are biased downward, so the constraint can be satisfied even when u_t is a random walk. The paper reports no out-of-sample ADF or KPSS tests on the test-period residuals, no distribution of the fitted rho_i values, and no stability check of the learned B and W_C matrices across the 30-day rolling retraining windows. Please add these tests. If the residual is non-stationary on the test set, the interpretation of u_t as a rational-price deviation is unsupported, and using u_t as an input to the Transformer in Equation (25) could create spurious predictive gains.
- [6.2, Table 1] The headline comparisons are reported as averages over five runs with no standard deviations, confidence intervals, or significance tests. For the forecasting metrics the gains are small (e.g., RMSE improvements of about 1.1% and IC improvements of 6-10% on the US market), so the claim that UMI beats all baselines is not statistically supported as reported. Please provide per-run standard deviations and perform paired significance tests across the five runs, or otherwise quantify run-to-run variability. The same issue affects the ablation columns in Table 1 and the universality results in Table 2.
- [6.2, Table 2] The universality claim that appending UMI factors improves DoubleAdapt, D-Va, and Co-CPC is sensitive to implementation details that are not documented: whether the baselines' hyperparameters were re-tuned after adding the factors, whether the factors are re-extracted on each rolling retraining window, and how each baseline architecture incorporates the extra inputs. Without this information and without error bars, the reported Sharpe-ratio improvements (e.g., 10-38% on the US market) cannot be cleanly attributed to the factors rather than to the additional model capacity or re-tuning. Please clarify the protocol and report the baseline performance under the same retraining schedule.
minor comments (4)
- [3.2, Equation (14)] The constraint |rho_i| < 1 is stated but the implementation is not described; please specify whether it is enforced by reparameterization, projection, or a penalty term, since this affects reproducibility and the interpretation of the stationary regularization.
- [4.1, Equation (15)] The market synchronism threshold H_m is a free parameter, but no sensitivity analysis is reported for it. Please add a robustness check or state how the value was chosen.
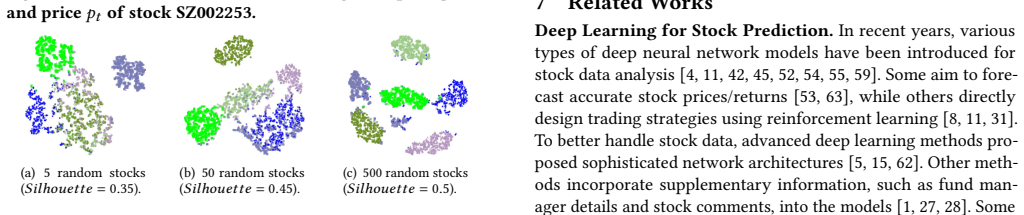
- [6.3, Figure 4] The silhouette scores are reported for t-SNE visualizations of six trading days, but it is unclear whether the silhouette is computed on the original market representations or on the t-SNE embedding. Please clarify; a quantitative evaluation of cluster separability on the original representation space would strengthen this exploratory analysis.
- [5, after Equation (29)] There is a typo: 'RandIC regularization' should read 'RankIC regularization'. Similar minor wording issues appear in Section 4.2.2 ('incorperated') and in the abstract ('UMI construct').
Circularity Check
Stock-level irrationality factor is a fitted residual by construction, but forecasting gains are independently benchmarked.
-
self definitional
[Sec. 3.2, Eqs. (10)-(11) and the paragraph after Eq. (14)]
"Thus, we use a mean square error (MSE) loss to minimize the regression error as Lβ = 1/(T×I) Σ (p_t^(i) − p~_t^(i)(Σ))^2 (11) ... Finally, we use u_t^(i) = p~_t^(i)(Σ) − p_t^(i) as the stock-level irrationality factor to indicate local irrational events for the stock s_i in the period t."
The 'rational price' p~_t(Σ) is fit by minimizing the squared distance to the actual price p_t (Eq. 11), and the 'irrationality factor' u_t is defined as exactly that minimized residual (Eq. 10). Therefore the claim that u_t indicates irrational events is a restatement of the fitting objective: an 'irrational event' is, by Definition 4, a large deviation from the rational price, and the rational price is constructed to minimize those deviations. No independent notion of rational price or irrationality is derived. However, the paper's forecasting improvement is not circular: u_t is used as an input feature and evaluated against external baselines and ablations, so the empirical contribution stands independently of the semantic label.
full rationale
The only significant definitional circularity is in the stock-level factor: the rational price is a learnable convex combination of other stocks' prices trained to minimize the squared gap to the actual price, so the residual u_t is a fitted regression error. Calling this residual an 'irrationality factor' is a semantic choice rather than an empirically derived first-principles result. The market-level factor is trained with self-supervised tasks (sub-market comparative learning and synchronism prediction) whose labels are directly defined from synchronous fluctuations; this is a supervised self-labeling procedure, not a circular derivation. The paper does not rely on load-bearing self-citations, imported uniqueness theorems, or ansatz smuggling. The central claim that UMI improves stock return forecasting is tested against seven baselines on US and CN data, with ablations and a universality experiment appending factors to other models; those results are external to the factor definitions and are not forced by construction. The stationarity/cointegration enforcement via the |ρ|<1 constraint is a validation concern rather than a circularity, because it is an in-sample optimization target rather than an out-of-sample test. Overall, the empirical forecasting claim is independently supported, so the circularity score is low.
Assumptions & free parameters
free parameters (4)
- Cointegration attention weights β_ij and attention scores w_ij =
Learned on training data
- AR(1) stationarity coefficients ρ_i =
Learned with constraint |ρ_i| < 1
- Market synchronism threshold H_m =
Not specified in text
- Loss balancing hyperparameters λ1, λ2, λ3 =
Not reported for final model; sensitivity shown in Figs. 5-7
assumptions (4)
- ad hoc to paper There exists a latent rational price for each stock that can be expressed as a weighted linear combination of contemporaneous prices of other stocks.
- domain assumption Price discrepancies u_t that are stationary in the AR(1) sense are mean-reverting mispricing signals.
- ad hoc to paper Anomalous synchronous fluctuations across stocks indicate market-level irrationality, and can be captured by sub-market contrastive learning and synchronism prediction.
- standard math An AR(1) process with |ρ|<1 is a sufficient stationarity condition for the purposes of cointegration.
invented entities (2)
-
Estimated rational price p~_t(Σ)
-
Market-level irrationality factor m_t
Cite this review
Pith. "Pith review of Learning Universal Multi-level Market Irrationality Factors to Improve Stock Return Forecasting." pith.science (2026). https://pith.science/paper/JUEVEO6J
@misc{pith2026250204737,
  author       = {Pith},
  title        = {Pith review of: Learning Universal Multi-level Market Irrationality Factors to Improve Stock Return Forecasting},
  year         = {2026},
  howpublished = {\url{https://pith.science/paper/JUEVEO6J}},
  note         = {Machine review of arXiv:2502.04737}
}
read the original abstract
Recent years have witnessed the perfect encounter of deep learning and quantitative trading has achieved great success in stock investment. Numerous deep learning-based models have been developed for forecasting stock returns, leveraging the powerful representation capabilities of neural networks to identify patterns and factors influencing stock prices. These models can effectively capture general patterns in the market, such as stock price trends, volume-price relationships, and time variations. However, the impact of special irrationality factors -- such as market sentiment, speculative behavior, market manipulation, and psychological biases -- have not been fully considered in existing deep stock forecasting models due to their relative abstraction as well as lack of explicit labels and data description. To fill this gap, we propose UMI, a Universal multi-level Market Irrationality factor model to enhance stock return forecasting. The UMI model learns factors that can reflect irrational behaviors in market from both individual stock and overall market levels. For the stock-level, UMI construct an estimated rational price for each stock, which is cointegrated with the stock's actual price. The discrepancy between the actual and the rational prices serves as a factor to indicate stock-level irrational events. Additionally, we define market-level irrational behaviors as anomalous synchronous fluctuations of stocks within a market. Using two self-supervised representation learning tasks, i.e., sub-market comparative learning and market synchronism prediction, the UMI model incorporates market-level irrationalities into a market representation vector, which is then used as the market-level irrationality factor.
Figures


Figures from the paper (4 more)


Reference graph
Works this paper leans on
-
[1]
Chi Chen, Li Zhao, Jiang Bian, Chunxiao Xing, and Tie-Yan Liu. [n. d.]. Investment behaviors can tell what inside: Exploring stock intrinsic properties for stock trend prediction
-
[2]
Son-Nan Chen. 1982. An examination of risk-return relationship in bull and bear markets using time-varying betas. Journal of Financial and Quantitative Analysis 17, 2 (1982), 265–286
work page 1982
-
[3]
Rui Cheng and Qing Li. 2021. Modeling the momentum spillover effect for stock prediction via attribute-driven graph attention networks. In AAAI’21, Vol. 35. 55–62
work page 2021
-
[4]
Qianggang Ding, Sifan Wu, Hao Sun, Jiadong Guo, and Jian Guo. 2020. Hier- archical multi-scale gaussian transformer for stock movement prediction. In Proceedings of the 29th International Joint Conference on Artificial Intelligence . 4640–4646
work page 2020
-
[5]
Yi Ding, Weiqing Liu, Jiang Bian, Daoqiang Zhang, and Tie-Yan Liu. [n. d.]. Investor-imitator: A framework for trading knowledge extraction
-
[6]
Jiaxiang Dong, Haixu Wu, Haoran Zhang, Li Zhang, Jianmin Wang, and Ming- sheng Long. 2023. SimMTM: A simple pre-training framework for masked time-series modeling. In NeurIPS’23
work page 2023
-
[7]
Robert F Engle and Clive WJ Granger. 1987. Co-integration and error correction: Representation, estimation, and testing. Econometrica 55, 2 (1987), 251–276
work page 1987
-
[8]
Siyu Gao, Yunbo Wang, and Xiaokang Yang. 2023. Stockformer: Learning hybrid trading machines with predictive coding. In Proceedings of the 32nd International Joint Conference on Artificial Intelligence . 4766–4774
work page 2023
Show all 66 references
-
[9]
Alberto Giovannini and Philippe Jorion. 1989. The time variation of risk and return in the foreign exchange and stock markets. The Journal of Finance 44, 2 (1989), 307–325
1989
-
[10]
Suiming Guo, Qianrong Shen, Zhiquan Liu, Chao Chen, Chaoxiong Chen, Jingyuan Wang, Zhetao Li, and Ke Xu. 2023. Seeking Based on Dynamic Prices: Higher Earnings and Better Strategies in Ride-on-Demand Services. IEEE Trans- actions on Intelligent Transportation Systems (2023), 1–16
2023
-
[11]
Li Han, Nan Ding, Guoxuan Wang, Dawei Cheng, and Yuqi Liang. [n. d.]. Efficient continuous space policy optimization for high-frequency trading
-
[12]
Kethmi Hirushini Hettige, Jiahao Ji, Shili Xiang, Cheng Long, Gao Cong, and Jingyuan Wang. 2024. AirPhyNet: Harnessing Physics-Guided Neural Networks for Air Quality Prediction. In Proceedings of the Twelfth International Conference on Learning Representations
2024
-
[13]
Geoffrey E Hinton and Sam Roweis. 2002. Stochastic neighbor embedding. In NeurIPS’02, Vol. 15
2002
-
[14]
Min Hou, Chang Xu, Yang Liu, Weiqing Liu, Jiang Bian, Le Wu, Zhi Li, Enhong Chen, and Tie-Yan Liu. 2021. Stock trend prediction with multi-granularity data: A contrastive learning approach with adaptive fusion. In Proceedings of the 30th ACM International Conference on Informa...
2021
-
[15]
Kentaro Imajo, Kentaro Minami, Katsuya Ito, and Kei Nakagawa. 2021. Deep portfolio optimization via distributional prediction of residual factors. InAAAI’21, Vol. 35. 213–222
2021
-
[16]
Serkan Imisiker and Bedri Kamil Onur Tas. 2018. Wash trades as a stock market manipulation tool. Journal of Behavioral and Experimental Finance 20 (2018), 92–98
2018
-
[17]
Narasimhan Jegadeesh and Sheridan Titman. 1993. Returns to buying winners and selling losers: Implications for stock market efficiency.The Journal of Finance 48, 1 (1993), 65–91
1993
-
[18]
Jiahao Ji, Jingyuan Wang, Chao Huang, Junjie Wu, Boren Xu, Zhenhe Wu, Junbo Zhang, and Yu Zheng. 2023. Spatio-Temporal Self-Supervised Learning for Traffic Flow Prediction. In AAAI’23
2023
-
[19]
Jiahao Ji, Jingyuan Wang, Zhe Jiang, Jiawei Jiang, and Hu Zhang. 2022. STDEN: Towards physics-guided neural networks for traffic flow prediction. In AAAI’22, Vol. 36. 4048–4056
2022
-
[20]
Jiahao Ji, Jingyuan Wang, Zhe Jiang, Jingtian Ma, and Hu Zhang. 2020. Inter- pretable spatiotemporal deep learning model for traffic flow prediction based on potential energy fields. In ICDM’20. IEEE, 1076–1081
2020
-
[21]
Jiawei Jiang, Chengkai Han, Wayne Xin Zhao, and Jingyuan Wang. 2023. PDFormer: Propagation Delay-aware Dynamic Long-range Transformer for Traf- fic Flow Prediction. In AAAI’23
2023
-
[22]
Wenjun Jiang, Wayne Xin Zhao, Jingyuan Wang, and Jiawei Jiang. 2023. Contin- uous Trajectory Generation Based on Two-Stage GAN. In AAAI. AAAI Press
2023
-
[23]
Charles P Jones and Robert H Litzenberger. 1970. Quarterly earnings reports and intermediate stock price trends. The Journal of Finance 25, 1 (1970), 143–148
1970
-
[24]
Kelvin JL Koa, Yunshan Ma, Ritchie Ng, and Tat-Seng Chua. 2023. Diffusion variational autoencoder for tackling stochasticity in multi-step regression stock price prediction. In Proceedings of the 32nd ACM International Conference on Information and Knowledge Management . 1087–1096
2023
-
[25]
Charles MC Lee and Bhaskaran Swaminathan. 2000. Price momentum and trading volume. The Journal of Finance 55, 5 (2000), 2017–2069
2000
-
[26]
Chang Li, Dongjin Song, and Dacheng Tao. 2019. Multi-task recurrent neural networks and higher-order Markov random fields for stock price movement prediction: Multi-task RNN and higer-order MRFs for stock price classification. In Proceedings of the 25th ACM SIGKDD Internationa...
2019
-
[27]
Shuqi Li, Weiheng Liao, Yuhan Chen, and Rui Yan. 2023. PEN: prediction- explanation network to forecast stock price movement with better explainability. In AAAI‘23, Vol. 37. 5187–5194
2023
-
[28]
Zhige Li, Derek Yang, Li Zhao, Jiang Bian, Tao Qin, and Tie-Yan Liu. [n. d.]. Individualized indicator for all: Stock-wise technical indicator optimization with stock embedding
-
[29]
Yun-Hsuan Lien, Yuan-Kui Li, and Yu-Shuen Wang. 2023. Contrastive learning and reward smoothing for deep portfolio management. In Proceedings of the 32nd International Joint Conference on Artificial Intelligence . 3966–3974
2023
-
[30]
Hengxu Lin, Dong Zhou, Weiqing Liu, and Jiang Bian. [n. d.]. Learning multiple stock trading patterns with temporal routing adaptor and optimal transport
-
[31]
Yang Liu, Qi Liu, Hongke Zhao, Zhen Pan, and Chuanren Liu. 2020. Adaptive quantitative trading: An imitative deep reinforcement learning approach. In AAAI’20, Vol. 34. 2128–2135
2020
-
[32]
Zhiding Liu, Mingyue Cheng, Zhi Li, Zhenya Huang, Qi Liu, Yanhu Xie, and Enhong Chen. 2023. Adaptive normalization for non-stationary time series forecasting: A temporal slice perspective. In NeurIPS’23
2023
-
[33]
Zehua Liu, Zimeng Li, Jingyuan Wang, and Yue He. 2024. Full Bayesian Signifi- cance Testing for Neural Networks. In AAAI’24, Vol. 38. 8841–8849
2024
-
[34]
Zelin Ni, Hang Yu, Shizhan Liu, Jianguo Li, and Weiyao Lin. 2023. BasisFormer: Attention-based time series forecasting with learnable and interpretable basis. In NeurIPS’23
2023
-
[35]
Aaron van den Oord, Yazhe Li, and Oriol Vinyals. 2018. Representation learning with contrastive predictive coding. ArXiv Preprint ArXiv:1807.03748 (2018)
2018 arXiv
-
[36]
James M Poterba and Lawrence H Summers. 1988. Mean reversion in stock prices: Evidence and implications. Journal of Financial Economics 22, 1 (1988), 27–59
1988
-
[37]
Houxing Ren, Jingyuan Wang, and Wayne Xin Zhao. 2022. Generative Adversar- ial Networks Enhanced Pre-training for Insufficient Electronic Health Records Modeling. In KDD’22. 3810–3818
2022
-
[38]
Houxing Ren, Jingyuan Wang, Wayne Xin Zhao, and Ning Wu. 2021. Rapt: Pre- training of time-aware transformer for learning robust healthcare representation. In KDD’21. 3503–3511
2021
-
[39]
Peter J Rousseeuw. 1987. Silhouettes: a graphical aid to the interpretation and validation of cluster analysis. J. Comput. Appl. Math. 20 (1987), 53–65
1987
-
[40]
Robert J Shiller. 2015. Irrational exuberance: Revised and expanded third edition. In Irrational Exuberance. Princeton university press
2015
-
[41]
Paul Slovic. 1972. Psychological study of human judgment: Implications for investment decision making. The Journal of Finance 27, 4 (1972), 779–799
1972
-
[42]
Shuo Sun, Xinrun Wang, Wanqi Xue, Xiaoxuan Lou, and Bo An. [n. d.]. Mastering stock markets with efficient mixture of diversified trading Experts
-
[43]
Paul C Tetlock. 2007. Giving content to investor sentiment: The role of media in the stock market. The Journal of Finance 62, 3 (2007), 1139–1168
2007
-
[44]
Guifeng Wang, Longbing Cao, Hongke Zhao, Qi Liu, and Enhong Chen. 2021. Coupling macro-sector-micro financial indicators for learning stock representa- tions with less uncertainty. In AAAI’21, Vol. 35. 4418–4426
2021
-
[45]
Heyuan Wang, Tengjiao Wang, Shun Li, Jiayi Zheng, Shijie Guan, and Wei Chen
-
[46]
Jingyuan Wang, Qian Gu, Junjie Wu, Guannan Liu, and Zhang Xiong. 2016. Traffic speed prediction and congestion source exploration: A deep learning method. In ICDM’16. IEEE, 499–508
2016
-
[47]
Jingyuan Wang, Jiahao Ji, Zhe Jiang, and Leilei Sun. 2022. Traffic Flow Prediction Based on Spatiotemporal Potential Energy Fields. TKDE (2022)
2022
-
[48]
Jingyuan Wang, Xiaoda Wang, Chao Li, Junjie Wu, et al . 2020. Deep Fuzzy Cognitive Maps for Interpretable Multivariate Time Series Prediction. TFS (2020), 1–14
2020
-
[49]
Jingyuan Wang, Ze Wang, Jianfeng Li, and Junjie Wu. 2018. Multilevel wavelet decomposition network for interpretable time series analysis. In KDD’18. 2437– 2446
2018
-
[50]
Jingyuan Wang, Yang Zhang, Ke Tang, Junjie Wu, and Zhang Xiong. [n. d.]. Alphastock: A buying-winners-and-selling-losers investment strategy using in- terpretable deep reinforcement attention networks
-
[51]
Zhicheng Wang, Biwei Huang, Shikui Tu, Kun Zhang, and Lei Xu. 2021. Deep- Trader: A deep reinforcement learning approach for risk-return balanced portfolio management with market conditions Embedding. In AAAI’21, Vol. 35. 643–650
2021
-
[52]
Ke Xu, Yifan Zhang, Deheng Ye, Peilin Zhao, and Mingkui Tan. 2020. Relation- aware transformer for portfolio policy learning. In Proceedings of the 29th Inter- national Joint Conference on Artificial Intelligence . 4647–4653
2020
-
[53]
Wentao Xu, Weiqing Liu, Chang Xu, Jiang Bian, Jian Yin, and Tie-Yan Liu. 2021. Rest: Relational event-driven stock trend forecasting. In Proceedings of The Web Conference 2021. 1–10
2021
-
[54]
Linyi Yang, Jiazheng Li, Ruihai Dong, Yue Zhang, and Barry Smyth. 2022. NumHTML: Numeric-oriented hierarchical transformer model for multi-task financial forecasting. In AAAI‘22, Vol. 36. 11604–11612. Learning Universal Multi-level Market Irrationality Factors to Improve Stock...
2022
-
[55]
Mengyuan Yang, Xiaolin Zheng, Qianqiao Liang, Bing Han, and Mengying Zhu
-
[56]
Xiao Yang, Weiqing Liu, Dong Zhou, Jiang Bian, and Tie-Yan Liu. 2020. Qlib: An ai-oriented quantitative investment platform. ArXiv Preprint ArXiv:2009.11189 (2020)
2020 arXiv
-
[57]
In Proceedings of the 31st International Joint Conference on Artificial Intelligence
A smart trader for portfolio management based on normalizing flows. In Proceedings of the 31st International Joint Conference on Artificial Intelligence
-
[58]
Jaemin Yoo, Yejun Soun, Yong-chan Park, and U Kang. 2021. Accurate multivariate stock movement prediction via data-axis transformer with multi-level contexts. In Proceedings of the 27th ACM SIGKDD International Conference on Knowledge Discovery & Data Mining . 2037–2045
2021
-
[59]
Kun Yi, Qi Zhang, Wei Fan, Shoujin Wang, Pengyang Wang, Hui He, Ning An, Defu Lian, Longbing Cao, and Zhendong Niu. 2023. Frequency-domain MLPs are more effective learners in time series forecasting. In NeurIPS’23
2023
-
[60]
J. Wang Z. Liu, Z. Li and Y. He. 2024. Full Bayesian Significance Testing for Neural Networks in Traffic Forecasting. In Proceedings of the 33rd International Joint Conference on Artificial Intelligence
2024
-
[61]
Shuo Yu, Hongyan Xue, Xiang Ao, Feiyang Pan, Jia He, Dandan Tu, and Qing He. [n. d.]. Generating synergistic formulaic alpha collections via reinforcement learning
-
[62]
Dawei Zhou, Lecheng Zheng, Yada Zhu, Jianbo Li, and Jingrui He. 2020. Domain adaptive multi-modality neural attention network for financial forecasting. In Proceedings of the Web Conference 2020 . 2230–2240
2020
-
[63]
Lifan Zhao, Shuming Kong, and Yanyan Shen. 2023. DoubleAdapt: A meta- learning approach to incremental learning for stock trend forecasting. InProceed- ings of the 29th ACM SIGKDD International Conference on Knowledge Discovery & Data Mining. 3492–3503
2023
-
[65]
Haoren Zhu, Shih-Yang Liu, Pengfei Zhao, Yingying Chen, and Dik Lun Lee
-
[66]
In AAAI’22, Vol
Forecasting asset dependencies to reduce portfolio risk. In AAAI’22, Vol. 36. 4397–4404. A Supplemental Materials A.1 Hedging Investment Strategy We adopt a long-short hedging strategy as the backbone investment strategy for our forecasting model. We first give the concept of ...
2025
-
[2022]
In Proceedings of the 31st International Joint Conference on Artificial Intelligence
Adaptive long-short pattern transformer for stock investment selection. In Proceedings of the 31st International Joint Conference on Artificial Intelligence . 3970–3977
Reviewed August 8, 2026 · model on record in the stance chip above.
Discussion (0). Continue with ORCID to comment.