REVIEW 4 major objections 5 minor 46 references
Nanoscale Mapping of Magnetic Orientations with Complex X-ray Magnetic Linear Dichroism
T0 review · 4 major / 5 minor · reviewed 2026-08-08 · deepseek-v4-flash
Pith's one-line read Phase of X-ray magnetic linear dichroism, recovered by ptychography, images magnetic domains with roughly 2.6 times the contrast and up to 43 percent higher signal-to-noise than absorption alone.
desk verdict Phase XMLD spectro-ptychography looks like a real step forward, but the phase-superiority claim needs one clean control before publication. read the letter →
The pith
A machine-rendered reading of the paper's core claim, the machinery that carries it, and where it could break.
The reading
What carries the argument
The central identity is the resonant magnetic scattering factor $f(E,r)$ whose linear dichroism term, $f_m^{(2)}(E)(\boldsymbol{\epsilon}_f^* \cdot \mathbf{m})(\boldsymbol{\epsilon}_i \cdot \mathbf{m})$, splits into an imaginary part proportional to absorption XMLD and a real part proportional to phase XMLD. The method subtracts normalized LHP and LVP ptychographic reconstructions to isolate these: amplitude XMLD $\propto \Im[f_m^{(2)}](m_x^2 - m_y^2)$ and phase XMLD $\propto \Re[f_m^{(2)}](m_x^2 - m_y^2)$. Ptychographic phase retrieval recovers both amplitude and phase of the transmission function at each energy, and a correlation-based hierarchical clustering algorithm (distance $1 - C$ between single-pixel spectra) segments domains with no prior knowledge.
What would settle it
A measurement on a lithographically identical but non-magnetic structure, taken with the same LHP/LVP spectro-ptychography pipeline, would falsify the claim if it produced a phase difference resembling the magnetic domain pattern; conversely, the claim would be supported if the non-magnetic phase difference is flat noise.
Extended reading notes
Core claim
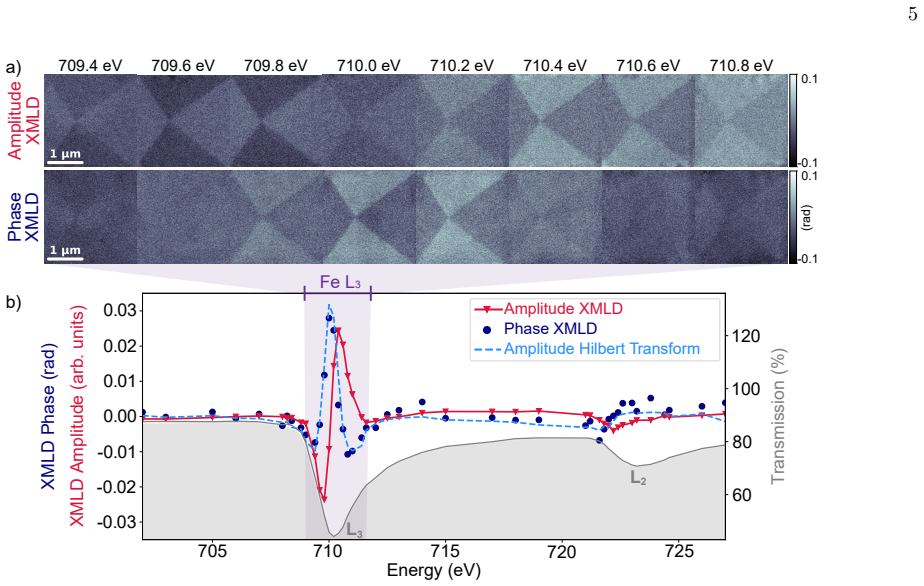
The central claim is that the real part of the complex XMLD scattering factor—the phase linear dichroism—carries stronger and sharper magnetic contrast than the imaginary (absorption) part. The authors demonstrate this by combining linear-horizontal and linear-vertical polarization ptychographic reconstructions at 52 energies across the Fe L2,3 edges, subtracting them to isolate the magnetic contribution, and using hierarchical clustering on single-pixel spectra to segment perpendicular magnetic domains without prior knowledge. The recovered phase XMLD spectrum agrees with the Hilbert transform of the amplitude spectrum, confirming that phase imaging is quantitative. At their peak energies, measured domain boundary widths are 62(5) nm for phase versus 79(12) nm for amplitude, and Fourier ring correlation gives 86 nm versus 92 nm resolution, with phase signal-to-noise up to 43 percent higher.
Load-bearing premise
The subtraction of linear-horizontal and linear-vertical reconstructions assumes that every non-magnetic contribution to the images cancels exactly, leaving a phase difference that is purely the real part of the XMLD scattering factor.
Editorial extensions
If this is right
- Phase XMLD ptychography can map antiferromagnetic and other compensated-magnet domain structures in transmission at higher resolution and lower dose than absorption-based XMLD imaging.
- The higher SNR means roughly half the number of images are needed to match absorption XMLD quality, shortening acquisition times for in situ experiments.
- The recovered phase XMLD spectrum can be used as a spectroscopic fingerprint for identifying magnetic phases and orientations in unknown samples.
- As a photon-in/photon-out technique, the method can be combined with tomography to map three-dimensional magnetic configurations in antiferromagnets.
Reading between the lines
- The phase advantage is likely not limited to XMLD: if the real part of any resonant magnetic scattering factor behaves similarly, phase-based coherent imaging could improve contrast for other weak dichroic signals in transmission.
- The hierarchical-clustering segmentation is a general recipe: any spectroscopic imaging modality with weak, noisy per-pixel spectra could use the same correlation-based clustering to identify phases, from oxidation states to ferroic orders.
- A direct test of the cancellation assumption would be to repeat the LHP/LVP subtraction on a non-magnetic region of the same sample; any residual phase structure would indicate polarization-dependent charge scattering or alignment errors rather than magnetic contrast.
- The demonstration on a ferromagnet leaves open whether the 2.6x contrast ratio persists at antiferromagnetic L-edges where the XMLD spectrum differs; measuring a known antiferromagnet such as NiO would settle the transferability.
Editorial analysis
A structured set of objections, weighed in public.
Referee Report
Summary. The paper demonstrates spectro-ptychographic imaging of the complex X-ray magnetic linear dichroism (XMLD) signal in a lithographically patterned permalloy (Ni80Fe20) Landau-state microsquare. Reconstructions at 52 energies across the Fe L2,3 edges, for linear horizontal and vertical polarization, are aligned and subtracted to produce amplitude and phase XMLD images. Domain regions are segmented by correlation-based hierarchical clustering of per-pixel spectra, and cluster-averaged spectra yield the full complex XMLD response: the amplitude spectrum reproduces the known XMLD line shape, and the phase spectrum is consistent with the Hilbert transform of the amplitude. The authors report that the phase channel provides roughly 2.6x higher contrast (7.1% vs 2.7%), up to 43% higher signal-to-noise ratio, and sharper measured domain boundaries (62 nm vs 79 nm) than the amplitude channel at their respective peak energies, and they propose phase XMLD ptychography as a high-contrast, high-resolution transmission-based approach to imaging magnetic order, with applicability to antiferromagnets and altermagnets.
Significance. If the quantitative claims hold, this is a valuable demonstration: the phase channel of the complex XMLD signal gives a practical contrast and efficiency advantage in transmission geometry, complementing XPEEM and extending toward bulk-sensitive and thicker samples. Genuine strengths include the Hilbert-transform check of the phase against the measured amplitude (an external relation, not an internal fit), the reproduction of the previously known XMLD amplitude line shape, the domain map matching the expected Landau pattern, the unsupervised clustering that visibly outperforms Otsu thresholding, and two independent resolution estimates that both rank phase above amplitude. The practical consequence (~2x more amplitude images to match phase SNR) follows correctly from the reported ratio. The principal caveats are the absence of a direct control for polarization-dependent phase artifacts in Eqs. (4)-(5), the marginal statistical significance of the resolution difference, and the not-fully-defined percentage conversion for the phase channel.
major comments (4)
- [Appendix D, Eqs. (4)-(5)] The quantitative claims rest on the assumption that the phase difference phi_XMLD = phi_LHP_NORM - phi_LVP_NORM isolates Re[f_m^(2)](m_x^2 - m_y^2), with all polarization-independent charge contrast and all ptychographic phase-retrieval artifacts canceling. Each LHP and LVP reconstruction is performed independently at each of the 52 energies and carries its own low-spatial-frequency phase errors (probe-position errors, partial coherence, wavefront changes when switching polarization); the background normalization in Eqs. (2)-(3) and the phase-ramping correction remove only constant and linear phase terms, so a spatially varying, polarization-dependent phase error would directly contaminate phi_XMLD. The Hilbert-transform agreement in Fig. 3b validates the domain-averaged phase spectrum but cannot exclude per-pixel artifacts of the kind that would bias the edge-profile and SNR comparisons. I request an explicit control: for example, a flat (noise-level) LHP-LVP phase difference in a nonmagnetic region without enforced background normalization, a 90-degree sample-rotation test that rotates the observed phase pattern, or an error map obtained from two independent reconstructions of the same dataset.
- [Section II.C, Appendix F] The proposed spatial-resolution advantage of the phase channel is not yet statistically robust. The boundary widths 62(5) nm (phase) and 79(12) nm (amplitude) differ by 17 nm against a combined uncertainty of roughly 13 nm (about 1.3 sigma under the stated uncertainties), and the FRC values (86 nm vs 92 nm) differ by only 6 nm; the two measures agree in direction, but the abstract's 'higher spatial-resolution' claim is considerably stronger than the significance of these differences, especially with only four boundaries analyzed. In addition, the measured boundary profile is the convolution of the true magnetic wall width with the imaging transfer function, so it is not a pure resolution metric, and the lower SNR of the amplitude channel can bias the arctangent fits toward larger apparent widths. Please report the number of profiles used, the statistical model for the quoted uncertainties, and an explicit significance statement, and quantify the sensitivity of the SNR comparison in Fig. 7b to the FFT mask radius in Appendix F, which is not reported.
- [Eq. (6), Fig. 5] The headline contrast ratio (7.1% vs 2.7%, about 2.6x) is computed by applying Eq. (6), which is defined for transmitted intensities I, to the reconstructed phase channel, but the manuscript never defines what I represents for a phase (which is negative for a phase advance and can pass through zero as a function of energy). As written, the comparison of a phase-derived percentage with a transmission-derived percentage is not a well-defined measure of relative contrast strength, and the two values are quoted at different energies (the phase contrast peaks near 710.2 eV and the amplitude contrast at 710.4 eV). Please define the phase percentage unambiguously (for example, through the complex logarithm of T = A exp(i phi), so that both channels are treated consistently), state the energies at which the quoted values are evaluated, and justify the comparison protocol.
- [Fig. 3b, Section II.A] The Kramers-Kronig/Hilbert validation is presented qualitatively ('good agreement can be seen') and is applied to a truncated spectrum (52 points across the L2,3 edges). Because the Hilbert transform is nonlocal, truncation introduces endpoint artifacts; the manuscript should state how the transform was computed (padding, windowing, sign convention) and quantify the agreement (for example, a correlation coefficient or RMS deviation over the measured range). In addition, the spectra in Figs. 3-5 are extracted by averaging the same per-pixel spectra that were used to define the clusters, which is self-referential: a clustering-induced bias could in principle inflate the reported signal and the 7.1%/2.7% ratio. I suggest a validation with an independent mask, for example a mask from the single high-contrast energy or a leave-one-energy-out clustering, to confirm that the extracted spectra and their Hilbert consistency do not depend on the segmentation choice.
minor comments (5)
- [Eq. (4)] Equation (4) contains logarithms of negative arguments (ln(-A_NORM)), which are undefined for the real, positive amplitude reconstructions defined in Eq. (2); presumably the intended expression is the difference of optical densities, for example A_XMLD = -ln(A_LHP_NORM) + ln(A_LVP_NORM), with the sign convention stated explicitly.
- [Section II.A, Fig. 2] The hierarchical-clustering description omits the linkage criterion (e.g., average versus Ward) and the exact rule for selecting two clusters ('the two clusters with the largest distance'); since the segmentation drives the spectral extraction, these choices should be specified for reproducibility.
- [Section II.B and Fig. 1 caption] Minor typos: 'together with with the sample's transmission spectrum' (duplicated 'with') in Section II.B, and 'PhasRetrieval Algorithm' in the Fig. 1 caption should read 'Phase Retrieval Algorithm'.
- [Section II] The statement that the vortex core is 'slightly shifted due to the presence of a small magnetic field in the setup' is not quantified; please give the shift magnitude and, if available, the estimated field.
- [Section II.C] The explanation that the FRC underestimates the resolution 'likely due to the absence of high-frequency features in the relatively featureless images' is plausible but speculative; a short demonstration on a simulated pattern, or a citation, would make this point convincing.
Circularity Check
No significant circularity: the central phase-vs-amplitude XMLD comparison is a direct measurement ratio, validated by an independent Kramers-Kronig check.
full rationale
The paper's central claim is that the phase of the complex XMLD signal provides higher contrast and resolution than the absorption XMLD signal. This is an empirical comparison of two quantities (Eqs. 4 and 5) computed from the same measured LHP and LVP ptychographic reconstructions; neither quantity is fitted to the other or to the claim. The phase spectrum is checked against the Hilbert transform of the measured amplitude (Fig. 3b), an external Kramers-Kronig relation that is not an input to the ptychographic reconstruction, so the agreement provides independent support rather than circularity. The hierarchical-clustering segmentation uses pixel spectra to assign domains and then averages those same spectra to display domain-specific XMLD spectra (App. E); this is a self-consistent summary rather than a predictive derivation, and the paper's central contrast, resolution, and SNR conclusions are based on direct image subtraction (Eqs. 4-5 and Appendix F), not on the cluster averages. Self-citations (refs. 33, 34, 36, 43) are contextual references to prior ptychographic and dichroic-imaging work; no load-bearing argument reduces to those citations, and no uniqueness theorem or ansatz is imported from the authors' own prior papers. The subtraction in Eqs. (4)-(5) relies on an assumption that non-magnetic contrast cancels, but that is a potential systematic-error or validity concern, not a circularity in the derivation chain.
Assumptions & free parameters
free parameters (2)
- Number of clusters in hierarchical clustering =
2
- FFT mask radius for SNR analysis =
not specified
assumptions (3)
- domain assumption Resonant magnetic scattering factor expansion (Eq. 1) with the XMLD term proportional to (epsilon·m)^2
- standard math Kramers-Kronig relation connects real and imaginary parts of the complex scattering factor
- domain assumption Ptychographic phase retrieval yields quantitative complex transmission function
Cite this review
Pith. "Pith review of Nanoscale Mapping of Magnetic Orientations with Complex X-ray Magnetic Linear Dichroism." pith.science (2026). https://pith.science/paper/LWPCPW7D
@misc{pith2026250208617,
  author       = {Pith},
  title        = {Pith review of: Nanoscale Mapping of Magnetic Orientations with Complex X-ray Magnetic Linear Dichroism},
  year         = {2026},
  howpublished = {\url{https://pith.science/paper/LWPCPW7D}},
  note         = {Machine review of arXiv:2502.08617}
}
read the original abstract
Compensated magnets are of increasing interest for both fundamental research and applications, with their net-zero magnetization leading to ultrafast dynamics and robust order. To understand and control this order, nanoscale mapping of local domain structures is necessary. One of the main routes to mapping antiferromagnetic order is X-ray magnetic linear dichroism (XMLD), which probes the local orientation of the N\'eel vector. However, XMLD imaging typically suffers from weak contrast and has mainly been limited to surface-sensitive techniques. Here, we harness coherent diffractive imaging to map the complex XMLD spectroscopically, and identify the phase linear dichroism as a high-contrast, high-resolution mechanism for imaging magnetic order. By applying X-ray spectroptychography to a model sample, we retrieve the full complex XMLD spectrum. Combining this with hierarchical clustering, we resolve the spatial distribution of probed domains by their distinct spectral signatures, providing a robust method for analyzing magnetic configurations with weak signals. Our results show that phase contrast is significantly stronger than the corresponding absorption contrast, offering higher spatial-resolution magnetic imaging. This approach establishes a reliable, element- and orbital-sensitive tool for studying compensated magnets.
Figures


Figures from the paper (4 more)


Reference graph
Works this paper leans on
-
[1]
H. Reichlova, D. Kriegner, A. Mook, M. Althammer, and A. Thomas, Role of topology in compensated magnetic systems, APL Materials 12 (2024)
work page 2024
-
[2]
A. Dal Din, O. Amin, P. Wadley, and K. Edmonds, An- tiferromagnetic spintronics and beyond, npj Spintronics 2, 25 (2024)
work page 2024
- [3]
-
[4]
Jungwirth, X
T. Jungwirth, X. Marti, P. Wadley, and J. Wunder- lich, Antiferromagnetic spintronics, Nature nanotechnol- ogy 11, 231 (2016)
2016
-
[5]
H. Chen, L. Liu, X. Zhou, Z. Meng, X. Wang, Z. Duan, G. Zhao, H. Yan, P. Qin, and Z. Liu, Emerging antiferro- magnets for spintronics, Advanced Materials36, 2310379 (2024)
work page 2024
-
[6]
S. A. Siddiqui, J. Sklenar, K. Kang, M. J. Gilbert, A. Schleife, N. Mason, and A. Hoffmann, Metallic an- tiferromagnets, Journal of Applied Physics 128 (2020)
work page 2020
-
[7]
H. Meer, O. Gomonay, A. Wittmann, and M. Kl¨ aui, An- tiferromagnetic insulatronics: Spintronics in insulating 3d metal oxides with antiferromagnetic coupling, Applied Physics Letters 122 (2023)
work page 2023
- [8]
Show all 46 references
-
[9]
D. Ryan, J. Cadogan, C. Ritter, F. Canepa, A. Palen- zona, and M. Putti, Coexistence of long-ranged mag- netic order and superconductivity in the pnictide super- conductor SmFeAsO1-xFx(x= 0, 0.15), Physical Review B—Condensed Matter and Materials Physics 80, 220503 (2009)
2009
-
[10]
Wadley, B
P. Wadley, B. Howells, J. ˇZelezn` y, C. Andrews, V. Hills, R. P. Campion, V. Nov´ ak, K. Olejn ´ ık, F. Maccherozzi, S. Dhesi, et al., Electrical switching of an antiferromag- net, Science 351, 587 (2016)
2016
-
[11]
Arpaci, V
S. Arpaci, V. Lopez-Dominguez, J. Shi, L. S´ anchez- Tejerina, F. Garesci, C. Wang, X. Yan, V. K. Sangwan, M. A. Grayson, M. C. Hersam, et al., Observation of current-induced switching in non-collinear antiferromag- netic irmn3 by differential voltage measurements, Nature comm...
2021
-
[12]
S. Y. Bodnar, M. Filianina, S. Bommanaboyena, T. For- rest, F. Maccherozzi, A. Sapozhnik, Y. Skourski, M. Kl¨ aui, and M. Jourdan, Imaging of current induced n´ eel vector switching in antiferromagnetic Mn2Au, Phys- ical Review B 99, 140409 (2019)
2019
-
[13]
O. Amin, S. Poole, S. Reimers, L. Barton, A. Dal Din, F. Maccherozzi, S. Dhesi, V. Nov´ ak, F. Krizek, J. Chauhan, et al., Antiferromagnetic half-skyrmions electrically generated and controlled at room tempera- ture, Nature Nanotechnology 18, 849 (2023). 9 L3 L2 Original Image...
2023
-
[14]
Kriegner, K
D. Kriegner, K. V` yborn` y, K. Olejn ´ ık, H. Reichlov´ a, V. Nov´ ak, X. Marti, J. Gazquez, V. Saidl, P. Nˇ emec, V. Volobuev, et al., Multiple-stable anisotropic magne- toresistance memory in antiferromagnetic mnte, Nature communications 7, 11623 (2016)
2016
-
[15]
P. Qin, H. Yan, X. Wang, H. Chen, Z. Meng, J. Dong, M. Zhu, J. Cai, Z. Feng, X. Zhou, et al., Room-temperature magnetoresistance in an all- antiferromagnetic tunnel junction, Nature 613, 485 (2023)
2023
-
[16]
Grzybowski, P
M. Grzybowski, P. Wadley, K. Edmonds, R. Beards- ley, V. Hills, R. Campion, B. Gallagher, J. S. Chauhan, V. Novak, T. Jungwirth, et al., Imaging current-induced switching of antiferromagnetic domains in cumnas, Phys- ical review letters 118, 057701 (2017)
2017
-
[18]
ˇSmejkal, J
L. ˇSmejkal, J. Sinova, and T. Jungwirth, Emerging re- search landscape of altermagnetism, Physical Review X 12, 040501 (2022)
2022
-
[19]
Kuiper, B
P. Kuiper, B. G. Searle, P. Rudolf, L. Tjeng, and C. Chen, X-ray magnetic dichroism of antiferromagnet fe 2 o 3: the orientation of magnetic moments observed by fe 2p x-ray absorption spectroscopy, Physical review letters 70, 1549 (1993)
1993
-
[20]
St¨ ohr, A
J. St¨ ohr, A. Scholl, T. J. Regan, S. Anders, J. L¨ uning, M. R. Scheinfein, H. A. Padmore, and R. L. White, Im- ages of the antiferromagnetic structure of a nio(100) sur- face by means of x-ray magnetic linear dichroism spec- tromicroscopy, Phys. Rev. Lett. 83, 1862 (1999)
1999
-
[21]
St¨ ohr and H
J. St¨ ohr and H. C. Siegmann, Magnetism, Solid-State Sciences. Springer, Berlin, Heidelberg 5, 236 (2006)
2006
-
[22]
Kuneˇ s and P
J. Kuneˇ s and P. M. Oppeneer, Anisotropic x-ray mag- netic linear dichroism at the l 2, 3 edges of cubic fe, co, and ni: Ab initio calculations and model theory, Physical Review B 67, 024431 (2003)
2003
-
[23]
Kuneˇ s, P
J. Kuneˇ s, P. M. Oppeneer, S. Valencia, D. Abramsohn, H.-C. Mertins, W. Gudat, M. Hecker, and C. Schnei- der, Understanding the xmld and its magnetocrystalline anisotropy at the L2, 3-edges of 3d transition metals, Journal of magnetism and magnetic materials 272, 2146 (2004)
2004
-
[24]
Arenholz, G
E. Arenholz, G. van der Laan, R. V. Chopdekar, and Y. Suzuki, Anisotropic x-ray magnetic linear dichroism at the fe l 2, 3 edges in fe 3 o 4, Physical Review B—Condensed Matter and Materials Physics 74, 094407 (2006)
2006
-
[25]
Sapozhnik, M
A. Sapozhnik, M. Filianina, S. Y. Bodnar, A. Lami- rand, M.-A. Mawass, Y. Skourski, H.-J. Elmers, H. Zabel, M. Kl¨ aui, and M. Jourdan, Direct imaging of antiferro- magnetic domains in Mn 2Au manipulated by high mag- netic fields, Physical Review B 97, 134429 (2018)
2018
-
[26]
Y. Lee, C. Kim, S. Son, J. Cui, G. Park, K.-X. Zhang, S. Oh, H. Cheong, A. Kleibert, and J.-G. Park, Imag- ing thermally fluctuating n´ eel vectors in van der waals antiferromagnet NiPS3, Nano Letters (2024)
2024
-
[27]
K. Arai, T. Okuda, A. Tanaka, M. Kotsugi, K. Fuku- moto, T. Ohkochi, T. Nakamura, T. Matsushita, T. Muro, M. Oura, Y. Senba, H. Ohashi, A. Kakizaki, C. Mitsumata, and T. Kinoshita, Three-dimensional spin orientation in antiferromagnetic domain walls of nio stud- ied by x-ray m...
2012
-
[28]
C. Luo, K. Chen, V. Ukleev, S. Wintz, M. Weigand, R.- M. Abrudan, K. Prokeˇ s, and F. Radu, Direct observation of n´ eel-type skyrmions and domain walls in a ferrimag- netic DyCo 3 thin film, Communications Physics 6, 218 (2023)
2023
-
[29]
Harrison, H
J. Harrison, H. Jani, J. Hu, M. Lal, J.-C. Lin, H. Popescu, J. Brown, N. Jaouen, A. Ariando, and P. G. Radaelli, Holographic imaging of antiferromagnetic domains with in-situ magnetic field, Opt. Express 32, 5885 (2024)
2024
-
[30]
D. A. Shapiro, Y.-S. Yu, T. Tyliszczak, J. Cabana, R. Celestre, W. Chao, K. Kaznatcheev, A. D. Kilcoyne, F. Maia, S. Marchesini, et al., Chemical composition mapping with nanometre resolution by soft x-ray mi- croscopy, Nature Photonics 8, 765 (2014)
2014
-
[31]
T. Sun, G. Sun, F. Yu, Y. Mao, R. Tai, X. Zhang, G. Shao, Z. Wang, J. Wang, and J. Zhou, Soft x-ray ptychography chemical imaging of degradation in a composite surface-reconstructed Li-rich cath- ode, ACS Nano 15, 1475 (2021), pMID: 33356135, https://doi.org/10.1021/acsnano.0c08891
2021 doi
-
[32]
T. A. Butcher, N. W. Phillips, C.-C. Chiu, C.-C. Wei, S.- Z. Ho, Y.-C. Chen, E. Fr¨ ojdh, F. Baruffaldi, M. Carulla, J. Zhang, et al., Ptychographic nanoscale imaging of the magnetoelectric coupling in freestanding BiFeO 3, Ad- vanced Materials , 2311157 (2024)
2024
-
[33]
Donnelly, V
C. Donnelly, V. Scagnoli, M. Guizar-Sicairos, M. Holler, F. Wilhelm, F. Guillou, A. Rogalev, C. Detlefs, A. Men- zel, J. Raabe, et al., High-resolution hard x-ray magnetic imaging with dichroic ptychography, Physical Review B 94, 064421 (2016)
2016
-
[34]
Donnelly, M
C. Donnelly, M. Guizar-Sicairos, V. Scagnoli, S. Gliga, M. Holler, J. Raabe, and L. J. Heyderman, Three- dimensional magnetization structures revealed with x-ray vector nanotomography, Nature 547, 328 (2017)
2017
-
[35]
Di Pietro Mart ´ ınez, A
M. Di Pietro Mart ´ ınez, A. Wartelle, N. Mille, 10 S. Stanescu, R. Belkhou, F. Fettar, V. Favre-Nicolin, and G. Beutier, Magnetic x-ray imaging using a single polar- ization and multimodal ptychography, Phys. Rev. Lett. 134, 016704 (2025)
2025
-
[36]
Neethirajan, B
J. Neethirajan, B. J. Daurer, M. D. P. Mart ´ ınez, A. c. v. Hrabec, L. Turnbull, R. Yamamoto, M. R. Ferreira, A. c. v. ˇStefanˇ ciˇ c, D. A. Mayoh, G. Balakrishnan, Z. Pei, P. Xue, L. Chang, E. Ringe, R. Harrison, S. Valen- cia, M. Kazemian, B. Kaulich, and C. Donnelly, Soft ...
2024
-
[37]
L. H. Francisco, X-ray techniques applied to the investi- gation of superconductors under extreme pressures, Doc- toral dissertation, State University of Campinas (2022)
2022
-
[38]
Enders and P
B. Enders and P. Thibault, A computational framework for ptychographic reconstructions, Proceedings of the Royal Society A: Mathematical, Physical and Engineer- ing Sciences 472, 20160640 (2016)
2016
-
[39]
Virtanen, R
P. Virtanen, R. Gommers, T. E. Oliphant, M. Haber- land, T. Reddy, D. Cournapeau, E. Burovski, P. Pe- terson, W. Weckesser, J. Bright, S. J. van der Walt, M. Brett, J. Wilson, K. J. Millman, N. Mayorov, A. R. J. Nelson, E. Jones, R. Kern, E. Larson, C. J. Carey, ˙I. Po- lat, Y...
2020
-
[40]
Schwickert, G
M. Schwickert, G. Guo, M. Tomaz, W. O’Brien, and G. Harp, X-ray magnetic linear dichroism in absorption at the L edge of metallic Co, Fe, Cr, and V, Physical Review B 58, R4289 (1998)
1998
-
[41]
Scherz, W
A. Scherz, W. F. Schlotter, K. Chen, R. Rick, J. St¨ ohr, J. L¨ uning, I. McNulty, C. G¨ unther, F. Radu, W. Eber- hardt, O. Hellwig, and S. Eisebitt, Phase imaging of mag- netic nanostructures using resonant soft x-ray hologra- phy, Phys. Rev. B 76, 214410 (2007)
2007
-
[42]
O. Amin, A. Dal Din, E. Golias, Y. Niu, A. Zakharov, S. Fromage, C. Fields, S. Heywood, R. Cousins, F. Mac- cherozzi, et al., Nanoscale imaging and control of alter- magnetism in mnte, Nature 636, 348 (2024)
2024
-
[43]
Apseros, V
A. Apseros, V. Scagnoli, M. Holler, M. Guizar-Sicairos, Z. Gao, C. Appel, L. J. Heyderman, C. Donnelly, and J. Ihli, X-ray linear dichroic tomography of crystallo- graphic and topological defects, Nature 636, 354 (2024)
2024
-
[44]
S. W. Lovesey and S. P. Collins, X-ray scattering and ab- sorption by magnetic materials(Oxford university press, 1996)
1996
-
[45]
van der Laan, Soft x-ray resonant magnetic scattering of magnetic nanostructures, Comptes Rendus Physique 9, 570 (2008)
G. van der Laan, Soft x-ray resonant magnetic scattering of magnetic nanostructures, Comptes Rendus Physique 9, 570 (2008)
2008
-
[46]
van der Walt, J
S. van der Walt, J. L. Sch¨ onberger, J. Nunez-Iglesias, F. Boulogne, J. D. Warner, N. Yager, E. Gouillart, T. Yu, and the scikit-image contributors, scikit-image: image processing in Python, PeerJ 2, e453 (2014)
2014
-
[47]
van Heel and M
M. van Heel and M. Schatz, Fourier shell correlation threshold criteria, Journal of Structural Biology 151, 250 (2005)
2005
Reviewed August 8, 2026 · model on record in the stance chip above.
Discussion (0). Continue with ORCID to comment.