REVIEW 3 major objections 5 minor 2 cited by
Cosmology from LOFAR Two-metre Sky Survey Data Release 2: Cross-correlations with luminous red galaxies from eBOSS
T0 review · 3 major / 5 minor · reviewed 2026-08-16 · deepseek-v4-flash
Pith's one-line read The baryon acoustic oscillation scale is recoverable from a radio-continuum survey when cross-correlated with optical galaxies.
desk verdict A solid first BAO measurement from radio-optical cross-correlation, but the headline significance is uncalibrated and the assumed LoTSS redshift distribution carries unpropagated uncertainty. read the letter →
The pith
A machine-rendered reading of the paper's core claim, the machinery that carries it, and where it could break.
The reading
What carries the argument
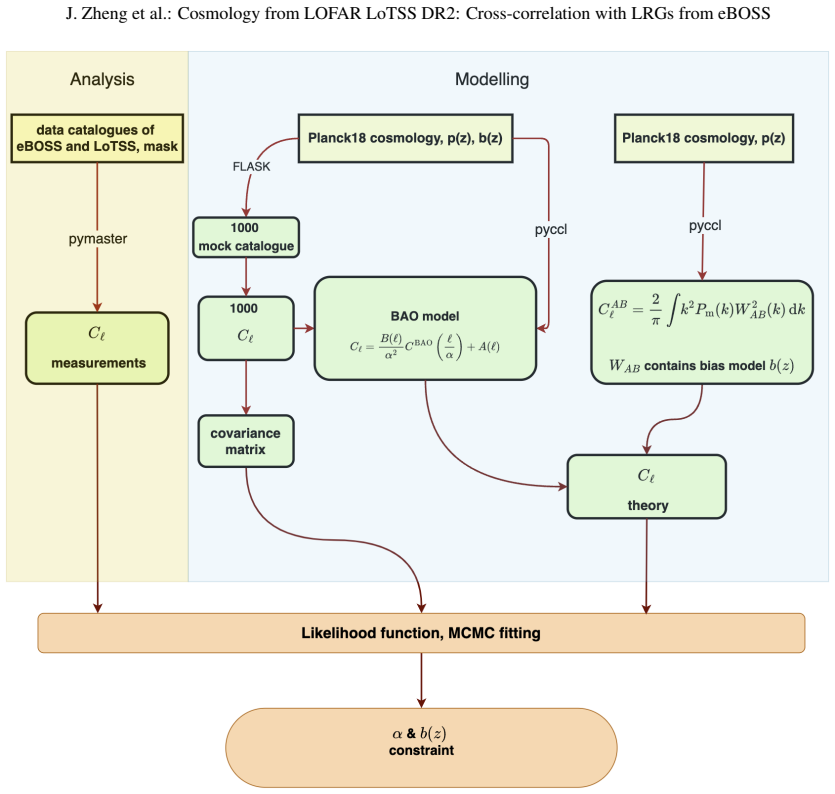
The central object is the angular power spectrum $C_\ell$ of the LoTSS--eBOSS cross-correlation and the eBOSS auto-correlation, measured with a pseudo-$C_\ell$ estimator and modelled via the Limber projection of the matter power spectrum. The BAO analysis uses the template $C_\ell = B(\ell)\,\alpha^{-2}\,C^{\rm BAO}_{\ell/\alpha} + A(\ell)$, where $\alpha = [D_A(z)/r_d]_{\rm obs}/[D_A(z)/r_d]_{\rm fid}$ is the dilation parameter, $r_d$ is the sound horizon, and the polynomial $A(\ell)$ marginalises over the broadband shape. The redshift distribution of LoTSS sources is taken from the LOFAR Deep Fields, the eBOSS redshift distribution comes directly from the spectroscopic catalogue, and 1000 lognormal mock catalogues provide the covariance matrix and pipeline validation.
What would settle it
Measure spectroscopic redshifts for a flux-limited LoTSS DR2 sample over the eBOSS overlap region with the same cuts (S/N $>7.5$, $S_{144}>1.5$ mJy) and compare the resulting $p(z)$ with the LOFAR Deep Fields distribution; a mismatch large enough to move the model $C_\ell$ by more than the mock covariance would invalidate the quoted bias and $\alpha$ errors. Alternatively, re-run the BAO fit with $p(z)$ varied within its Deep Fields uncertainty and check whether $\alpha$ moves by more than its quoted 68\% interval.
Extended reading notes
Core claim
The paper's central claim is that the BAO feature survives projection in the angular cross-correlation between unresolved radio-continuum sources and galaxies with spectroscopic redshifts, and that this signal can be used to measure the angular diameter distance and the radio-source bias. The cross-correlation is detected at 7.8--9.2$\sigma$ per redshift bin and 14.7$\sigma$ when the four bins are combined; the BAO preference over a no-wiggle model reaches $\Delta\chi^2_{\rm nw}=16.28$ for the four-bin combination. Because the fitted parameter is non-Gaussian, the paper quotes 68\% intervals rather than Gaussian errors and reports the first evidence for BAO in this tracer combination rather than a definitive detection. The measured bias values are consistent with companion analyses in configuration space and with a LoTSS--CMB lensing cross-correlation, supporting the interpretation that the selected radio sources are mainly active galactic nuclei above the 1.5 mJy flux limit.
Load-bearing premise
The paper assumes that the wide-area LoTSS DR2 redshift distribution equals the LOFAR Deep Fields redshift distribution, and it does not propagate any uncertainty in that choice into the quoted errors; if the true wide-area $p(z)$ differs, the fitted bias and the BAO template will shift.
Editorial extensions
If this is right
- Radio-continuum surveys with a known statistical redshift distribution can measure $D_A(z)$ through BAO without per-source spectroscopic redshifts.
- Combining more redshift bins, or overlaying future optical surveys over LoTSS, should tighten $\alpha$ and test dark energy at $z\sim0.7$--$1$.
- The fitted bias $b_C=2.64\pm0.20$ calibrates LoTSS radio sources as tracers of large-scale structure for later cross-correlation and intensity-mapping analyses.
- When LoTSS covers 80\% of the northern sky, the same cross-correlation analysis should turn the current BAO evidence into a statistically robust detection.
- The consistency of the evolving-bias measurement with companion angular-correlation and CMB lensing results strengthens the case that radio sources at this flux limit trace the same underlying matter distribution as optical LRGs.
Reading between the lines
- If the wide-area LoTSS redshift distribution differs from the LOFAR Deep Fields distribution, the fitted bias will shift and the quoted $\alpha$ errors will be underestimated; a spectroscopic redshift sample of LoTSS sources would settle this directly.
- The combination of cross- and auto-correlation in one bin yields a more skewed $\alpha$ distribution, suggesting that the added nuisance parameters trade bias for variance; testing with more independent redshift bins would reveal whether this behaviour persists.
- Because the 1.5 mJy flux cut selects mainly AGN-dominated radio sources, $b_C\approx2.6$ at $z\approx0.7$ is effectively a prediction for the linear bias of radio-loud AGN at those redshifts, testable with X-ray-selected or optically selected AGN samples.
- A natural next step is to apply the same template to the upcoming full LoTSS survey in combination with DESI or Euclid galaxies: the projection smoothing that currently suppresses the BAO signal would be mitigated by thinner effective redshift slices and a larger overlapping area.
Signed reviews
Editorial analysis
A structured set of objections, weighed in public.
Referee Report
Summary. The paper cross-correlates LoTSS DR2 radio sources with eBOSS LRGs in harmonic space, using pymaster to measure the angular cross- and auto-power spectra and pyccl to model them. From the cross-correlation alone in one redshift bin the authors report the BAO dilation parameter α = 1.01 ± 0.11 at z_eff = 0.63, and from four combined bins they report α = 0.968 +0.060/−0.095 at z_eff = 0.72. They also measure the LoTSS linear bias, b_C = 2.64 ± 0.20 for a constant-bias model and b_D = 1.80 ± 0.13 for an evolving-bias model, together with per-bin biases. The analysis is validated with 1000 FLASK mocks, a Hartlap-corrected covariance, jackknife resampling, and a no-wiggle null test. The paper's headline claims are a 14.7σ detection of the cross-correlation and a 4σ detection of BAO in the four-bin cross-correlation, which it presents as the first BAO evidence from a radio-continuum and optical survey cross-correlation.
Significance. If the central claims hold, this is the first BAO detection in a radio-continuum × optical cross-correlation and would demonstrate that the BAO standard ruler can be recovered without per-source radio redshifts. The pipeline work is a genuine strength: the covariance is built from 1000 correlated FLASK mocks, the inverse covariance is Hartlap-corrected, the model choice is tested on mocks, and jackknife tests are reported. The bias measurements are also useful and show good consistency with the configuration-space results of H24 and the CMB-lensing results of N24. The main risk is that the 4σ BAO significance is not statistically calibrated, and the redshift-distribution assumption for LoTSS is not propagated into the error budget. These two issues affect exactly the two headline numbers—the detection significance and the bias/α uncertainties—so they must be addressed before the paper can be accepted as a reliable measurement.
major comments (3)
- [Section 4.2, Eq. (16), Table 1] The 4σ BAO detection significance reported in the abstract and conclusions is not calibrated. The statistic Δχ²_nw compares models that are not nested: in Eq. (12) the BAO wiggle amplitude is fixed by (P_lin − P_nw) with Σ_nl = 5.5 Mpc/h, and no free amplitude parameter can reduce the model to the no-wiggle template within the prior α ∈ [0.8, 1.2]. Wilks' theorem therefore does not apply, and the assumption that Δχ²_nw follows a χ²_1 distribution is unjustified. This concern is compounded by the paper's own KS test (Section 3.2), which reports D > 0.7 for all parametrisations, and by the statement in Section 4.2 that 'reporting detection significance in sigma levels may not be appropriate'. The abstract nevertheless headlines 4σ. I ask the authors to calibrate the null distribution of Δχ²_nw using the 1000 mocks (for example, by generating null mocks from the no-wiggle template) or to rephrase the claim as an uncalibrated preference, not a detection significance.
- [Section 2.3, Fig. 3, Eqs. (8)–(9)] The LoTSS wide-area redshift distribution is assumed to equal the LOFAR Deep Fields p(z) from H24, without propagating any uncertainty. This p(z) enters the theoretical C_ℓ, the input spectra of the FLASK mocks, the covariance matrix, and the fits for both α and the bias parameters b_C and b_D. If the wide-field LoTSS DR2 population differs from the deep-field population—for example because of the S/N > 7.5 and 1.5 mJy cuts—the fitted bias b_C = 2.64 ± 0.20 and b_D = 1.80 ± 0.13 shift by an unknown amount, and the BAO template also changes. The paper should at least test robustness to alternative p(z) estimates (e.g., from N24 or from DR1-based analyses) and, ideally, marginalise over p(z) shape parameters; without this, the quoted statistical errors on the bias are not the full error budget.
- [Section 3.2, Table A.1, Section 4.2] The α constraints rest on a posterior that the KS test finds strongly non-Gaussian (D > 0.7 for every tested parametrisation), yet Table 1 reports 68% intervals and the text uses them to claim consistency with other BAO surveys in Fig. 12. The model-selection rule in Section 3.2—choose the parametrisation whose mock mean is closest to 1 and whose 68% CI is narrowest—is not a standard model-comparison criterion, and with D > 0.7 the interval endpoints are not Gaussian error bars. Several entries in Table A.1 have 68% intervals hitting the prior edge at 1.2, which suggests the criterion may be sensitive to prior truncation. I ask the authors to present the full α posterior (or a calibrated credible interval validated on the mocks) and to state explicitly what the quoted intervals mean; as written, the precision of the headline α = 0.968 +0.060/−0.095 is not yet established.
minor comments (5)
- [Section 4.2] The sentence 'by combining four redshift bins, the errors are reduced by 2%' is inconsistent with Table 1, where the upper error drops from 0.11 to 0.060; please correct the percentage or the wording.
- [Section 3.2] The KS-test statistic D > 0.7 is reported, but the sample size and the corresponding p-value are not; please add these so the reader can judge how severely non-Gaussian the posterior is.
- [Table 1] The conversion from α to DA(z_eff)/r_d uses Eq. (11), but the fiducial DA/r_d value is not quoted; please include it for reproducibility.
- [Fig. 12] The figure mixes angular α measurements with 3D α_⊥ measurements from other surveys; the text notes this in one sentence, but the figure legend should state it more prominently to avoid misinterpretation.
- [Section 2.3] The phrase 'the theoretical input must remain consistent' is unclear; please rephrase to specify which theoretical input is meant and why consistency is required.
Circularity Check
No circularity found: alpha and bias are direct fits to data with externally sourced templates and marginalised nuisance parameters.
full rationale
The central results are derived by fitting measured LoTSS DR2 x eBOSS angular power spectra to standard BAO and bias templates. In Eq. (10), C_ell = B(ell)/alpha^2 C_BAO(ell/alpha) + A(ell), alpha is a free dilation parameter and B and A are broadband nuisance terms, so the BAO dilation measurement is not constructed from its own target value. The linear bias is measured by setting the LoTSS bias to unity in the theoretical template (Section 2.3: 'we take a theoretical bias of 1 and do not assume any LoTSS bias in the theoretical model') and fitting it to the data. The LoTSS p(z) is imported from H24's external LOFAR Deep Fields analysis, and the b(z) from Tiwari et al. (2022) is used only as an input to mocks and is explicitly marginalised as broadband shape for BAO; neither is defined in terms of the fitted alpha or b_C, and both are independently falsifiable empirical inputs. The mock catalogues supply covariance and validate the pipeline, but do not encode the measured values. The paper's own caveats (Sect. 3.2: 'D > 0.7 for all tested parameterisations'; Sect. 4.2: 'reporting detection significance in sigma levels may not be appropriate') concern non-Gaussianity and the calibration of the null distribution for the 4-sigma claim; these are statistical-correctness limitations, not circular reductions. No equation in the paper reduces the claimed prediction to a fitted input by construction.
Assumptions & free parameters
free parameters (8)
- BAO dilation parameter alpha =
alpha = 0.968 (+0.060/-0.095) 4-bin; alpha = 1.01 ± 0.11 single bin
- LoTSS linear bias b_C or b_D =
b_C = 2.64 ± 0.20; b_D = 1.80 ± 0.13
- BAO broadband nuisance coefficients B0, a1, a2, a3 =
not reported (marginalized)
- eBOSS auto-spectrum shot-noise amplitude =
not reported
- LoTSS sample flux and S/N thresholds =
S_144MHz > 1.5 mJy; S/N > 7.5
- Redshift bin width and multipole window =
Delta z = 0.06; 50 < ell < 500; Delta ell = 16
- Nonlinear BAO damping Sigma_nl =
5.5 Mpc/h (fixed)
- Multi-component source fraction in radio mocks =
up to 25 percent
assumptions (8)
- domain assumption The LoTSS DR2 wide-field redshift distribution p(z) is represented by the LOFAR Deep Fields distribution.
- domain assumption eBOSS LRG bias b(z) is calibrated from EZmock simulations.
- domain assumption Galaxy bias is linear, deterministic, and scale-independent: delta_g = b(z) delta_m.
- domain assumption Shot noise between the two surveys is uncorrelated.
- domain assumption FLASK lognormal mocks provide an unbiased covariance and pipeline validation.
- standard math Limber approximation is accurate for this analysis.
- domain assumption The no-wiggle test statistic Delta chi^2_nw is approximately chi-square distributed with one degree of freedom.
- standard math Hartlap correction makes the inverse mock covariance unbiased.
Cite this review
Pith. "Pith review of Cosmology from LOFAR Two-metre Sky Survey Data Release 2: Cross-correlations with luminous red galaxies from eBOSS." pith.science (2026). https://pith.science/paper/HF7CYIKW
@misc{pith2026250420722,
  author       = {Pith},
  title        = {Pith review of: Cosmology from LOFAR Two-metre Sky Survey Data Release 2: Cross-correlations with luminous red galaxies from eBOSS},
  year         = {2026},
  howpublished = {\url{https://pith.science/paper/HF7CYIKW}},
  note         = {Machine review of arXiv:2504.20722}
}
abstract
We cross-correlated galaxies from the LOw-Frequency ARray (LOFAR) Two-metre Sky Survey (LoTSS) second data release (DR2) radio source with the extended Baryon Oscillation Spectroscopic Survey (eBOSS) luminous red galaxy (LRG) sample to extract the baryon acoustic oscillation (BAO) signal and constrain the linear clustering bias of radio sources in LoTSS DR2. In the LoTSS DR2 catalogue, employing a flux density limit of $1.5$ mJy at the central LoTSS frequency of 144 MHz and a signal-to-noise ratio (S/N) of $7.5$, additionally considering eBOSS LRGs with redshifts between 0.6 and 1, we measured both the angular LoTSS-eBOSS cross-power spectrum and the angular eBOSS auto-power spectrum. These measurements were performed across various eBOSS redshift tomographic bins with a width of $\Delta z=0.06$. By marginalising over the broadband shape of the angular power spectra, we searched for a BAO signal in cross-correlation with radio galaxies, and determine the linear clustering bias of LoTSS radio sources for a constant-bias and an evolving-bias model. Using the cross-correlation, we measured the isotropic BAO dilation parameter as $\alpha=1.01\pm 0.11$ at $z_{\rm eff}=0.63$. By combining four redshift slices at $z_{\rm eff}=0.63, 0.69, 0.75$, and $0.81$, we determined a more constrained value of $\alpha = 0.968^{+0.060}_{-0.095}$. For the entire redshift range of $z_{\rm eff}=0.715$, we measured $b_C = 2.64 \pm 0.20$ for the constant-bias model, $b(z)=b_C$, and then $b_D = 1.80 \pm 0.13$ for the evolving-bias model, $b(z) = b_D / D(z)$, with $D(z)$ denoting the growth rate of linear structures. Additionally, we measured the clustering bias for individual redshift bins.
Figures


Figures from the paper (9 more)


Forward citations
Cited by 2 Pith papers
-
Detectability of the 21 cm signal with BINGO through cross-correlation with photometric surveys
Using lognormal simulations, the authors find that BINGO 21 cm intensity mapping cross-correlated with LSST photometric galaxies can detect the HI signal even with photo-z errors, though with significance comparable t...
-
Cosmology with HI Intensity Mapping
SKAO HI intensity mapping forecasts yield competitive LambdaCDM constraints (e.g. H0 to ~0.3 km/s/Mpc optimistic) via power spectrum, BAO, bispectrum and stacking, complementary to CMB and optical surveys.
Reference graph
Works this paper leans on
-
[1]
Abbott, T., Abdalla, F., Alarcon, A., et al. 2019, MNRAS, 483, 4866
work page 2019
-
[2]
2016, arXiv preprint arXiv:1611.00036
Aghamousa, A., Aguilar, J., Ahlen, S., et al. 2016, arXiv preprint arXiv:1611.00036
arXiv 2016
- [3]
-
[4]
Alonso, D., Bellini, E., Hale, C., Jarvis, M. J., & Schwarz, D. J. 2021, MNRAS, 502, 876
work page 2021
-
[5]
2019, MNRAS, 484, 4127
Alonso, D., Sanchez, J., & Slosar, A. 2019, MNRAS, 484, 4127
2019
-
[6]
Anderson, L., Aubourg, É., Bailey, S., et al. 2014, MNRAS, 441, 24
work page 2014
-
[7]
2010, arXiv preprint arXiv:1012.3754
Andrae, R., Schulze-Hartung, T., & Melchior, P. 2010, arXiv preprint arXiv:1012.3754
arXiv 2010
-
[8]
Angulo, R., Baugh, C., Frenk, C., & Lacey, C. 2008, MNRAS, 383, 755
work page 2008
Show all 76 references
-
[9]
2018, MNRAS, 473, 4773
Ata, M., Baumgarten, F., Bautista, J., et al. 2018, MNRAS, 473, 4773
2018
-
[10]
E., Vargas-Magaña, M., Dawson, K
Bautista, J. E., Vargas-Magaña, M., Dawson, K. S., et al. 2018, ApJ, 863, 110
2018
-
[11]
2023, MNRAS, 523, 1729
Best, P., Kondapally, R., Williams, W., et al. 2023, MNRAS, 523, 1729
2023
-
[12]
J., Hale, C
Bhardwaj, N., Schwarz, D. J., Hale, C. L., et al. 2024, arXiv preprint arXiv:2406.17924
2024 arXiv
-
[13]
G., & Borrill, J
Blake, C., Ferreira, P. G., & Borrill, J. 2004, MNRAS, 351, 923
2004
-
[14]
G., Delubac, T., Rich, J., et al
Busca, N. G., Delubac, T., Rich, J., et al. 2012, arXiv preprint arXiv:1211.2616
2012 arXiv
-
[15]
2019, MNRAS, 487, 3870
Camacho, H., Kokron, N., Andrade-Oliveira, F., et al. 2019, MNRAS, 487, 3870
2019
- [16]
-
[17]
2020, MNRAS, 494, 3392
Chakraborty, A., Dutta, P., Datta, A., & Roy, N. 2020, MNRAS, 494, 3392
2020
-
[18]
& Ménard, B
Chiang, Y .-K. & Ménard, B. 2019, ApJ, 870, 120
2019
-
[19]
E., Alonso, D., Krause, E., et al
Chisari, N. E., Alonso, D., Krause, E., et al. 2019, ApJ Supplement Series, 242, 2
2019
-
[20]
2015, MNRAS, 446, 2621
Chuang, C.-H., Kitaura, F.-S., Prada, F., Zhao, C., & Yepes, G. 2015, MNRAS, 446, 2621
2015
-
[21]
Collaboration, A. et al. 2013, A&A, 558, A33
2013
-
[22]
Collaboration, A. et al. 2018, A&A, 619, A72
2018
-
[23]
Collaboration, A. et al. 2022, ApJ, 935, 167
2022
-
[24]
Condon, J. J. & Ransom, S. M. 2016, Essential radio astronomy, V ol. 2 (Prince- ton University Press)
2016
-
[25]
S., Kneib, J.-P., Percival, W
Dawson, K. S., Kneib, J.-P., Percival, W. J., et al. 2016, AJ, 151, 44
2016
-
[26]
S., Schlegel, D
Dawson, K. S., Schlegel, D. J., Ahn, C. P., et al. 2012, AJ, 145, 10 Des Bourboux, H. D. M., Rich, J., Font-Ribera, A., et al. 2020a, ApJ, 901, 153 Des Bourboux, H. D. M., Rich, J., Font-Ribera, A., et al. 2020b, ApJ, 901, 153
2012
-
[27]
2018, Physics reports, 733, 1
Desjacques, V ., Jeong, D., & Schmidt, F. 2018, Physics reports, 733, 1
2018
-
[28]
2003, Modern Cosmology (Academic Press, Elsevier Science)
Dodelson, S. 2003, Modern Cosmology (Academic Press, Elsevier Science)
2003
-
[29]
Donoso, E., Yan, L., Stern, D., & Assef, R. J. 2014, ApJ, 789, 44
2014
-
[30]
2021, A&A, 648, A4
Duncan, K., Kondapally, R., Brown, M., et al. 2021, A&A, 648, A4
2021
-
[31]
J., Zehavi, I., Hogg, D
Eisenstein, D. J., Zehavi, I., Hogg, D. W., et al. 2005, ApJ, 633, 560
2005
-
[32]
2023, Physical Review D, 108, 103007
Feldbrugge, J. 2023, Physical Review D, 108, 103007
2023
-
[33]
2014, JCAP, 2014, 027
Font-Ribera, A., Kirkby, D., Miralda-Escudé, J., et al. 2014, JCAP, 2014, 027
2014
-
[34]
A., Turner, M
Frieman, J. A., Turner, M. S., & Huterer, D. 2008, Annu. Rev. Astron. Astro- phys., 46, 385 García-García, C., Ruiz-Zapatero, J., Alonso, D., et al. 2021, JCAP, 2021, 030 Gil-Marín, H., Percival, W. J., Cuesta, A. J., et al. 2016, MNRAS, 460, 4210
2008
-
[35]
2009, A&A, 494, 33
Gilli, R., Zamorani, G., Miyaji, T., et al. 2009, A&A, 494, 33
2009
-
[36]
M., Wandelt, B
Gorski, K. M., Wandelt, B. D., Hansen, F. K., Hivon, E., & Banday, A. J. 1999, arXiv preprint astro-ph/9905275
1999 arXiv
-
[37]
2024, MNRAS, 527, 6540
Hale, C., Schwarz, D., Best, P., et al. 2024, MNRAS, 527, 6540
2024
-
[38]
2018, AJ, 156, 160
Hand, N., Feng, Y ., Beutler, F., et al. 2018, AJ, 156, 160
2018
-
[39]
Harris, C. R. et al. 2020, Nature, 585, 357
2020
-
[40]
2007, A&A, 464, 399
Hartlap, J., Simon, P., & Schneider, P. 2007, A&A, 464, 399
2007
-
[41]
2021, A&A, 646, A140
Heymans, C., Tröster, T., Asgari, M., et al. 2021, A&A, 646, A140
2021
-
[42]
2013, ApJ Supplement Series, 208, 19
Hinshaw, G., Larson, D., Komatsu, E., et al. 2013, ApJ Supplement Series, 208, 19
2013
-
[43]
G., Ross, A
Hou, J., Sánchez, A. G., Ross, A. J., et al. 2021, MNRAS, 500, 1201
2021
-
[44]
Hunter, J. D. 2007, Computing in Science & Engineering, 9, 90
2007
-
[45]
2012, A&A, 548, A37
Kollatschny, W., Reichstein, A., & Zetzl, M. 2012, A&A, 548, A37
2012
-
[46]
2019, GetDist: a Python Package for MCMC Sample Analysis
Lewis, A. 2019, GetDist: a Python Package for MCMC Sample Analysis
2019
-
[47]
& Challinor, A
Lewis, A. & Challinor, A. 2011, Astrophysics source code library, ascl
2011
-
[48]
Limber, D. N. 1953, PhD thesis, The University of Chicago
1953
-
[49]
Mandelbaum, R., Li, C., Kauffmann, G., & White, S. D. M. 2009, MNRAS, 393, 377
2009
-
[50]
2010, Proceedings of the 9th Python in Science Conference, 445, 56
McKinney, W. 2010, Proceedings of the 9th Python in Science Conference, 445, 56
2010
-
[51]
2023, MNRAS, 525, 5406
Moon, J., Valcin, D., Rashkovetskyi, M., et al. 2023, MNRAS, 525, 5406
2023
-
[52]
2024, A&A, 681, A105
Nakoneczny, S., Alonso, D., Bilicki, M., et al. 2024, A&A, 681, A105
2024
-
[53]
Peebles, P. J. E. 1973, ApJ, 185, 413 Article number, page 14 of 17 J. Zheng et al.: Cosmology from LOFAR LoTSS DR2: Cross-correlation with LRGs from eBOSS
1973
-
[54]
Percival, W. J. 2017, Physics Today, 70, 32
2017
-
[55]
J., Cole, S., Eisenstein, D
Percival, W. J., Cole, S., Eisenstein, D. J., et al. 2007, MNRAS, 381, 1053
2007
-
[56]
& Granger, B
Perez, F. & Granger, B. E. 2007, Computing in Science & Engineering, 9, 21
2007
-
[57]
1999, ApJ, 517, 565
Perlmutter, S., Aldering, G., Goldhaber, G., et al. 1999, ApJ, 517, 565
1999
-
[58]
G., Filippenko, A
Riess, A. G., Filippenko, A. V ., Challis, P., et al. 1998, AJ, 116, 1009
1998
-
[59]
J., Banik, N., Avila, S., et al
Ross, A. J., Banik, N., Avila, S., et al. 2017, MNRAS, 472, 4456
2017
-
[60]
J., Bautista, J., Tojeiro, R., et al
Ross, A. J., Bautista, J., Tojeiro, R., et al. 2020, MNRAS, 498, 2354
2020
-
[61]
2016, MNRAS, 459, 1764
Sartoris, B., Biviano, A., Fedeli, C., et al. 2016, MNRAS, 459, 1764
2016
-
[62]
2012, ApJ, 761, 13
Seo, H.-J., Ho, S., White, M., et al. 2012, ApJ, 761, 13
2012
-
[63]
R., Eisenstein, D
Seo, H.-J., Siegel, E. R., Eisenstein, D. J., & White, M. 2008, ApJ, 686, 13
2008
-
[64]
2022, A&A, 659, A1
Shimwell, T., Hardcastle, M., Tasse, C., et al. 2022, A&A, 659, A1
2022
-
[65]
2016, arXiv preprint arXiv:1611.02706
Smith, D., Best, P., Duncan, K., et al. 2016, arXiv preprint arXiv:1611.02706
2016 arXiv
-
[66]
2020, MNRAS, 499, 5527
Tamone, A., Raichoor, A., Zhao, C., et al. 2020, MNRAS, 499, 5527
2020
-
[67]
2022, ApJ, 928, 38
Tiwari, P., Zhao, R., Zheng, J., et al. 2022, ApJ, 928, 38
2022
-
[68]
& Lewis, A
Torrado, J. & Lewis, A. 2021, JCAP, 2021, 057 van Haarlem, M. P., Wise, M. W., Gunst, A., et al. 2013, A&A, 556, A2 Van Rossum, G. & Drake, F. L. 2009, Python 3 Reference Manual (Scotts Valley, CA: CreateSpace)
2021
-
[69]
Virtanen, P. et al. 2020, Nature Methods, 17, 261
2020
-
[70]
Waskom, M. L. 2021, Journal of Open Source Software, 6, 3021
2021
-
[71]
2019, A&A, 622, A2
Williams, W., Hardcastle, M., Best, P., et al. 2019, A&A, 622, A2
2019
-
[72]
S., Abdalla, F
Xavier, H. S., Abdalla, F. B., & Joachimi, B. 2016, MNRAS, 459, 3693
2016
-
[73]
G., Adelman, J., Anderson Jr, J
York, D. G., Adelman, J., Anderson Jr, J. E., et al. 2000, AJ, 120, 1579
2000
-
[74]
2021, MNRAS, 503, 1149
Zhao, C., Chuang, C.-H., Bautista, J., et al. 2021, MNRAS, 503, 1149
2021
-
[75]
2019, MNRAS, 482, 3497
Zhao, G.-B., Wang, Y ., Saito, S., et al. 2019, MNRAS, 482, 3497
2019
-
[76]
2019, Journal of Open Source Software, 4, 1298 Article number, page 15 of 17 A&A proofs: manuscript no
Zonca, A., Singer, L., Lenz, D., et al. 2019, Journal of Open Source Software, 4, 1298 Article number, page 15 of 17 A&A proofs: manuscript no. aa51958-24 Appendix A: BAO model comparison using mock catalogue This section presents the BAO model comparison, using the mock catal...
2019
Reviewed August 16, 2026 · model on record in the stance chip above.
Discussion (0). Continue with ORCID to comment.