REVIEW 3 major objections 8 minor 48 references
Evaluation metrics for temporal preservation in synthetic longitudinal patient data
T0 review · 3 major / 8 minor · reviewed 2026-08-03 · deepseek-v4-flash
Pith's one-line read Marginal resemblance in synthetic longitudinal patient data can hide destroyed covariance and individual trajectories; temporal preservation must be assessed across four categories, not by a single score.
desk verdict A practical metric battery for temporal fidelity in synthetic longitudinal data, with honest limitations but missing external validation and a schedule-robustness check. read the letter →
The pith
A machine-rendered reading of the paper's core claim, the machinery that carries it, and where it could break.
The reading
What carries the argument
The load-bearing machinery is kernel smoothing on a common regular time grid. For each variable, each observed value is weighted by a kernel function of the distance from its measurement time to the grid point, with weights normalized so they sum to one; because the weights are computed separately for the original and synthetic datasets, both datasets' irregular schedules are projected onto the same grid and then compared pointwise. The main diagnostic tools are the kernel-smoothed variance profile and the variogram—a curve separating between-subject variability, measurement error, and serial correlation—plus rank-order variability for individual stability, transition probabilities for discr
What would settle it
Simulate a longitudinal process with a known covariance structure, generate a synthetic counterpart that exactly preserves the process but changes only the measurement schedule (e.g., original early-dense/late-sparse, synthetic uniform); if the proposed metrics report a large discrepancy, they are detecting schedule change rather than temporal failure. Alternatively, recompute the paper's empirical illustration across a range of bandwidths (h = 2, 4, 8, 12) and check whether the qualitative conclusions—such as weight preserving marginals but failing covariance—survive; if the classification fl
Extended reading notes
Core claim
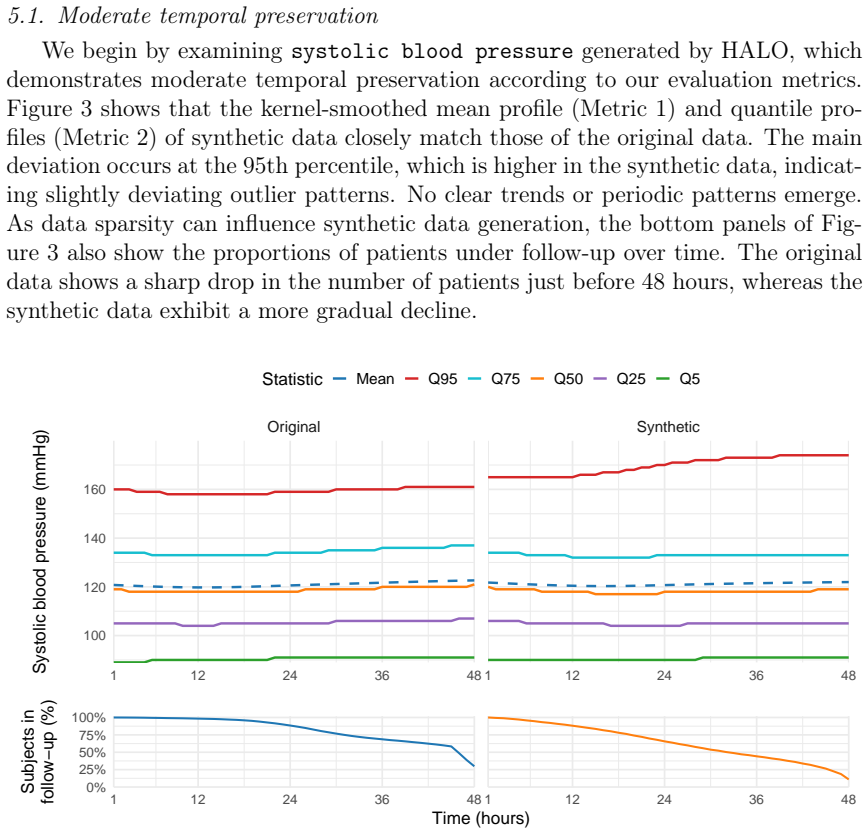
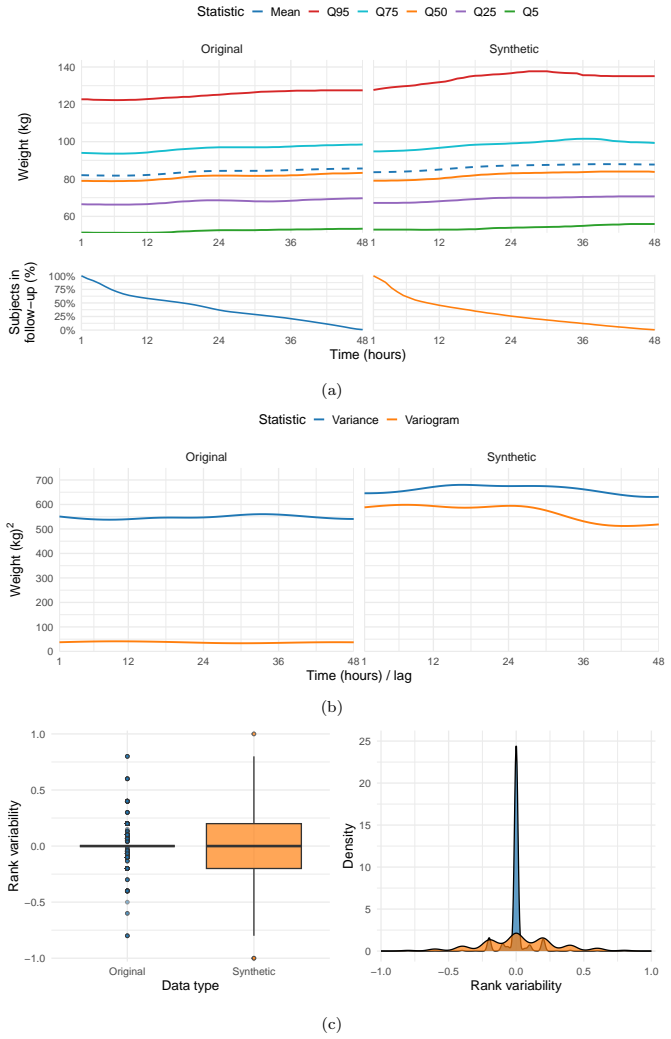
On its own terms, the paper's central claim is that no single metric adequately captures temporal preservation in synthetic longitudinal patient data, and that strong marginal-level resemblance can conceal distortions in covariance and disruptions in individual-level trajectories. The supporting discovery is a set of ten kernel-smoothed metrics spanning four categories: mean/quantile/class profiles, variance profile and variogram plus rank-order variability and local transition probabilities, subject-level trajectory plots, and measurement density/similarity/dropout divergence. In the empirical illustrations, a variable's smoothed mean and quantile profiles matched the original data while th
Load-bearing premise
The argument assumes that kernel smoothing on a common time grid, using each dataset's own measurement times to define weights, yields comparable summaries of the underlying temporal process; if real and synthetic measurement schedules sample time differently, metric discrepancies can reflect scheduling artifacts rather than genuine loss of temporal structure. The paper's manual choice of bandwidth h=6 (Section 5), combined with the claim in Remark 1 that any discrepancy at a
Editorial extensions
If this is right
- Evaluators should treat a matching mean/quantile profile as necessary but not sufficient evidence of temporal fidelity; covariance and measurement-structure metrics are required to detect the failure modes shown.
- Generative models trained on variables with sparse or irregular measurement times will show worse temporal preservation, so quality assessments should report such variables separately rather than averaging them into one score.
- Preprocessing choices—bin width, outlier handling, imputation, time encoding—can be the real cause of temporal distortion, so evaluation feedback should be directed at the data pipeline as well as the model.
- The proposed metrics give a way to localize failures in time and by subject subgroup, turning 'poor fidelity' into a specific diagnosis such as 'rare classes not learned' or 'outliers inflated.'
- Reference bands computed from resampled original data provide a natural benchmark: synthetic-to-original numbers should be compared with that internal variation, not with an absolute threshold.
Reading between the lines
- A consequence the authors do not draw: if single-score fidelity benchmarks are systematically blind to covariance and trajectory loss, previously published comparative evaluations of longitudinal generators may have overstated model quality; re-benchmarking with this battery is a natural next step.
- The same machinery could be inverted into a training objective or early-stopping criterion—penalizing variogram, rank-order, or transition-probability mismatch during generation might push models to preserve between-subject and serial structure, not just cross-sectional distributions.
- The paper's own limitations (Section 6.1—single generator per method, univariate metrics, manual bandwidth choice) mean its empirical demonstrations should be read as proof-of-concept rather than method ranking; the metrics themselves, not the specific findings, are the contribution.
Editorial analysis
A structured set of objections, weighed in public.
Referee Report
Summary. This paper introduces ten univariate metrics for evaluating temporal preservation in synthetic longitudinal patient data, organized into marginal structure (kernel-smoothed mean, quantile, and class profiles), covariance structure (variance profiles, variograms, rank-order variability, and local transition probabilities), individual trajectories, and measurement structure (measurement density, measurement similarity, dropout divergence). The authors review existing evaluation metrics, define each new metric formally on a common time grid with dataset-specific normalized kernel weights, and illustrate the toolkit on MIMIC-III data using HALO and Health Gym GAN synthetic datasets. Their central argument is that marginal-level resemblance can conceal covariance and individual-level failures, so no single metric suffices; the examples are intended to support this claim.
Significance. The paper addresses a genuine gap: most synthetic-data evaluations focus on cross-sectional fidelity and ignore temporal dependencies, especially in unbalanced longitudinal data. The proposed framework is practical, non-parametric, and accompanied by open-source R code and reproducible analysis scripts. The explicit reference-based calibration for measurement metrics (Metrics 9–10) is a good practice, and the authors are appropriately cautious about not comparing generators. If the design-bias confound is resolved and the metrics are validated against known degradations, the paper would be a useful methodological contribution to synthetic-data evaluation.
major comments (3)
- [§2.2, Remark 1; §5.2] The normalized weights in Definition 1 use each dataset's own measurement times. For this local-constant smoother, the asymptotic bias includes the design-density term μ_j'(t) f_j'(t)/f_j(t), so identical processes with different schedules yield different estimated profiles. The weight example in §5.2 therefore conflates genuine covariance loss with schedule/pair-lag differences: the synthetic data has more single-observation subjects, which changes the effective pair set in Metric 5, and the rank-order comparison in Fig. 8(c) inherits the same weights. Remark 1's claim that any discrepancy for any h is evidence of a difference is too strong. Please add (i) a bandwidth sensitivity analysis around h=6, (ii) an original-vs-original or schedule-matched calibration, and (iii) a known-degradation experiment showing the metrics detect real covariance distortions when schedules are controlled.
- [§4.2, Metric 6; Figs. 5, 8(c), 10(c), 13(b)] The metric R_ij is defined as the average first difference of quantile-bin indices, so it measures directional rank drift, not rank variability or rank-order stability. A subject oscillating between adjacent bins has expectation near zero and would be classified as stable despite high volatility. The text says values near zero indicate 'little systematic change,' but earlier frames the metric as measuring stability/volatility. None of the covariance-failure conclusions based on this metric are directly supported. Use an absolute difference or variance of rank changes for stability, or rename and reinterpret the current definition as drift.
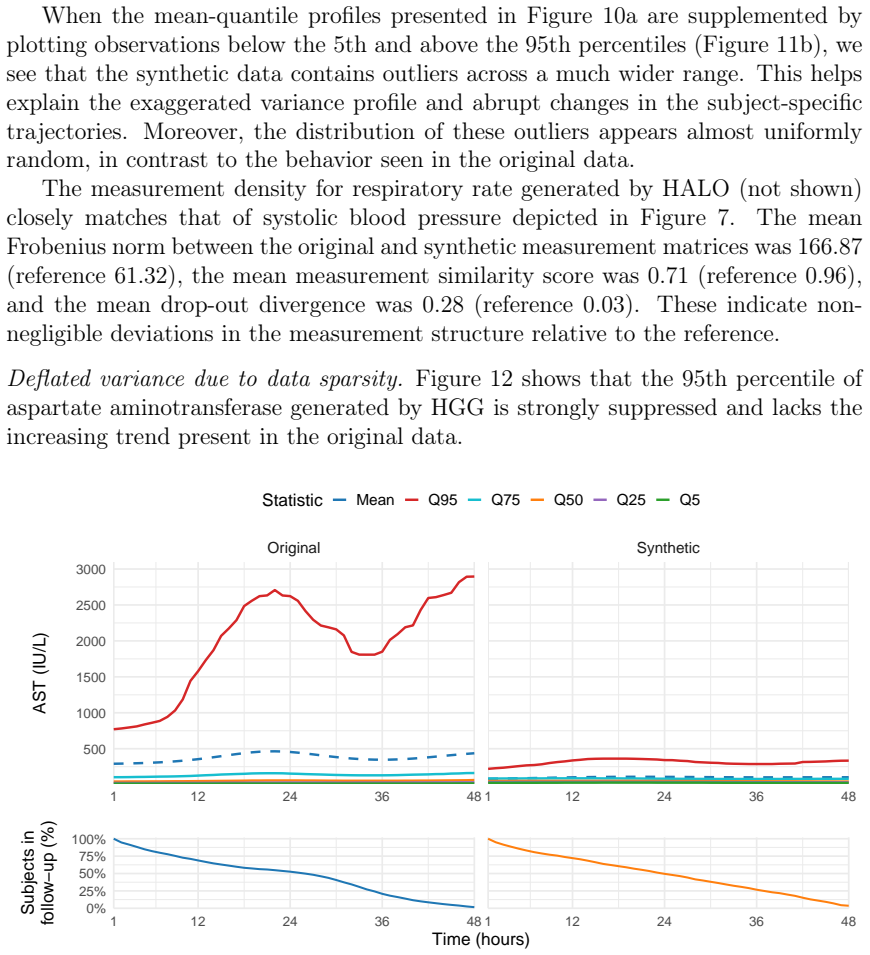
- [§5, Figs. 3–17] The kernel-smoothed profile metrics are reported without uncertainty bands or original-vs-original calibration. For sparse variables such as AST (observed at 1.5% of time points), pointwise discrepancies may be sampling noise, and the manual bandwidth h=6 may affect which differences appear. The paper provides reference values only for Metrics 9–10. Add bootstrap pointwise bands or resampled-original reference envelopes for at least the key examples (weight, respiratory rate, AST) so that 'preserved' versus 'failed' judgments have a defined baseline.
minor comments (8)
- [§1] Typo: 'increasinly' should be 'increasingly'.
- [§2.2, Remark 1] Typo: 'bandwdith' should be 'bandwidth'.
- [Definition 2 / Metric 2] Subscript notation is inconsistent: F^(K)_jz(t) appears in Definition 2, while F^(K)_jq(t) appears in Metric 2. Clarify that q is the quantile level and avoid reusing q as an index.
- [Metric 7] Notation K_h(t, t−d_ijk(t)) is confusing; since it reduces to K_h(d_ijk(t)), write it directly as a function of the distance d.
- [§5] Grammar: 'The author's of HALO reported' should be 'The authors of HALO reported'.
- [§5.2] Typo: 'aspartate aminotrasferase' should be 'aspartate aminotransferase'.
- [Metric 8] The definition uses exact equality I_ijt on a continuous time grid, which may make the measurement density degenerate for general continuous-time data. State the intended discretization (e.g., rounding or a tolerance).
- [§5, Metrics 9–10] Report standard deviations or ranges across the 100 iterations, not only means, to support the reference comparisons.
Circularity Check
Self-contained metric proposal; only mild operational circularity in defining temporal preservation as agreement of the proposed summaries.
-
self definitional
[Section 2.3, Definition 3 (and Discussion, Section 6)]
"Applying M j to the original and synthetic data yields Mj = M((xijk, tijk)), M˜j = M((˜xijk, ˜tijk)). We say that the synthetic data exhibit univariate temporal preservation for variable j if ˜Mj ≈ Mj."
Temporal preservation is defined as closeness of the chosen summary M_j (embodied in Metrics 1–10) between original and synthetic data. Consequently, the later conclusion that these metrics 'are designed for evaluating temporal preservation' is partly true by construction: there is no external, independently defined ground-truth construct of temporal preservation against which the metrics are validated. This is a mild operational tautology rather than a statistical reduction, and the paper's illustrative findings—e.g., HALO weight marginal agreement coexisting with variogram discrepancy—remain empirical and are not forced by the definitions.
full rationale
This paper is a metrics proposal, not a fitted-model derivation. The metrics in Section 4 are self-contained definitions applied symmetrically to original and synthetic data; no parameter is fitted to a subset and then used to 'predict' a closely related quantity, and no prediction is forced by construction. The central empirical examples use external MIMIC-III data and two external generators (HALO and Health Gym GAN), so the demonstrations that marginal resemblance can coexist with covariance and individual-level failures are data-driven. The only self-citation, reference [1], is used to locate previous metrics and methods, not to justify the proposed metrics or to forbid alternatives; it is not load-bearing. The main caveat is that the construct of 'temporal preservation' is operationalized by the proposed summaries in Definition 3, making the statement that these metrics measure temporal preservation partly definitional. The manually chosen bandwidth h=6 and the schedule-sensitivity concern are correctness/robustness issues, not circularity. Overall, the derivation chain is self-contained; no step reduces to its own input or to a self-citation chain, so the circularity is minor and non-load-bearing.
Assumptions & free parameters
free parameters (5)
- Bandwidth h =
6
- Time-grid step Δ_j =
unit of time (1 hour after HALO rescaling)
- Quantile level set Q for Metric 6 =
not specified
- KL smoothing constant ε (Metric 10) =
not specified
- Subsample size and iterations for Metrics 9–10 =
2,000 subjects, 100 iterations
assumptions (5)
- domain assumption Kernel-smoothed weighted summaries of original and synthetic data are directly comparable despite different measurement schedules.
- domain assumption Hungarian assignment of measurement indicator rows gives a meaningful alignment between subjects that have no natural correspondence.
- domain assumption Missingness and structural unbalancedness need not be distinguished for temporal-preservation evaluation.
- standard math Under stationarity, the variogram relative to total variance separates measurement error, serial correlation, and between-subject variability.
- domain assumption Univariate evaluation is a sufficient first-order check; multivariate temporal structure adds limited additional insight.
Cite this review
Pith. "Pith review of Evaluation metrics for temporal preservation in synthetic longitudinal patient data." pith.science (2026). https://pith.science/paper/QIABODVQ
@misc{pith2026260210643,
  author       = {Pith},
  title        = {Pith review of: Evaluation metrics for temporal preservation in synthetic longitudinal patient data},
  year         = {2026},
  howpublished = {\url{https://pith.science/paper/QIABODVQ}},
  note         = {Machine review of arXiv:2602.10643}
}
read the original abstract
This study introduces a set of metrics for evaluating temporal preservation in synthetic longitudinal patient data, defined as artificially generated data that mimic real patients' repeated measurements over time. The proposed metrics assess how synthetic data reproduces key temporal characteristics, categorized into marginal, covariance, individual-level and measurement structures. We show that strong marginal-level resemblance may conceal distortions in covariance and disruptions in individual-level trajectories. Temporal preservation is influenced by factors such as original data quality, measurement frequency, and preprocessing strategies, including binning, variable encoding and precision. Variables with sparse or highly irregular measurement times provide limited information for learning temporal dependencies, resulting in reduced resemblance between the synthetic and original data. No single metric adequately captures temporal preservation; instead, a multidimensional evaluation across all characteristics provides a more comprehensive assessment of synthetic data quality. Overall, the proposed metrics clarify how and why temporal structures are preserved or degraded, enabling more reliable evaluation and improvement of generative models and supporting the creation of temporally realistic synthetic longitudinal patient data.
Figures


Figures from the paper (14 more)






Reference graph
Works this paper leans on
-
[1]
K. Perkonoja, K. Auranen, J. Virta, Methods for Generating and Evaluating Synthetic Longitudinal Patient Data: A Systematic Review, Journal of Health- care Informatics Research (2025).doi:10.1007/s41666-025-00223-7
-
[2]
G. O. Ghosheh, J. Li, T. Zhu, A Survey of Generative Adversarial Networks for Synthesizing Structured Electronic Health Records, ACM Computing Surveys 56 (6) (2024) 1–34.doi:10.1145/3636424
-
[3]
M. Hernandez, G. Epelde, A. Alberdi, R. Cilla, D. Rankin, Synthetic data generation for tabular health records: A systematic review, Neurocomputing 493 (2022) 28–45.doi:10.1016/j.neucom.2022.04.053
-
[4]
A. D. Lautrup, T. Hyrup, A. Zimek, P. Schneider-Kamp, Systematic Review of Generative Modelling Tools and Utility Metrics for Fully Synthetic Tabular Data, ACM Computing Surveys (2024).doi:10.1145/3704437
-
[5]
H. Murtaza, M. Ahmed, N. F. Khan, G. Murtaza, S. Zafar, A. Bano, Synthetic data generation: State of the art in health care domain, Computer Science Review 48 (2023) 100546.doi:10.1016/j.cosrev.2023.100546
arXiv 2023
-
[6]
M. Ibrahim, Y. A. Khalil, S. Amirrajab, C. Sun, M. Breeuwer, J. Pluim, B. Elen, G. Ertaylan, M. Dumontier, Generative AI for synthetic data across multiple medical modalities: A systematic review of recent developments and challenges, Computers in Biology and Medicine 189 (2025) 109834.doi: 10.1016/j.compbiomed.2025.109834
arXiv 2025
-
[7]
Towards European Health Data Space (TEHDAS), Draft guideline on data min- imisation, pseudonymisation, anonymisation and synthetic data, Tech. rep. (9 2025)
2025
-
[8]
A. M. Alaa, B. Van Breugel, E. Saveliev, M. Van Der Schaar, How Faithful is your Synthetic Data? Sample-level Metrics for Evaluating and Auditing Gen- erative Models, in: K. Chaudhuri, S. Jegelka, L. Song, C. Szepesvari, G. Niu, S. Sabato (Eds.), Proceedings of the 39th International Conference on Machine Learning, PMLR, Baltimore, Maryland, 2022, pp. 290–306
2022
Show all 48 references
-
[9]
Bhanot, M
K. Bhanot, M. Qi, J. S. Erickson, I. Guyon, K. P. Bennett, The Problem of Fairness in Synthetic Healthcare Data, Entropy 23 (9) (2021) 1165.doi:10. 3390/e23091165. 45
2021
-
[10]
Pereira, M
M. Pereira, M. Kshirsagar, S. Mukherjee, R. Dodhia, J. Lavista Ferres, R. de Sousa, Assessment of differentially private synthetic data for utility and fairness in end-to-end machine learning pipelines for tabular data, PLOS ONE 19 (2) (2024) e0297271.doi:10.1371/journal.pone.0297271
2024 doi
-
[11]
P. A. Osorio-Marulanda, G. Epelde, M. Hernandez, I. Isasa, N. M. Reyes, A. B. Iraola, Privacy Mechanisms and Evaluation Metrics for Synthetic Data Gen- eration: A Systematic Review, IEEE Access 12 (2024) 88048–88074.doi: 10.1109/ACCESS.2024.3417608
2024
-
[13]
Hernadez, G
M. Hernadez, G. Epelde, A. Alberdi, R. Cilla, D. Rankin, Synthetic Tabular Data Evaluation in the Health Domain Covering Resemblance, Utility, and Pri- vacy Dimensions, Methods of Information in Medicine 62 (S 01) (2023) e19–e38. doi:10.1055/s-0042-1760247
2023 doi
-
[14]
F. K. Dankar, M. K. Ibrahim, L. Ismail, A Multi-Dimensional Evaluation of Synthetic Data Generators, IEEE Access 10 (2022) 11147–11158.doi:10.1109/ ACCESS.2022.3144765
2022
-
[15]
C. Yan, Y. Yan, Z. Wan, Z. Zhang, L. Omberg, J. Guinney, S. D. Mooney, B. A. Malin, A Multifaceted benchmarking of synthetic electronic health record generation models, Nature Communications 13 (1) (2022) 7609.doi:10.1038/ s41467-022-35295-1
2022
-
[16]
V. B. Vallevik, A. Babic, S. E. Marshall, S. Elvatun, H. M. Brøgger, S. Ala- garatnam, B. Edwin, N. R. Veeraragavan, A. K. Befring, J. F. Nygård, Can I trust my fake data – A comprehensive quality assessment framework for syn- thetic tabular data in healthcare, International J...
2024
-
[17]
Belgodere, P
B. Belgodere, P. Dognin, A. Ivankay, I. Melnyk, Y. Mroueh, A. Mojsilovic, J. Navratil, A. Nitsure, I. Padhi, M. Rigotti, J. Ross, Y. Schiff, R. Vedpathak, R. A. Young, Auditing and Generating Synthetic Data with Controllable Trust Trade-offs, IEEE Journal on Emerging and Selec...
2024
-
[18]
Johnson, T
A. Johnson, T. Pollard, R. Mark, MIMIC-III clinical database (version 1.4), PhysioNet (2016).doi:10.13026/C2XW26
2016 doi
-
[19]
A. E. Johnson, T. J. Pollard, L. Shen, L. W. H. Lehman, M. Feng, M. Ghassemi, B. Moody, P. Szolovits, L. Anthony Celi, R. G. Mark, MIMIC-III, a freely accessible critical care database, Scientific Data 3 (2016).doi:10.1038/sdata. 2016.35
2016 doi
-
[20]
Theodorou, C
B. Theodorou, C. Xiao, J. Sun, Synthesize high-dimensional longitudinal elec- tronic health records via hierarchical autoregressive language model, Nature Communications 14 (1) (2023) 5305.doi:10.1038/s41467-023-41093-0
2023 doi
-
[21]
N. I.-H. Kuo, M. N. Polizzotto, S. Finfer, F. Garcia, A. Sönnerborg, M. Zazzi, M. Böhm, R. Kaiser, L. Jorm, S. Barbieri, The Health Gym: synthetic health- related datasets for the development of reinforcement learning algorithms, Sci- entific Data 9 (1) (2022) 693.doi:10.1038/...
2022 doi
-
[22]
M. P. Wand, M. C. Jones, Kernel Smoothing, 1995.doi:10.1007/ 978-1-4899-4493-1
1995
-
[23]
Zhang, C
Z. Zhang, C. Yan, T. A. Lasko, J. Sun, B. A. Malin, SynTEG: a framework for temporal structured electronic health data simulation, Journal of the American Medical Informatics Association 28 (3) (2021) 596–604.doi:10.1093/jamia/ ocaa262
2021 doi
-
[24]
J. Li, B. J. Cairns, J. Li, T. Zhu, Generating synthetic mixed-type longitudi- nal electronic health records for artificial intelligent applications, npj Digital Medicine 6 (1) (2023) 98.doi:10.1038/s41746-023-00834-7
2023 doi
-
[25]
M. S. Haleem, A. Ekuban, A. Antonini, S. Pagliara, L. Pecchia, C. Allocca, Deep-Learning-Driven Techniques for Real-Time Multimodal Health and Phys- ical Data Synthesis, Electronics (Switzerland) 12 (9) (2023).doi:10.3390/ electronics12091989
2023
-
[26]
J. L. Achterberg, M. R. Haas, M. R. Spruit, On the evaluation of synthetic lon- gitudinal electronic health records, BMC Medical Research Methodology 24 (1) (2024).doi:10.1186/s12874-024-02304-4
2024 doi
-
[27]
Wang, T.-W
W. Wang, T.-W. Pai, Enhancing Small Tabular Clinical Trial Dataset through Hybrid Data Augmentation: Combining SMOTE and WCGAN-GP, Data 8 (9) (2023) 135.doi:10.3390/data8090135. 47
2023 doi
-
[28]
Nikolentzos, M
G. Nikolentzos, M. Vazirgiannis, C. Xypolopoulos, M. Lingman, E. G. Brandt, Synthetic electronic health records generated with variational graph autoen- coders, npj Digital Medicine 6 (1) (2023).doi:10.1038/s41746-023-00822-x
2023 doi
-
[29]
Isasa, M
I. Isasa, M. Hernandez, G. Epelde, F. Londoño, A. Beristain, X. Larrea, A. Al- berdi, P. Bamidis, E. Konstantinidis, Comparative assessment of synthetic time series generation approaches in healthcare: leveraging patient metadata for ac- curate data synthesis, BMC Medical Info...
2024 doi
-
[30]
Mosquera, K
L. Mosquera, K. El Emam, L. Ding, V. Sharma, X. H. Zhang, S. E. Kababji, C. Carvalho, B. Hamilton, D. Palfrey, L. Kong, B. Jiang, D. T. Eurich, A method for generating synthetic longitudinal health data, BMC Medical Re- search Methodology 23 (1) (2023).doi:10.1186/s12874-023-01869-w
2023 doi
- [31]
-
[32]
Theodorou, S
B. Theodorou, S. Jain, C. Xiao, J. Sun, ConSequence: Synthesizing Logically Constrained Sequences for Electronic Health Record Generation, Proceedings of the AAAI Conference on Artificial Intelligence 38 (14) (2024) 15355–15363. doi:10.1609/aaai.v38i14.29460
2024 doi
- [33]
-
[34]
Z. Wang, J. Sun, PromptEHR: Conditional Electronic Healthcare Records Generation with Prompt Learning, in: Proceedings of the 2022 Conference on Empirical Methods in Natural Language Processing, Association for Com- putational Linguistics, Stroudsburg, PA, USA, 2022, pp. 2873–...
2022 doi
-
[35]
A. S. Hashemi, K. Etminani, A. Soliman, O. Hamed, J. Lundström, Time-series Anonymization of Tabular Health Data using Generative Adversarial Network, in: 2023InternationalJointConferenceonNeuralNetworks(IJCNN),Vol.2023- June, IEEE, 2023, pp. 1–8.doi:10.1109/IJCNN54540.2023.10...
2023
-
[36]
N. I.-H. Kuo, F. Garcia, A. Sönnerborg, M. Böhm, R. Kaiser, M. Zazzi, M. Poliz- zotto, L. Jorm, S. Barbieri, Generating synthetic clinical data that capture class imbalanced distributions with generative adversarial networks: Example using antiretroviral therapy for HIV, Journ...
2023
-
[37]
Diggle, P
P. Diggle, P. Heagerty, K.-Y. Liang, S. Zeger, Exploring longitudinal data, in: Analysis of Longitudinal Data, 2nd Edition, Oxford University Press, 2002, Ch. 3, pp. 39–52.doi:10.1093/oso/9780198524847.001.0001
2002
-
[38]
P. J. Diggle, A. P. Verbyla, Nonparametric Estimation of Covariance Structure in Longitudinal Data, Biometrics 54 (2) (1998) 401.doi:10.2307/3109751
1998 doi
-
[39]
Gringarten, C
E. Gringarten, C. V. Deutsch, Teacher’s Aide Variogram Interpretation and Modeling, Mathematical Geology 33 (4) (2001) 507–534.doi:10.1023/A: 1011093014141
2001 doi
-
[40]
H. W. Kuhn, The Hungarian method for the assignment problem, Naval Re- search Logistics Quarterly 2 (1-2) (1955).doi:10.1002/nav.3800020109
1955 doi
-
[41]
Tomizawa, On some techniques useful for solution of transportation network problems, Networks 1 (2) (1971).doi:10.1002/net.3230010206
N. Tomizawa, On some techniques useful for solution of transportation network problems, Networks 1 (2) (1971).doi:10.1002/net.3230010206
1971 doi
-
[42]
Edmonds, R
J. Edmonds, R. M. Karp, Theoretical Improvements in Algorithmic Efficiency for Network Flow Problems, Journal of the ACM (JACM) 19 (2) (1972).doi: 10.1145/321694.321699
1972
-
[43]
Biswal, S
S. Biswal, S. Ghosh, J. Duke, B. Malin, W. Stewart, J. Sun, EVA: Generating Longitudinal Electronic Health Records Using Conditional Variational Autoen- coders, in: K. Jung, S. Yeung, M. Sendak, M. Sjoding, R. Ranganath (Eds.), Proceedings of the 6th Machine Learning for Healt...
2021
-
[44]
Gottesman, J
O. Gottesman, J. Futoma, Y. Liu, S. Parbhoo, L. A. Celi, E. Brunskill, F. Doshi- Velez, Interpretable Off-Policy Evaluation in Reinforcement Learning by High- lighting Influential Transitions, in: H. D. III, A. Singh (Eds.), Proceedings of the 37th International Conference on ...
2020
-
[45]
Aristodimou, A
A. Aristodimou, A. Diavastos, C. S. Pattichis, A fast supervised density-based discretization algorithm for classification tasks in the medical domain, Health Informatics Journal 28 (1) (2022).doi:10.1177/14604582211065397. 49
2022 doi
-
[46]
Y. Wu, W. Wu, D. Yang, C. Xu, Z. Li, Neural response generation with dynamic vocabularies, in: 32nd AAAI Conference on Artificial Intelligence, AAAI 2018, 2018.doi:10.1609/aaai.v32i1.11943
2018 doi
-
[47]
M. H. Huque, J. B. Carlin, J. A. Simpson, K. J. Lee, A comparison of multiple imputation methods for missing data in longitudinal studies, BMC Medical Research Methodology 18 (1) (2018) 168.doi:10.1186/s12874-018-0615-6
2018 doi
-
[48]
R. J. Little, A test of missing completely at random for multivariate data with missing values, Journal of the American Statistical Association 83 (404) (1988). doi:10.1080/01621459.1988.10478722
1988
-
[49]
Li, Little’s test of missing completely at random, Stata Journal 13 (4) (2013)
C. Li, Little’s test of missing completely at random, Stata Journal 13 (4) (2013). doi:10.1177/1536867x1301300407. 50
2013 doi
Reviewed August 3, 2026 · model on record in the stance chip above.
Discussion (0). Sign in to comment.