REVIEW 4 major objections 5 minor 12 references
At the same error rate, open-weight LLMs still differ sharply in how severe their worst mistakes are.
Reviewed by Pith at T0; open to challenge. T0 means a machine referee read the full paper against a public rubric. the ladder, T0–T4 →
T0 review · grok-4.5
2026-07-12 20:39 UTC pith:5WYWGHUU
load-bearing objection Useful evaluation axis with a real matched-accuracy discriminator and honest pre-reg failures; the 85-pair human headline is thinner than the abstract sells, but the core claim still holds on the judge baseline and rank evidence. the 4 major comments →
ERRORQUAKE: Heavy-Tailed Error Severity Distributions in Open-Weight Large Language Models
The pith
A machine-rendered reading of the paper's core claim, the machinery that carries it, and where it could break.
Core claim
Across 210 pairs among 21 open-weight models, 85 have disjoint 95% confidence intervals on the upper-tail severity slope b at matched accuracy on human-consensus scoring. Severity profile therefore carries model-discriminative information that the scalar error rate cannot express; the paper proves this non-redundancy formally and ties the heavier tails to a shift from retrieval errors toward fabrications.
What carries the argument
The severity distribution index b — the Gutenberg–Richter upper-tail slope of the magnitude-frequency relation for continuous 0–4 error scores — together with the Non-Reducibility Theorem that b is informationally independent of the error rate ε.
Load-bearing premise
That continuous 0–4 severity scores from the dual-judge pipeline and the human consensus are reliable enough, and that the chosen upper-tail cutoff isolates the deployment-relevant slope rather than bulk decay.
What would settle it
Find a substantial set of matched-accuracy model pairs whose human-scored severity tails still produce overlapping b confidence intervals, or show that coarsening or re-anchoring the 9-level severity scale leaves the matched-accuracy discrimination count near zero.
Editorial analysis
A structured set of objections, weighed in public.
Referee Report
Summary. The paper argues that open-weight LLMs with matched error rates can still differ substantially in the shape of their error-severity distributions, and that this shape should be reported alongside accuracy. It introduces ERRORQUAKE-10K (10,000 queries, 8 domains, 5 tiers), scores responses on a 0–4 severity grid with a dual LLM-judge pipeline plus a 519-item three-rater human study, and summarizes upper-tail behavior with a Gutenberg–Richter slope b for 21 open-weight models. The headline is that 85 of 210 model pairs have disjoint 95% b CIs at |Δε|<0.05 on human-consensus scoring (31 on the LLM-judge baseline), supported by a Non-Reducibility Theorem, mutual-information estimates, a mechanism taxonomy, and several robustness checks; pre-registered failures (Exp. 3 magnitude calibration, S1 coarsening) are reported.
Significance. If the matched-accuracy discriminator is solid, the paper supplies a practically useful second axis for hallucination evaluation: catastrophic load can diverge by an order of magnitude at fixed ε, which matters for deployment gating in high-stakes factual settings. Strengths include an open 10K benchmark and scoring toolkit, honest pre-registration outcomes, human ICC(2,k=3)=0.85 with human–judge rank ρ=0.89, a non-parametric tail-ratio cross-check, domain jackknife and aggregation robustness on the judge baseline, and an explicit mechanism taxonomy (κ=0.83) linking high severity to fabrication. The Non-Reducibility result and I(b;model|ε)=1.56 bits frame the claim cleanly. These are real contributions to evaluation methodology even if some secondary scaling claims remain sensitivity analyses.
major comments (4)
- [§4.1, §8, Appendix B, Prop. 2] §4.1 headline and §8: The central 85/210 disjoint-CI claim is stated on “human-consensus scoring,” yet the human study is only 519 items (~35 per model × 15 models), which §8 itself calls “limited for per-model b-value precision.” Prop. 2’s Resolution Bound (median SE≈0.064, min detectable Δb≈0.253) is calibrated to the large judge n; with ~35 items the upper-tail exceedance counts after mmin selection are typically far smaller, so human b CIs should be much wider and the 85-pair count more fragile. The manuscript also cites a “full 186,521-item human-consensus scoring (Appendix B)” for higher precision, but Appendix B is the 4K-vs-10K scale-up and does not document item-level human re-scoring of the full catalog. Please define exactly how human-consensus b and its bootstrap CIs are constructed for all 21 models, report per-model n≥mmin and SE(b) under that construction, and recompute th
- [§2, §4.6 S2, Appendix L] §2 dual-judge reliability and Appendix L: Pre-tiebreak ICC(2,1)=0.374 and final averaged ICC(2,k=2)=0.545 are only fair–moderate, and the 340-item audit finds 33.5% overcall at score 2.0 (vs 13.7% human). S2 overcall correction narrowly fails the pre-registered ρ>0.85 threshold (0.847). Because b is an upper-tail slope on a 9-level grid, systematic mid-scale overcall and moderate inter-judge agreement can shift mmin selection and compress or inflate tails differently across models. The paper should either (i) show that the matched-accuracy disjoint-CI count is stable under a human-calibrated overcall correction applied model-wise, or (ii) center the headline on the more conservative judge-baseline 31-pair result plus the non-parametric tail-ratio check, with human data used strictly for ranking/ICC validation.
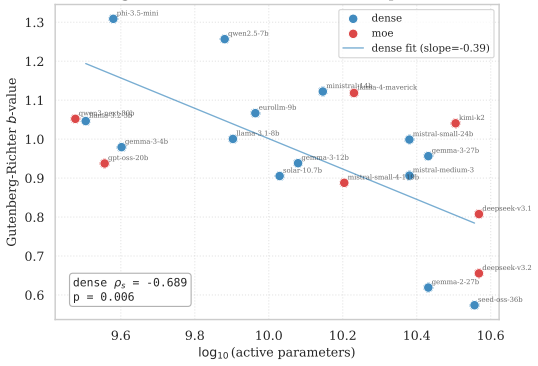
- [§4.3, §4.6 S5, Appendix T] §4.3 and S5 (Appendix T): The dense scaling claim ρs=−0.562 (human −0.86) is already demoted to a sensitivity observation, but the mmin sweep flips the sign to +0.79/+0.84 under fixed mmin=0.5 or 1.5. That means “larger models have heavier tails” is true only for the KS-selected upper-tail estimator, while bulk decay moves the opposite way. Given that free parameter mmin is load-bearing for both b ranking and the scaling narrative, the main text should state more sharply that b is not a unique summary of the severity distribution, report bulk vs upper-tail slopes side by side in the main results table, and avoid language that equates b with a single model-level “heaviness” without specifying the cutoff regime.
- [§4.2, Abstract, title] §4.2 operational “heavy-tailed” claim: On a bounded discrete grid {0.5,…,4.0} with only eight positive bins, asymptotic heavy-tail language is unavailable, and zero models are pure power-law; 13/21 are stretched exponential and 4 exponential. The operational definition (“slower than exponential on the positive grid, or excess mass at M≥2.5”) is reasonable but should be the primary claim in the abstract/title framing. Gutenberg–Richter b remains a useful slope summary, but the paper should not lean on seismological heavy-tail connotations beyond what the discrete BIC/Vuong evidence supports, especially when four models are BIC-best exponential yet still enter the b catalog.
minor comments (5)
- [Table 1, §4.4, C6] Table 1 and §4.4: Exp. 3 is correctly marked FAIL on magnitude calibration; consider moving the rank-only ρs=0.443 result fully into a “partial signal” subsection so readers do not over-read the catastrophe-prediction language in the contributions list (C6).
- [Figure 1, Figure 4, Table 3] Figure 1 vs Figure 4: b values in the four-panel figure (e.g. deepseek-v3.2 b=0.66) do not always match Table 3 (0.595) or the all-model grid labels; reconcile fitted b across figures and the main table.
- [§5, Appendix A] §5 Theorem 1: The existence construction is clear, but the empirical I(b;model|ε)=1.56 bits depends on a 5-bin discretisation that is not specified in the main text; state bin edges and sensitivity in Appendix A.
- [Checklist / §8] NeurIPS checklist items 8, 12, 14, 15 are answered No (compute details, upstream licenses, compensation, IRB). For a journal version, add a short compute/API note, license table for evaluated models, and human-subjects protocol statement even if review was not required.
- [§2, §5] Notation: ε is used for error rate and also appears near exponential fits; consider e or err for error rate to avoid clash with base of the natural exponential in the Aki formula.
Circularity Check
No load-bearing circularity: b is MLE-estimated from severity scores independently of ε; Non-Reducibility is an existence proof via free GR intercept, not a data-forced identity.
full rationale
The central empirical claim (85/210 matched-accuracy pairs with disjoint 95% b CIs) rests on Aki MLE of the upper-tail slope from positive severity scores plus bootstrap CIs; ε is a separate binary error rate and does not algebraically determine b. Theorem 1 part (i) constructs counter-examples by freely choosing distinct b while adjusting the GR intercept a to hit any target ε∗; this is a standard non-reducibility/existence argument inside a two-parameter family, not a claim that data-derived b is forced by ε. Part (ii) and the empirical I(b;model|ε)=1.56 bits follow directly. Exp. 3 fits b on easy tiers and tests extrapolation to hard-tier catastrophe counts; the magnitude criterion fails and is reported as such, so it is not a fitted-input-called-prediction success. No self-citations, uniqueness theorems, or smuggled ansätze appear. Mild residual risk (LLM judges scoring LLM outputs; KS mmin targeting the upper tail the paper emphasizes) is methodological, not a derivation that reduces by construction to its inputs. Score 1 reflects only that residual, not a circular step.
Axiom & Free-Parameter Ledger
free parameters (5)
- mmin (per-model KS-selected lower cutoff for b)
- matched-accuracy band |Δε|<0.05
- severity grid spacing δ=0.5 (9 levels 0–4)
- minimum exceedance support T (default 30)
- judge agreement threshold 1.0 before tiebreak
axioms (4)
- domain assumption Error severity of free-form LLM answers can be scored on a continuous non-negative scale that is comparable across models and domains.
- ad hoc to paper Upper-tail counts of severity obey a Gutenberg–Richter-like log-linear form useful for summarizing catastrophic risk.
- standard math Maximum-likelihood / Aki estimation and Vuong/BIC model selection are valid on the discrete severity grid.
- domain assumption Dual-judge mean (with tiebreak) plus human consensus are adequate proxies for true severity ranking across models.
invented entities (3)
-
severity distribution index b for LLMs
independent evidence
-
ERRORQUAKE-10K benchmark
independent evidence
-
six-category severity mechanism taxonomy
no independent evidence
read the original abstract
At matched accuracy, open-weight LLMs differ substantially in the shape of their error severity distribution -- a difference invisible to the scalar error rate. Hallucination benchmarks report a single error count and treat all errors as equivalent, yet a wrong date and a fabricated court ruling differ by orders of magnitude. We introduce Errorquake-10k, a 10,000-query benchmark scoring each response on a continuous 0-4 severity scale across 8 domains and 5 difficulty tiers, and we fit per-model severity distributions for 21 open-weight models. For each model we estimate a severity distribution index (b, the Gutenberg-Richter upper-tail slope) with 95% bootstrap confidence intervals. Headline: across the 210 model pairs, 85 have disjoint 95% b confidence intervals at matched accuracy (|Delta epsilon| < 0.05) on human-consensus scoring, e.g. deepseek-v3.2 vs. ministral-14b at epsilon = 0.586 and Delta b = 0.47. A 519-item three-rater human validation study confirms measurement reliability (ICC(2,k=3) = 0.85), validates the LLM-judge ranking (rho = 0.89), and confirms the dense-model scaling correlation on human data (rho_s = -0.86). We prove a Non-Reducibility Theorem showing that severity profile and error rate are informationally non-redundant (I(b; model | epsilon) = 1.56 bits; 64.5% of cross-model b variance is unexplained by epsilon). A severity mechanism taxonomy (kappa = 0.83) reveals that error type shifts categorically with severity: low-severity errors are retrievals (71%); high-severity errors are fabrications (39%) -- and this composition differs by model size (p < 0.0001). Severity distribution should be reported alongside accuracy; it carries discriminative information that the error rate cannot.
Figures


Reference graph
Works this paper leans on
-
[1]
Beyond accuracy: Measuring the severity of LLM hallucinations.Findings of the 2025 Conference on Empirical Methods in Natural Language Processing (EMNLP Findings),
Pardis Asgari et al. Beyond accuracy: Measuring the severity of LLM hallucinations.Findings of the 2025 Conference on Empirical Methods in Natural Language Processing (EMNLP Findings),
2025
-
[2]
Lost in tran- scription, found in distribution shift: Demystifying hallucination in speech foundation models
Hanin Atwany, Abdul Waheed, Rita Singh, Monojit Choudhury, and Bhiksha Raj. Lost in tran- scription, found in distribution shift: Demystifying hallucination in speech foundation models. InFindings of the Association for Computational Linguistics: ACL 2025,
2025
-
[3]
Aofei Chang, Le Huang, Parminder Bhatia, Taha Kass-Hout, Fenglong Ma, and Cao Xiao
Introduces the Hallucination Error Rate (HER) metric. Aofei Chang, Le Huang, Parminder Bhatia, Taha Kass-Hout, Fenglong Ma, and Cao Xiao. MedHEval: Benchmarking hallucinations and mitigation strategies in medical large vision-language models. arXiv preprint arXiv:2503.02157,
-
[4]
Overview of the ClinIQLink 2025 shared task on medical question-answering
Brandon Colelough, Davis Bartels, and Dina Demner-Fushman. Overview of the ClinIQLink 2025 shared task on medical question-answering. InProceedings of the 24th BioNLP Workshop (ACL 2025),
2025
-
[5]
9 Matthew Dahl, Varun Magesh, Mirac Suzgun, and Daniel E. Ho. DAHL: Domain-specific hallucina- tion decomposition for legal LLMs. InProceedings of the 2024 Conference on Empirical Methods in Natural Language Processing (EMNLP),
2024
-
[6]
Language models (mostly) know what they know.arXiv preprint arXiv:2207.05221,
Saurav Kadavath, Tom Conerly, Amanda Askell, Tom Henighan, Dawn Drain, Ethan Perez, Nicholas Schiefer, et al. Language models (mostly) know what they know.arXiv preprint arXiv:2207.05221,
-
[7]
Brown, Benjamin Chess, Rewon Child, Scott Gray, Alec Radford, Jeffrey Wu, and Dario Amodei
Jared Kaplan, Sam McCandlish, Tom Henighan, Tom B. Brown, Benjamin Chess, Rewon Child, Scott Gray, Alec Radford, Jeffrey Wu, and Dario Amodei. Scaling laws for neural language models. arXiv preprint arXiv:2001.08361,
Pith/arXiv arXiv 2001
-
[8]
HaluEval: A large- scale hallucination evaluation benchmark for large language models
Junyi Li, Xiaoxue Cheng, Wayne Xin Zhao, Jian-Yun Nie, and Ji-Rong Wen. HaluEval: A large- scale hallucination evaluation benchmark for large language models. InProceedings of the 2023 Conference on Empirical Methods in Natural Language Processing (EMNLP), pages 6449–6464,
2023
-
[9]
Teaching models to express their uncertainty in words.Transactions on Machine Learning Research, 2022a
Stephanie Lin, Jacob Hilton, and Owain Evans. Teaching models to express their uncertainty in words.Transactions on Machine Learning Research, 2022a. Stephanie Lin, Jacob Hilton, and Owain Evans. TruthfulQA: Measuring how models mimic human falsehoods. InProceedings of the 60th Annual Meeting of the Association for Computational Linguistics (ACL), pages 3...
2025
-
[10]
Ashish Seth, Dinesh Manocha, and Chirag Agarwal. Towards a systematic evaluation of hallucinations in large-vision language models (HALLUCINOGEN).arXiv preprint arXiv:2412.20622,
-
[11]
Kaiwen Zuo and Yirui Jiang. MedHallBench: A new benchmark for assessing hallucination in medical large language models.arXiv preprint arXiv:2412.18947,
-
[12]
verbose hedge
The four clearest overcall patterns observed in the manual audit were: (i) “verbose hedge” — a response that is factually correct but wraps the answer in qualifications or caveats the judge mistook for uncertainty; (ii) “partial synonym” — a correct answer phrased with a different noun than the reference (e.g., “emperor” vs “king” for a historical ruler w...
2000
discussion (0)
Sign in with ORCID, Apple, or X to comment. Anyone can read and Pith papers without signing in.