REVIEW 3 major objections 4 minor 289 references
A 72-disk JWST census finds that every jet comes with a wind
Reviewed by Pith at T0; open to challenge. T0 means a machine referee read the full paper against a public rubric. the ladder, T0–T4 →
T0 review · deepseek-v4-flash
2026-08-01 06:52 UTC pith:34DOLVXN
load-bearing objection Reference-size census of H2 winds and [Ne II] jets in Class II disks with a credible accretion-rate trend, but the wind classification needs a quantitative test against flared-disk-surface emission before the evolutionary story is sold. the 3 major comments →
JWST/MIRI Reveals the Evolution from Molecular to Atomic Disk Winds
The pith
A machine-rendered reading of the paper's core claim, the machinery that carries it, and where it could break.
Core claim
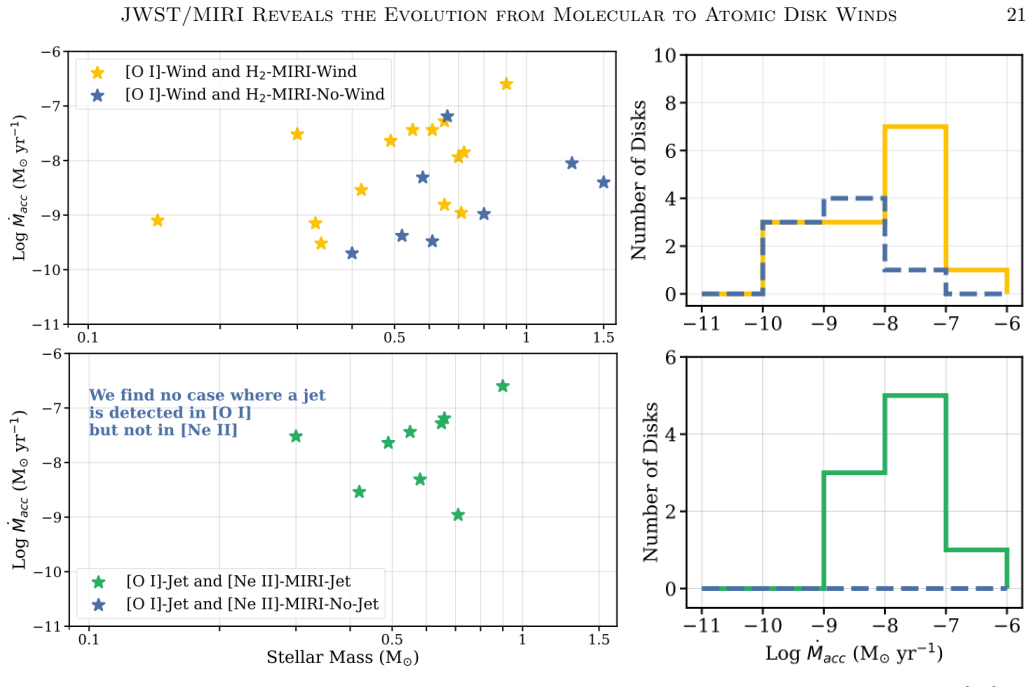
The paper's central claim is that there is a one-to-one correspondence between atomic jets and disk winds, and that the wind's composition evolves with disk age. Concretely: 34 of 40 sources with [Ne II] jets also show extended H2 wind emission, and the few jet sources without H2 winds show [O I] low-velocity-component winds where data exist. The jet and molecular-wind detection fractions increase with mass accretion rate (to about 80% above 1e-8 solar masses per year) with no dependence on inclination or stellar mass, whereas marginally resolved low-velocity [Ne II] winds are found preferentially at low accretion rates. Among H2 winds, the hot inner lines S(5) and S(7) fade faster than the
What carries the argument
The identification framework rests on two quantitative tools. First, extended emission is assessed by comparing spaxel-by-spaxel encircled-flux curves of line maps against calibration-star PSFs using a chi-square threshold, with a rescaling step to catch faint extended structure. Second, wind-like H2 emission is classified by a line-map ratio (LR) versus continuum-map ratio (CR) test: if the line brightness inside two opposing 100-degree triangular regions perpendicular to the disk position angle exceeds the continuum ratio and the line extends beyond the continuum, the source is classified as a wind. [Ne II] jets are classified from pixel-by-pixel velocity maps corrected for stellar radial
Load-bearing premise
The load-bearing premise is that cone-shaped, extended H2 emission perpendicular to the disk traces a wind; if the cones are instead infalling gas, scattered light, or PSF artifacts, the jet-wind correspondence and the molecular-to-atomic sequence lose their foundation.
What would settle it
Measure high-resolution (R>30,000) spatially resolved velocity maps of the H2 S(1) line for a dozen of the 46 classified wind sources: an MHD wind predicts outflowing kinematics (blueshifted near side, increasing velocity with height), while infall predicts redshifted motions toward the star and no forward motion; either result would settle the classification.
If this is right
- The outflow census (46 H2 winds, 40 [Ne II] jets) becomes a statistical reference for wind-launching models in Class II disks.
- Wind-driven accretion models gain support: if every jet has a wind, mass loss and angular momentum removal are coupled rather than independent.
- Disk dispersal models must include a molecular MHD wind phase before photoevaporation takes over, shifting the timing of inner disk clearing.
- Accretion rate, not stellar mass or inclination, is the controlling variable for outflow detectability across the 0.1-1 solar mass range.
- Hot H2 lines S(5) and S(7) serve as sensitive evolutionary indicators of inner wind weakening.
Where Pith is reading between the lines
- A testable corollary the paper leaves implicit: transitional disks with inner dust cavities and low accretion should show S(1) molecular winds but little or no S(5)/S(7) hot wind, and their [Ne II] should be a low-velocity photoevaporative wind rather than a jet.
- If the wind and jet are a single MHD system, their combined mass-loss rate should scale with accretion rate; re-analyzing the measured H2 and [Ne II] surface brightnesses to derive mass-loss rates would test this directly.
- The infall-versus-wind ambiguity for cone-shaped H2 could be settled with spatially resolved velocity maps in, say, the H2 S(1) line at high spectral resolution; that would also discriminate MHD from photoevaporative launching.
- The red-shifted lobe dominance in IRAS-04385 and WSB52, framed as evidence for the Hall effect, invites a quantitative comparison with non-ideal MHD simulations to see whether such asymmetry is reproduced.
Editorial analysis
A structured set of objections, weighed in public.
Referee Report
Summary. This paper presents a JWST/MIRI MRS survey of 72 inclined (i>40°) mostly Class II protoplanetary disks, identifying spatially extended H2 S(1)/S(3)/S(5)/S(7) and [Ne II] 12.81 µm emission. A morphological/kinematic framework is used to classify 46 conical H2 winds and 40 [Ne II] jets, with 34 sources showing both. The authors report that outflow detection fractions increase with accretion rate, are roughly flat with stellar mass and inclination up to ~80°, and that hotter H2 wind tracers (S(5), S(7)) decline preferentially at low accretion rates. Combining these results with literature [O I] 6300 Å spectroscopy, they propose an evolutionary sequence in which actively accreting disks host atomic jets and molecular MHD winds, while lower-accretion disks transition to predominantly atomic, photoevaporative winds.
Significance. If the classifications and trends withstand scrutiny, this would be the largest systematic census of spatially resolved disk winds and jets to date, providing a benchmark for wind-launching and disk-dispersal models. The paper has notable strengths: a uniform, fully specified calibration pipeline; quantitative extended-emission and wind/jet classification criteria; explicit SNR-based sensitivity checks in Figure 11; cross-checks against published [O I] spectroscopy and earlier MIRI detections; and a public data set with documented analysis choices. The proposed staged outflow sequence is a falsifiable prediction that connects Class 0/I outflow studies to disk clearing at Class II. The main risk is not internal inconsistency but the unvalidated morphological assumption that extended H2 emission in the 100° cones traces outflows rather than flared disk surfaces or other non-wind structure. That assumption underlies the census that drives all downstream statistics.
major comments (3)
- [§4.1/Abstract] The LR>CR test does not uniquely isolate a conical wind: a flared, inclined disk surface also projects warm gas into the 100° cones perpendicular to the disk PA. The two sources that had to be rescued by visual inspection after the automated test failed—SYCha and FTTau (Fig. 4)—are low-inclination cases where a bowl-like surface morphology is naturally expected. The manuscript lists 'extended disk surfaces' as an alternative origin but provides no quantitative false-positive test (e.g., injecting wind-free disk models into the classifier). Since the 46-wind census drives the accretion-rate trend, the S(5)/S(7) decline, and the jet–wind correspondence, a non-negligible disk-surface contamination rate would directly weaken the central evolutionary claim. Please add a quantitative test, or at minimum demonstrate that the classified morphologies cannot be reproduced by plausible disk surface
- [§4.5, Fig. 11] The claim that all [Ne II] jets have a corresponding wind is stronger than the data support. Of the 40 jets, 34 have H2 winds; of the remaining 6, only 2 single sources have published [O I] high-resolution data (both show LVC), while 2 single sources and 2 binaries have no [O I] constraint. Thus the abstract's 'All sources with [NeII] jets exhibit a corresponding wind traced in either H2 (85%) or [OI]' is not directly established. The supported statement is 34/40 plus 2/2 among those with available [O I] observations. Please rephrase the abstract and §6 summary to distinguish measured detections from inferences, or provide additional [O I] data.
- [§4.6, Fig. 12] The statement that the accretion-rate trend is not sensitivity-limited is based on comparing each source's total line SNR to the minimum SNR among classified detections. However, a source with high total SNR can still fail the extended-morphology criterion if the line is centrally concentrated, and the detection threshold shown in the figure is not an empirically calibrated completeness limit. A formal injection-recovery test (or a per-line SNR comparison between wind and non-wind sources at fixed accretion rate) is needed to exclude a sensitivity origin for the rising detection fraction with accretion. This is the key quantitative evidence for the 'outflow detection increases with accretion' conclusion.
minor comments (4)
- [§3.3] The [O I] comparison is based on only 26/72 stars ('about 36%'). The conclusion that low accretors show only [O I]/[Ne II] winds and lack H2 winds rests on a small subset; selection effects in which stars have [O I] spectroscopy should be discussed more explicitly.
- [Appendix figures] The 'jet-like bulk velocity' category (|vc|>30 km/s but no jet-like velocity map) is operationally reasonable, but these 7 sources are counted as jets even though they are not spatially resolved as jets. A sentence clarifying how these differ from 'marginally resolved [Ne II] winds' in terms of observable consequences would help.
- [§3.2] The atlas of maps in Figures 5–6 and 13 is a major resource, but the captions are dense and the orientation cue ('direction of North can be inferred from Fig. 13') is indirect. Adding explicit N/E arrows and scale bars to each montage, or at least to the first row of each page, would improve usability.
- [Table 3] The paragraph on the 60° wider-angle run lists newly detected winds in S(3)/S(5) but does not state whether those sources are included in the final 46-wind census. Please clarify to avoid ambiguity in Table 3 and Figures 7–8.
Circularity Check
No significant circularity: outflow classifications and accretion correlations are independently measured, with self-citations serving only as testable priors.
full rationale
The paper's derivation chain is observational rather than definitional: continuum-subtracted line maps are compared against PSF stars to identify extended emission; H2 winds are classified by the LR>CR test inside a 100° cone, and [Ne II] jets by velocity maps and a 30 km/s threshold; these classifications are then correlated with literature values of mass accretion rate, stellar mass, and inclination. No parameter is fitted to the outcome variable being 'predicted.' The adopted thresholds (30 km/s, 100° cone) come from prior published work, including Pascucci et al. (2025) with partially overlapping authors, but this is not load-bearing in a circular way: the analysis is repeated with a wider 60° semi-opening angle without changing the central conclusions, and the classification results are cross-checked against external [O I] spectroscopy, ALMA disk orientations, and previous MIRI detections. The molecular-to-atomic evolutionary sequence is presented as an empirical correlation between outflow morphology and independently determined accretion rates, with the Pascucci et al. (2020) scenario framed as the hypothesis being tested, not as the evidence for the new detection fractions. The caveats the paper itself states—infall/wind morphological degeneracy, the assumption that the continuum is not wind-like, and bowl-like morphologies in FTTau and SYCha—concern measurement validity and potential false positives, not circular reasoning, because they do not reduce the evolutionary claim to its own inputs. No load-bearing step equates a fitted parameter with a prediction or derives the result from a self-citation chain.
Axiom & Free-Parameter Ledger
free parameters (4)
- Wind-search vertex angle (semi-opening) =
50° (widened to 60° in re-run)
- Per-spaxel line detection threshold =
3σ amplitude vs local noise
- Jet/wind velocity boundary =
30 km/s (deprojected)
- Extended-emission χ² threshold =
mean + 3σ of PSF-to-PSF χ²
axioms (6)
- domain assumption Conical H2 emission perpendicular to the disk PA traces a disk wind
- ad hoc to paper The continuum emission near each line is not wind-like, so the continuum ratio CR is a valid baseline
- domain assumption PSF stars HD159222, delta UMi, and 16 Cyg B represent the MIRI PSF at all target wavelengths and exposure depths
- domain assumption Literature disk inclinations, position angles, and radial velocities (or region averages) are accurate enough for deprojection
- domain assumption Mass accretion rate from the literature is a valid proxy for disk evolutionary stage
- domain assumption H2 S(1)/S(3)/S(5)/S(7) relative detections trace wind temperature and launch radius ('hotter, likely inner' versus 'colder' winds)
read the original abstract
The evolution and dispersal of protoplanetary disks--governed by accretion, magnetically launched jets and winds, and photoevaporative winds--fundamentally shape planetary systems. Determining how these mass-loss processes co-evolve is crucial for constraining planet formation pathways. We analyze archival JWST/MIRI/IFU data of 72 inclined (i>40deg) mostly ClassII disks to identify and characterize spatially resolved jets and winds, focusing on [NeII] and H2 lines. Extended emission in H2 S(1), S(3), S(5), S(7) and/or [NeII] is detected toward 66 disks, revealing diverse morphologies. We develop a framework to identify conical H2 winds and high-velocity [NeII] jets perpendicular to the disk, detecting them toward 46 and 40 disks, respectively. All sources with [NeII] jets exhibit a corresponding wind traced in either H2 (85%) or [OI], establishing a connection between jets and winds. The detection fractions of [NeII]-jets and H2-winds correlate positively with mass accretion rate, with no dependence on disk inclination or stellar mass. Conversely, marginally resolved low-velocity [NeII] winds are found preferentially toward lower accretors. Among sources with H2 winds, detection of hotter winds traced by S(7) and S(5) declines more rapidly with decreasing accretion rate than the colder S(1) component. Comparison with high-resolution [OI]6300\text{\AA} spectroscopy reveals [OI] LVC and extended H2 wind detections preferentially toward moderate-to-high accretors (>~10^{-8.5}~Msun/yr), whereas lower accretors exhibit only [OI] and [NeII] winds. Together, these results indicate that atomic jets and atomic+molecular winds, consistent with an MHD disk-wind origin, dominate during early, actively accreting disk phases, while at lower accretion rates, jets weaken and winds become predominantly atomic.
Figures




Reference graph
Works this paper leans on
-
[1]
2022, , 259, 35, 10.3847/1538-4365/ac4414
Abdurro'uf , Accetta , K., Aerts , C., et al. 2022, , 259, 35, 10.3847/1538-4365/ac4414
-
[2]
2014, , 564, A11, 10.1051/0004-6361/201220488
Agra-Amboage , V., Cabrit , S., Dougados , C., et al. 2014, , 564, A11, 10.1051/0004-6361/201220488
-
[4]
Agurto-Gangas , C., P \'e rez , L. M., Sierra , A., et al. 2025, , 989, 4, 10.3847/1538-4357/adc7ab
-
[5]
Alcalá, J. M. , Manara, C. F. , Natta, A. , et al. 2017, , 600, A20, 10.1051/0004-6361/201629929
-
[6]
2014, in Protostars and Planets VI, ed
Alexander , R., Pascucci , I., Andrews , S., Armitage , P., & Cieza , L. 2014, in Protostars and Planets VI, ed. H. Beuther , R. S. Klessen , C. P. Dullemond , & T. Henning , 475--496, 10.2458/azu_uapress_9780816531240-ch021
-
[7]
Anderson , A. R., Williams , J. P., Blake , G. A., et al. 2024, , 977, 213, 10.3847/1538-4357/ad7e16
-
[8]
Andrews , S. M. 2020, , 58, 483, 10.1146/annurev-astro-031220-010302
-
[9]
Ansdell , M., Haworth , T. J., Williams , J. P., et al. 2020, , 160, 248, 10.3847/1538-3881/abb9af
-
[10]
Arulanantham , N., McClure , M. K., Pontoppidan , K., et al. 2024, , 965, L13, 10.3847/2041-8213/ad35c9
-
[11]
2025, , 170, 67, 10.3847/1538-3881/addd01
Arulanantham , N., Salyk , C., Pontoppidan , K., et al. 2025, , 170, 67, 10.3847/1538-3881/addd01
-
[12]
2017, , 849, 56, 10.3847/1538-4357/aa8264
Aso , Y., Ohashi , N., Aikawa , Y., et al. 2017, , 849, 56, 10.3847/1538-4357/aa8264
-
[13]
Astropy Collaboration , Robitaille , T. P., Tollerud , E. J., et al. 2013, , 558, A33, 10.1051/0004-6361/201322068
-
[14]
Astropy Collaboration , Price-Whelan , A. M., Sip o cz , B. M., et al. 2018, , 156, 123, 10.3847/1538-3881/aabc4f
-
[15]
Astropy Collaboration , Price-Whelan , A. M., Lim , P. L., et al. 2022, , 935, 167, 10.3847/1538-4357/ac7c74
-
[16]
Bacciotti , F., Eisl \"o ffel , J., & Ray , T. P. 1999, , 350, 917
1999
-
[17]
Bai , X.-N., & Stone , J. M. 2013, , 769, 76, 10.1088/0004-637X/769/1/76
-
[18]
2016, , 818, 152, 10.3847/0004-637X/818/2/152
Bai , X.-N., Ye , J., Goodman , J., & Yuan , F. 2016, , 818, 152, 10.3847/0004-637X/818/2/152
-
[19]
S., Pascucci , I., Gorti , U., et al
Bajaj , N. S., Pascucci , I., Gorti , U., et al. 2024, , 167, 127, 10.3847/1538-3881/ad22e1
-
[20]
Bajaj , N. S., Pascucci , I., Beck , T. L., et al. 2025, , 169, 296, 10.3847/1538-3881/adc73c
-
[21]
Balbus , S. A., & Hawley , J. F. 1991, , 376, 214, 10.1086/170270
doi:10.1086/170270 1991
-
[22]
2016, , 54, 491, 10.1146/annurev-astro-081915-023341
Bally , J. 2016, , 54, 491, 10.1146/annurev-astro-081915-023341
-
[23]
Bally , J., & Lada , C. J. 1983, , 265, 824, 10.1086/160729
-
[24]
2019, , 870, 76, 10.3847/1538-4357/aaf1aa
Banzatti , A., Pascucci , I., Edwards , S., et al. 2019, , 870, 76, 10.3847/1538-4357/aaf1aa
-
[25]
Banzatti , A., & Pontoppidan , K. M. 2015, , 809, 167, 10.1088/0004-637X/809/2/167
-
[26]
Banzatti , A., Pontoppidan , K. M., Salyk , C., et al. 2017, , 834, 152, 10.3847/1538-4357/834/2/152
-
[27]
2021, The infrared water spectrum as a tracer of pebble delivery to rocky planets , JWST Proposal
Banzatti , A., Ballering , N., Bosman , A., et al. 2021, The infrared water spectrum as a tracer of pebble delivery to rocky planets , JWST Proposal. Cycle 1, ID. \#1640
2021
-
[28]
Barenfeld , S. A., Carpenter , J. M., Sargent , A. I., Isella , A., & Ricci , L. 2017, , 851, 85, 10.3847/1538-4357/aa989d
-
[29]
Barenfeld , S. A., Carpenter , J. M., Sargent , A. I., et al. 2019, , 878, 45, 10.3847/1538-4357/ab1e50
-
[30]
Bary , J. S., Weintraub , D. A., & Kastner , J. H. 2003, , 586, 1136, 10.1086/367719
doi:10.1086/367719 2003
-
[31]
Beck , T. L., & Bary , J. S. 2019, , 884, 159, 10.3847/1538-4357/ab4259
-
[32]
Beck , T. L., Bary , J. S., & McGregor , P. J. 2010, , 722, 1360, 10.1088/0004-637X/722/2/1360
-
[33]
Beck , T. L., McGregor , P. J., Takami , M., & Pyo , T.-S. 2008, , 676, 472, 10.1086/527528
-
[34]
2017, , 600, A75, 10.1051/0004-6361/201630056
B \'e thune , W., Lesur , G., & Ferreira , J. 2017, , 600, A75, 10.1051/0004-6361/201630056
-
[35]
Biazzo , K., Alcal \'a , J. M., Covino , E., et al. 2012, , 547, A104, 10.1051/0004-6361/201219680
-
[36]
Bitner , M. A., Richter , M. J., Lacy , J. H., et al. 2008, , 688, 1326, 10.1086/592317
doi:10.1086/592317 2008
-
[37]
Bjerkeli , P., van der Wiel , M. H. D., Harsono , D., Ramsey , J. P., & J rgensen , J. K. 2016, , 540, 406, 10.1038/nature20600
-
[38]
Blandford , R. D., & Payne , D. G. 1982, , 199, 883, 10.1093/mnras/199.4.883
-
[39]
J., Benisty , M., Perraut , K., et al
Bohn , A. J., Benisty , M., Perraut , K., et al. 2022, , 658, A183, 10.1051/0004-6361/202142070
-
[40]
Booth , A. S., Tabone , B., Ilee , J. D., et al. 2021, , 257, 16, 10.3847/1538-4365/ac1ad4
-
[41]
Bradley, L., Sipőcz, B. M., Robitaille, T. P., et al. 2026, Photutils, 3.0.0, Zenodo, 10.5281/zenodo.19636730
-
[42]
2001, , 561, L199, 10.1086/324676
Brandeker , A., Liseau , R., Artymowicz , P., & Jayawardhana , R. 2001, , 561, L199, 10.1086/324676
-
[45]
T., Hu \'e lamo , N., & Alcal \'a , J
Cahill , E., Whelan , E. T., Hu \'e lamo , N., & Alcal \'a , J. 2019, , 484, 4315, 10.1093/mnras/stz280
-
[46]
Caratti o Garatti , A., Ray , T. P., Kavanagh , P. J., et al. 2024, , 691, A134, 10.1051/0004-6361/202451350
-
[47]
Carpenter , J. M., Esplin , T. L., Luhman , K. L., Mamajek , E. E., & Andrews , S. M. 2025, , 978, 117, 10.3847/1538-4357/ad8ebc
-
[48]
Carrera , D., Gorti , U., Johansen , A., & Davies , M. B. 2017, , 839, 16, 10.3847/1538-4357/aa6932
-
[49]
2017, , 604, A69, 10.1051/0004-6361/201629404
Champion , J., Bern \'e , O., Vicente , S., et al. 2017, , 604, A69, 10.1051/0004-6361/201629404
-
[50]
Cieza , L. A., Schreiber , M. R., Romero , G. A., et al. 2010, , 712, 925, 10.1088/0004-637X/712/2/925
-
[51]
Cieza , L. A., Olofsson , J., Harvey , P. M., et al. 2011, , 741, L25, 10.1088/2041-8205/741/2/L25
-
[52]
Dahm , S. E. 2010, , 140, 1444, 10.1088/0004-6256/140/5/1444
-
[53]
Davis , C. J., Ray , T. P., Desroches , L., & Aspin , C. 2001, , 326, 524, 10.1046/j.1365-8711.2001.04560.x
arXiv 2001
-
[54]
J., Cervantes , B., Nisini , B., et al
Davis , C. J., Cervantes , B., Nisini , B., et al. 2011, , 528, A3, 10.1051/0004-6361/201015897
-
[55]
2024, , 688, A173, 10.1051/0004-6361/202449176
Delabrosse , V., Dougados , C., Cabrit , S., et al. 2024, , 688, A173, 10.1051/0004-6361/202449176
-
[56]
2025, , 989, 3, 10.3847/1538-4357/add43a
Deng , D., Vioque , M., Pascucci , I., et al. 2025, , 989, 3, 10.3847/1538-4357/add43a
-
[57]
Devaraj , R., van Dishoeck , E. F., Ray , T. P., et al. 2026, arXiv e-prints, arXiv:2601.17820. 2601.17820
arXiv 2026
-
[58]
Duch \^e ne , G., M \'e nard , F., Stapelfeldt , K. R., et al. 2024, , 167, 77, 10.3847/1538-3881/acf9a7
-
[59]
2017, , 607, A130, 10.1051/0004-6361/201730645
Dutrey , A., Guilloteau , S., Pi \'e tu , V., et al. 2017, , 607, A130, 10.1051/0004-6361/201730645
-
[60]
Dzyurkevich , N., Turner , N. J., Henning , T., & Kley , W. 2013, , 765, 114, 10.1088/0004-637X/765/2/114
-
[61]
Eisner , J. A., Hillenbrand , L. A., White , R. J., Akeson , R. L., & Sargent , A. I. 2005, , 623, 952, 10.1086/428828
-
[62]
E., Podio , L., Dougados , C., et al
Ellerbroek , L. E., Podio , L., Dougados , C., et al. 2014, , 563, A87, 10.1051/0004-6361/201323092
-
[63]
Facchini , S., van Dishoeck , E. F., Manara , C. F., et al. 2019, , 626, L2, 10.1051/0004-6361/201935496
-
[64]
2023, , 945, 112, 10.3847/1538-4357/acb2c9
Fang , M., Pascucci , I., Edwards , S., et al. 2023, , 945, 112, 10.3847/1538-4357/acb2c9
-
[65]
2018, , 868, 28, 10.3847/1538-4357/aae780
---. 2018, , 868, 28, 10.3847/1538-4357/aae780
-
[66]
Federman , S. A., Megeath , S. T., Rubinstein , A. E., et al. 2024, , 966, 41, 10.3847/1538-4357/ad2fa0
-
[67]
2022, , 938, 93, 10.3847/1538-4357/ac912d
Fiorellino , E., Zsidi , G., K \'o sp \'a l , \'A ., et al. 2022, , 938, 93, 10.3847/1538-4357/ac912d
-
[68]
Flores , C., Ohashi , N., Tobin , J. J., et al. 2023, , 958, 98, 10.3847/1538-4357/acf7c1
-
[69]
Flores-Rivera , L., Flock , M., Kurtovic , N. T., et al. 2023, , 670, A126, 10.1051/0004-6361/202141664
-
[70]
2020, , 892, 111, 10.3847/1538-4357/ab7b63
Francis , L., & van der Marel , N. 2020, , 892, 111, 10.3847/1538-4357/ab7b63
-
[71]
Francis , L., Tychoniec , ., van Dishoeck , E. F., et al. 2026, arXiv e-prints, arXiv:2604.13773, 10.48550/arXiv.2604.13773
-
[72]
Frank , A., Ray , T. P., Cabrit , S., et al. 2014, in Protostars and Planets VI, ed. H. Beuther , R. S. Klessen , C. P. Dullemond , & T. Henning , 451--474, 10.2458/azu_uapress_9780816531240-ch020
-
[73]
Frasca , A., Biazzo , K., Alcal \'a , J. M., et al. 2017, , 602, A33, 10.1051/0004-6361/201630108
-
[74]
Gammie , C. F. 1996, , 457, 355, 10.1086/176735
doi:10.1086/176735 1996
-
[75]
2020, , 643, A32, 10.1051/0004-6361/202038534
Gangi , M., Nisini , B., Antoniucci , S., et al. 2020, , 643, A32, 10.1051/0004-6361/202038534
-
[76]
2022, , 667, A124, 10.1051/0004-6361/202244042
Gangi , M., Antoniucci , S., Biazzo , K., et al. 2022, , 667, A124, 10.1051/0004-6361/202244042
-
[77]
H., Isella , A., Li , H., et al
Gardner , C. H., Isella , A., Li , H., et al. 2025, , 984, L16, 10.3847/2041-8213/adc432
-
[78]
2014, , 567, A141, 10.1051/0004-6361/201321987
Garufi , A., Podio , L., Kamp , I., et al. 2014, , 567, A141, 10.1051/0004-6361/201321987
-
[79]
Giacalone , S., Teitler , S., K \"o nigl , A., Krijt , S., & Ciesla , F. J. 2019, , 882, 33, 10.3847/1538-4357/ab311a
-
[80]
2024, , 685, A52, 10.1051/0004-6361/202244005
Ginski , C., Garufi , A., Benisty , M., et al. 2024, , 685, A52, 10.1051/0004-6361/202244005
-
[81]
Glassgold , A. E., Mamon , G. A., & Huggins , P. J. 1991, , 373, 254, 10.1086/170045
-
[82]
Gontcharov , G. A. 2006, Astronomical and Astrophysical Transactions, 25, 145, 10.1080/10556790600916780
-
[83]
Gorti , U., Hollenbach , D., & Dullemond , C. P. 2015, , 804, 29, 10.1088/0004-637X/804/1/29
discussion (0)
Sign in with ORCID, Apple, or X to comment. Anyone can read and Pith papers without signing in.