REVIEW 4 major objections 5 minor 178 references
Jupiter's main cloud deck sits at 1–2 bar, not at the 0.7-bar ammonia condensation level, according to a combined analysis of visible and near-infrared spectra.
Reviewed by Pith at T0; open to challenge. T0 means a machine referee read the full paper against a public rubric. the ladder, T0–T4 →
T0 review · deepseek-v4-flash
2026-08-01 02:08 UTC pith:RXW4PUO6
load-bearing objection A transparent, technically impressive retrieval study whose headline 'ammonia-cloud link' is built into the parameterization rather than recovered; worth refereeing with major revisions. the 4 major comments →
Cloud and ammonia vertical profiles in the equatorial atmosphere of Jupiter determined from visible to near-IR observations made by VLT/MUSE, Cassini/VIMS, IRTF/SpeX and Juno/JIRAM
The pith
A machine-rendered reading of the paper's core claim, the machinery that carries it, and where it could break.
Core claim
The central claim is that a single combined cloud/ammonia model fits Jupiter's equatorial spectra from 0.48 to 5.15 μm. The model has three components: an optically-thick lower cloud (radius r≈10 μm) at 1–2 bar, composed of large, highly scattering particles that are absorbing at 5 μm; an optically-thin upper cloud (r≈10 μm) at ∼0.55 bar requiring a distinct absorption band near 3 μm; and a layer of small (r≈0.2 μm) blue-absorbing chromophore particles located within the lower cloud. The ammonia profile is parameterized to drop sharply at the lower cloud base and then to saturate at the upper cloud's condensation level. This setup explains the puzzlingly deep cloud-top pressures found from v
What carries the argument
The central mechanism is the three-cloud/ two-step-ammonia parameterization. Cloud-1 (r≈10 μm, base at 1–2 bar) is optically thick and highly scattering at visible wavelengths but absorbing at 5 μm; Cloud-2 (r≈10 μm, base at the ammonia saturation pressure, ∼0.55 bar) is optically thin with a 3-μm absorption feature; and a chromophore layer (r≈0.2 μm, at 1.25 bar) sits inside Cloud-1. The ammonia mole fraction is forced to have a deep value, drop to an intermediate value at the Cloud-1 base, then remain constant until saturation at the Cloud-2 base, above which humidity decays with altitude. The argument is carried by a line-by-line radiative-transfer retrieval that computes particle scatter
Load-bearing premise
The load-bearing premise is that the ammonia profile really has a sharp two-step shape—a drop at the lower cloud base and saturation at the upper cloud base—which is imposed by the model parameterization; if the true ammonia profile is smoother or follows a different temperature-pressure relation, the cloud–ammonia coincidences and the microwave reconciliation would not follow.
What would settle it
A concrete test: measure the ammonia vertical profile between 0.5 and 3 bar with a limb-sounding or radio instrument at about 0.1-bar resolution. If ammonia is found to increase monotonically with depth (a single smooth gradient) rather than showing a plateau between the two cloud bases, the two-step profile that underpins the cloud–ammonia link and the deep-abundance reconciliation would be contradicted.
If this is right
- Jupiter's visible cloud deck is located at 1–2 bar, deeper than the commonly assumed ammonia condensation level near 0.7 bar; cloud-tracking and wind-shear studies should assign main cloud features to these deeper pressures.
- No separate detached photochemical haze is required: reflectivity variations seen in methane-absorbing bands are explained by the opacity and vertical extent of the thin upper cloud (Cloud-2).
- Belt/zone differences in 5-μm brightness are mostly due to changes in the single-scattering albedo of the lower-cloud particles, with cloud opacity playing a secondary role.
- Deep ammonia abundances retrieved from visible/near-IR spectra are consistent with Juno/MWR and VLA determinations when a two-step ammonia profile is adopted, resolving a previous factor-of-1.5 discrepancy.
- The upper cloud's spectral properties are consistent with hybrid ammonia-ice particles (not pure ammonia ice), implying that ammonia ice clouds are widespread but optically thin and mixed with other 3-μm-absorbing materials.
Where Pith is reading between the lines
- The paper's 'intimate link' between ammonia and clouds is installed by the parameterization rather than recovered from the data; a testable extension is to run retrievals with a smooth ammonia profile (no two-step structure) and see whether the 0.9–2.5 μm spectra degrade, which would confirm that the two-step shape is actually required.
- If the model is correct, the 1–2 bar 'Cloud-1' must contain a water-ice-like component despite water's expected condensation at 5–7 bar; this implies efficient vertical lofting or a water–ammonia mixture such as 'mushballs,' a prediction that could be tested by searching for weak water absorption features at 2.7 μm or in the 5-μm window with higher signal-to-noise observations.
- The upper 'haze' being reinterpreted as convective ammonia-ice cirrus implies discrete, temporally varying cloud features; time-series imaging at methane bands (e.g., from JWST or future missions) could look for convective clumps and their evolution, which would distinguish this from a static photochemical haze.
- The deep ammonia abundances retrieved in the EZ (∼500 ppm) are notably higher than earlier visible-light estimates; applying the same two-step ammonia parameterization to independent datasets such as JWST/MIRI or ALMA would provide a strong cross-check of the reconciliation with microwave results.
Editorial analysis
A structured set of objections, weighed in public.
Referee Report
Summary. This paper presents a combined cloud/ammonia retrieval model for Jupiter's equatorial atmosphere (EZ, NEB, NEDF) fitted simultaneously to VLT/MUSE (0.48–0.93 μm), Cassini/VIMS (0.35–5.15 μm), IRTF/SpeX (0.8–2.5 μm), and Juno/JIRAM-SPE (2.0–5.0 μm) observations. The model has three aerosol components: a thick lower cloud (Cloud-1, r≈10 μm) at 1–2 bar, a thin upper cloud (Cloud-2, r≈10 μm) at ~0.55 bar with a 3-μm absorption, and a blue-absorbing chromophore (r≈0.2 μm) embedded in Cloud-1. The NH3 profile is parameterized as a two-step profile, with a drop at the Cloud-1 base and saturation at the Cloud-2 base. The authors report good fits (χ²/n = 1.4–3.5) across 0.48–5.2 μm and claim that no separate photochemical haze is required, that the main cloud deck lies at 1–2 bar rather than ~0.7 bar, and that the retrieved deep ammonia abundances are consistent with Juno/MWR and VLA determinations.
Significance. If the retrieved structure is correct, the paper would resolve a long-standing discrepancy between cloud-top pressures derived from visible/near-IR spectroscopy and those assumed from ammonia condensation theory, and it would reconcile visible-wavelength deep NH3 estimates with microwave values. The methodological strengths are substantial: the use of line-by-line look-up tables instead of correlated-k approximations, the combination of four independent datasets over a very broad spectral range, the public availability of code and calibrated VIMS data, and the transparent reporting of priors, fixed parameters, and formal retrieval errors in Table 1. However, as discussed below, several of the paper's headline interpretive claims are not independently recovered from the data but are built into the adopted parameterization.
major comments (4)
- [§5.2 (Cloud-2 base definition)] The 'intimate link' between the ammonia profile and the cloud structure is installed by the parameterization, not demonstrated. The text states that the NH3 mole fraction 'was assumed to have a deep value, then drop to an intermediate value at pressure ∼1−2 bar' with Cloud-1 'based at this level', and that Cloud-2's base was 'set to this condensation pressure' computed from the fitted mid-level NH3 and the assumed T-p profile. Consequently, conclusions (ii) and (v) in §7 — that Cloud-1 coincides with an ammonia drop and Cloud-2 with the condensation level — are tautological for this model. A fit using this coupled parameterization cannot be used as evidence for the link. I recommend either a decoupled retrieval (allowing the NH3 step pressure and Cloud-1 base to vary independently, and treating Cloud-2's base as a free parameter with a wider prior, or varying T(p)) or at least a sensitiv
- [§5.2 / Table 1] Several fixed inputs are load-bearing for the central model: the particle radii (10/10/0.2 μm), the chromophore base pressure (1.25 bar), the PH3 knee pressure (1.0 bar) and fractional scale height (0.3), and the water profile. The paper acknowledges degeneracies and defers a nested-sampling exploration to future work, but the conclusions include specific particle sizes and compositions (e.g., 'possibly consistent with water ice', 'possibly consistent with ammonia ice'). Without at least a limited sensitivity analysis — for example, varying PH3 knee, particle radius, and chromophore pressure for one representative region — the reader cannot know whether the retrieved n_imag spectra and the 'no separate photochemical haze' conclusion are robust or artefacts of the chosen priors. This is especially critical because the PH3 profile is known to couple strongly to aerosol opacity at p<1 bar.
- [§5.2 ('forward-modelling error')] The quoted goodness-of-fit is with respect to hand-set error bars: the spectral radiance errors were 'set to either 0.9% of the reflected sunlight from a perfect Lambertian scatterer, or a brightness temperature error of 0.75 K, whichever was larger', explicitly to incorporate forward-modelling uncertainty. With these inflated errors, χ²/n = 1.4–3.5. This means the model does not fit the data to within the actual measurement noise; the 'consistent with observations' claim in the abstract is therefore weaker than it appears. The paper should state this more explicitly in the abstract and conclusions, and ideally show residuals against the true measurement noise in at least one figure so the reader can assess the real quality of fit.
- [§5.2.3 / Table 1] The claimed reconciliation with Juno/MWR and VLA deep NH3 determinations is only weakly supported in the EZ. The two-angle EZ retrieval gives NH3(d) = 1847±1067 ppm with a 58% relative error, barely consistent with the ~340 ppm MWR/VLA value at the 1.4σ level. The NEB constraint of 134±38 ppm is better, but the EZ is the archetypal zone region discussed in the abstract. In light of the large posterior uncertainty, conclusion (v) should be tempered, or the deep NH3 retrieval made more robust (e.g., by including additional 5-μm window data that probes depths below Cloud-1).
minor comments (5)
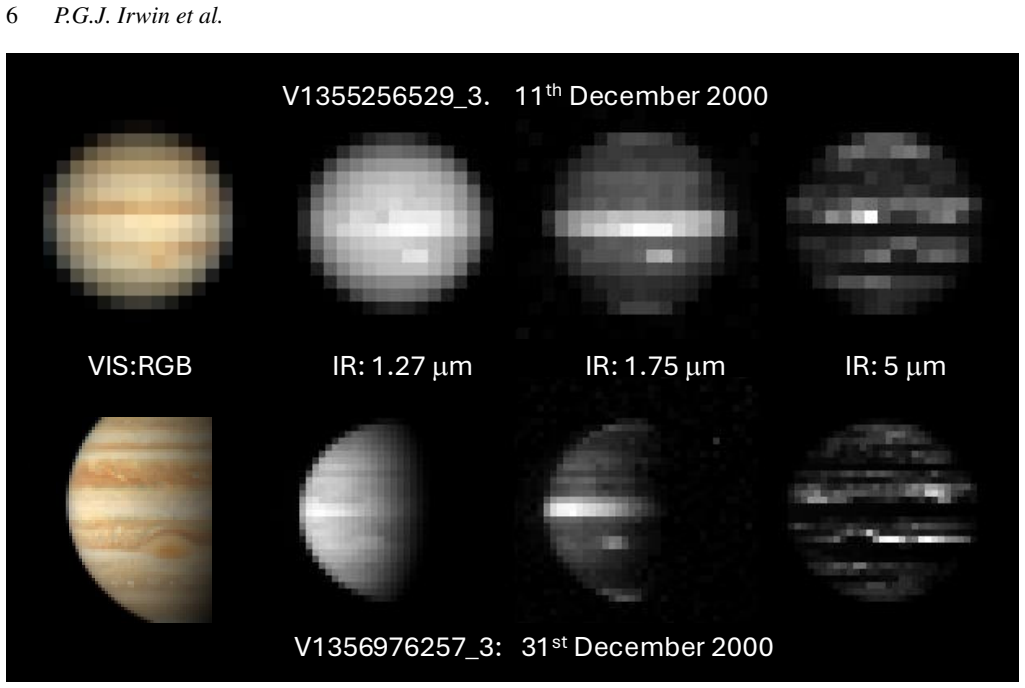
- [Fig. 2 caption] The heading 'No Gamma Gamma' in the reconstructed true-colour image appears to be either a typo or a placeholder and should be corrected.
- [Appendix D] Typo: 'upper haze layer andand at deeper levels' should read 'upper haze layer and at deeper levels'.
- [§4.3] Typo: 'exactlymirror' should be 'exactly mirror'.
- [Table 1 note] The table lists 'chromophore layer base presure' — 'presure' should be 'pressure'. Also, the note explaining that the errors are formal retrieval errors, not measurement noise, could be more prominent.
- [§5.2] The phrase 'forward-modelling error' is used to describe the 0.9%/0.75 K error bars, but it is not defined in the model setup. A short definition or reference would help the reader understand why this value was chosen.
Circularity Check
Cloud–ammonia 'intimate link' is installed by the Section 5.2 parameterization: the NH3 drop is placed at Cloud-1's base, and Cloud-2's base is computed from NH3 saturation. Partial circularity, not total.
specific steps
-
self definitional
[Section 5.2, 'Retrievals of typical combined EZ, NEB and NEDF spectra']
"The ammonia mole fraction profile was assumed to have a deep value, then drop to an intermediate value at pressure ∼1−2 bar. This pressure was determined by the retrieval model and a lower cloud, 'Cloud-1', based at this level, with a fixed fractional scale height of 0.25 above."
The NH3 profile's drop pressure is the same fitted value as Cloud-1's base pressure. The abstract and Conclusion (ii) then report 'the lower cloud coinciding with an initial drop in ammonia abundance' as a finding, but this coincidence is true by construction: the retrieval was set up so that the ammonia drop occurs exactly at Cloud-1's base. The data can constrain the common pressure, but cannot test whether a drop and a cloud base actually coincide independently.
-
self definitional
[Section 5.2 and Table 1 note; also Conclusion (ii)]
"The ammonia mole fraction was then held at a fitted intermediate value above this cloud until the pressure was low enough that the partial pressure exceeded the saturated vapour pressure, calculated from our reference temperature-pressure profile. The base of a second upper cloud, 'Cloud-2', was set to this condensation pressure... Table 1: 'There is no listed error for p2 as this is computed from NH3(m) and the assumed temperature-pressure profile.'"
Cloud-2's base pressure p2 is not retrieved from the spectra; it is computed from the fitted mid-level NH3 mixing ratio and the assumed Irwin (2009) T(p) profile. The claim that the upper cloud 'coincides with the ammonia condensation level' is therefore an input identity, not an independent result. The retrieval cannot decide whether an independently placed upper-cloud base would sit at the NH3 saturation level; it is forced to sit there by the parameterization.
full rationale
The spectral fitting itself is largely self-contained: cloud opacities, the common Cloud-1/NH3-step pressure, mid/deep NH3 abundances, trace-gas abundances, and the n_imag spectra are all genuinely fitted to the combined 0.48–5.15 μm datasets, and the paper checks against external VIMS and JIRAM calibrations. The circularity is concentrated in the 'intimate link' between clouds and ammonia: the Section 5.2 parameterization forces the NH3 drop to coincide with Cloud-1's base and forces Cloud-2's base to equal the NH3 saturation pressure of the fitted mid-level NH3. The abstract's and Conclusion (ii)'s phrasing presents these coincidences as discoveries, when they are definitional outputs of the adopted retrieval model. The paper is partly transparent about this—it says the profile 'was assumed' and defers Nested Sampling to explore degeneracies—but the central coincidences are still over-sold as findings. I therefore assign a partial circularity score of 6 rather than higher, because the deep/mid ammonia abundances, cloud opacities, and spectral properties are not circularly derived and retain independent content.
Axiom & Free-Parameter Ledger
free parameters (13)
- Cloud-1 opacity τ1 (1.5 μm) =
6.2–121 (per region)
- Cloud-1 base pressure p1 =
1.55–2.15 bar
- Cloud-2 opacity τ2 =
0.83–2.15
- Cloud-2 fractional scale height f2 =
0.24–0.39
- Chromophore opacity τ3 =
0.11–0.38
- n_imag spectra of Cloud-1, Cloud-2, chromophore =
retrieved pointwise over 0.4–5.2 μm
- NH3 deep mole fraction =
134–1847 ppm (EZ 497±117; two-angle EZ 1847±1067)
- NH3 mid-level mole fraction =
27.1–61.4 ppm
- Cloud particle sizes and variances (r=10, 10, 0.2 μm) =
fixed, not fitted
- Chromophore base pressure 1.25 bar =
fixed
- Forward-modelling error 0.9% / 0.75 K =
hand-set
- PH3 deep abundance =
0.26–10.4 ppm
- H2O deep abundance =
3.3–8.9 ppm
axioms (8)
- domain assumption Temperature-pressure profile fixed to Irwin (2009)/CIRS reference; no temperature retrieval
- domain assumption Mie theory for spherical particles with gamma size distributions
- standard math Kramers-Kronig relation connects retrieved n_imag to n_real
- ad hoc to paper Two-step ammonia parameterization with drop at Cloud-1 base and saturation at Cloud-2 base
- domain assumption Fixed gas deep abundances (He, CH4, H2O, H2S at ECCM profile)
- domain assumption Fixed PH3 profile shape (knee at 1.0 bar, FSH 0.3)
- domain assumption Nightside thermal emission equals dayside thermal emission in the EZ day–night subtraction
- domain assumption Accuracy of line data (HITRAN2022, ExoMOL, TheoReTS, Karkoschka & Tomasko 2010)
read the original abstract
We present a combined cloud/ammonia model for Jupiter's equatorial atmosphere from 0.1 to 10 bar, consistent with observations made at a range of observation geometries from 0.35 to 5.15 $\mu$m by VLT/MUSE, Cassini/VIMS, IRTF/SpeX and Juno/JIRAM. Our cloud model has three components: 1) an optically-thick lower cloud (radius $r$$\sim$$10$ $\mu$m) at 1-2 bar; 2) an optically-thin upper cloud ($r$$\sim$$10$ $\mu$m) at $\sim$0.55 bar; and 3) a layer of blue-absorbing chromophore particles ($r$$\sim$$0.2$ $\mu$m) situated within the main lower cloud. The ammonia profile is intimately linked with the cloud profile with the lower cloud coinciding with an initial drop in ammonia abundance and the upper cloud coinciding with the ammonia condensation level. The large lower cloud particles are highly scattering at visible wavelengths, allowing sunlight to scatter through the clouds and be Rayleigh-scattered from the deep atmosphere. At 5 $\mu$m, the lower cloud particles are found to be more absorbing, with the belt/zone differences mostly accounted for by changes in the single-scattering albedo of these particles and secondarily by changes in the cloud opacity. The spectral properties of these lower cloud particles are possibly consistent with a component of water ice. The upper cloud particles need a distinct absorption band near 3 $\mu$m, possibly consistent with a component of ammonia ice. We note that we do not need a separate upper-level photochemical haze in our model. Instead, we find that the features seen at methane-absorbing wavelengths are caused by variations in the opacity and vertical extent of the upper cloud layer.
Figures






Reference graph
Works this paper leans on
-
[1]
, year = 2006, month = feb, volume =
Photometric variability of Uranus and Neptune, 1950 2004. , year = 2006, month = feb, volume =. doi:10.1016/j.icarus.2005.09.009 , adsurl =
-
[2]
ApJS , year = 2026, doi =
A Processing Workflow for Cassini VIMS Jupiter Cubes. ApJS , year = 2026, doi =
2026
-
[3]
Anderson, J. A. and Sides, S. C. and Soltesz, D. L. and Sucharski, T. L. and Becker, K. J. , year =. Modernization of the. Lunar and Planetary Science Conference , volume =
-
[4]
and Irwin, P
Anguiano-Arteaga, A. and Irwin, P. G. J. and Perez-Hoyos, S. and Grassi, D. and D'Aversa, E. , title =. 2026 , publisher =
2026
-
[5]
, title =
Filacchione, G. , title =. 2006 , address =
2006
-
[6]
Pence, W. D. and Chiappetti, L. and Page, C. G. and Shaw, R. A. and Stobie, E. , year =. Definition of the. Astronomy & Astrophysics , volume =
-
[7]
Sromovsky, L. A. and Baines, K. H. and Fry, P. M. and Carlson, R. W. , year =. A Possibly Universal Red Chromophore for Modeling Color Variations on. Icarus , volume =
-
[8]
Alexander, C. L. B. and Irwin, P. G. J. and Braude A. S. and Dahl, E. , year =. New determination of the vertical structure of cloud and haze in Jupiter’s atmosphere from VLT/MUSE dual viewing angle observations in the visible/near-IR. , volume =
-
[9]
Journal of Geophysical Research (Planets) , keywords =
Temporal Variations in Vertical Cloud Structure of Jupiter's Great Red Spot, Its Surroundings and Oval BA From HST/WFC3 Imaging. Journal of Geophysical Research (Planets) , keywords =. doi:10.1029/2022JE007427 , adsurl =
-
[10]
Journal of Geophysical Research (Planets) , keywords =
The Thermal Structure and Composition of Jupiter's Great Red Spot From JWST/MIRI. Journal of Geophysical Research (Planets) , keywords =. doi:10.1029/2024JE008415 , adsurl =
-
[11]
, year = 2025, month = apr, volume =
Evidence of pure ammonia clouds in Jupiter's Northern Temperate domain from Juno/JIRAM infrared spectral data. , year = 2025, month = apr, volume =. doi:10.1093/mnras/staf381 , adsurl =
-
[12]
Microphysical model of Jupiter's Great Red Spot upper chromophore haze. , keywords =. doi:10.1016/j.icarus.2026.117008 , archivePrefix =. 2602.14911 , primaryClass =
arXiv 2026
-
[13]
Nature Astronomy , year = 2023, month = dec, volume =
An intense narrow equatorial jet in Jupiter's lower stratosphere observed by JWST. Nature Astronomy , year = 2023, month = dec, volume =. doi:10.1038/s41550-023-02099-2 , adsurl =
-
[14]
Journal of Geophysical Research (Atmospheres) , keywords =
Optical constants of ice from the ultraviolet to the microwave: A revised compilation. Journal of Geophysical Research (Atmospheres) , keywords =. doi:10.1029/2007JD009744 , adsurl =
-
[15]
Journal of Geophysical Research (Planets) , year = 2025, month = jan, volume =
Clouds and Ammonia in the Atmospheres of Jupiter and Saturn Determined From a Band-Depth Analysis of VLT/MUSE Observations. Journal of Geophysical Research (Planets) , year = 2025, month = jan, volume =. doi:10.1029/2024JE008622 , adsurl =
-
[16]
On the clouds and ammonia in Jupiter's upper troposphere from Juno JIRAM reflectivity observations. , keywords =. doi:10.1093/mnras/stab740 , adsurl =
-
[17]
Space Mission Operations and Ground Data Systems , year = 1994, editor =
Galileo mission planning for Low Gain Antenna based operations. Space Mission Operations and Ground Data Systems , year = 1994, editor =
1994
-
[18]
JIRAM, the Jovian Infrared Auroral Mapper. , keywords =. doi:10.1007/s11214-014-0094-y , adsurl =
-
[19]
Microwave observations reveal the deep extent and structure of Jupiter s atmospheric vortices. Science , keywords =. doi:10.1126/science.abf1015 , adsurl =
-
[20]
, year = 2005, month = mar, volume =
Dynamical implications of Jupiter's tropospheric ammonia abundance. , year = 2005, month = mar, volume =. doi:10.1016/j.icarus.2004.10.004 , adsurl =
-
[21]
Jupiter's ammonia distribution derived from VLA maps at 3-37 GHz. , keywords =. doi:10.1016/j.icarus.2018.11.024 , archivePrefix =. 1902.07294 , primaryClass =
Pith/arXiv arXiv 2018
-
[22]
Peering through Jupiter s clouds with radio spectral imaging. Science , keywords =. doi:10.1126/science.aaf2210 , adsurl =
-
[23]
Identification of the 10- m ammonia ice feature on Jupiter. , keywords =. doi:10.1016/j.pss.2003.06.005 , adsurl =
-
[24]
, year = 2005, month = dec, volume =
The cloud structure of the jovian atmosphere as seen by the Cassini/CIRS experiment. , year = 2005, month = dec, volume =. doi:10.1016/j.icarus.2005.06.020 , adsurl =
-
[25]
, year = 2010, month = jul, volume =
Thermal structure and composition of Jupiter s Great Red Spot from high-resolution thermal imaging. , year = 2010, month = jul, volume =. doi:10.1016/j.icarus.2010.01.005 , adsurl =
-
[26]
, year = 2013, month = sep, volume =
Analysis of Saturn s thermal emission at 2.2-cm wavelength: Spatial distribution of ammonia vapor. , year = 2013, month = sep, volume =. doi:10.1016/j.icarus.2013.06.017 , adsurl =
-
[27]
Nature Communications , keywords =
A hexagon in Saturn's northern stratosphere surrounding the emerging summertime polar vortex. Nature Communications , keywords =. doi:10.1038/s41467-018-06017-3 , archivePrefix =. 1809.00572 , primaryClass =
-
[28]
Meteorology of Jupiter's equatorial hot spots and plumes from Cassini. , keywords =. doi:10.1016/j.icarus.2013.02.001 , archivePrefix =. 1302.0277 , primaryClass =
Pith/arXiv arXiv 2013
-
[29]
Earth and Space Science , keywords =
Angular Dependence and Spatial Distribution of Jupiter's Centimeter-Wave Thermal Emission From Juno's Microwave Radiometer. Earth and Space Science , keywords =. doi:10.1029/2020EA001254 , adsurl =
-
[30]
Mid-infrared mapping of Jupiter's temperatures, aerosol opacity and chemical distributions with IRTF/TEXES. , keywords =. doi:10.1016/j.icarus.2016.06.008 , archivePrefix =. 1606.05498 , primaryClass =
Pith/arXiv arXiv 2016
-
[31]
Journal of Geophysical Research (Planets) , keywords =
On the Spatial Distribution of Minor Species in Jupiter's Troposphere as Inferred From Juno JIRAM Data. Journal of Geophysical Research (Planets) , keywords =. doi:10.1029/2019JE006206 , adsurl =
-
[32]
Changing Characteristics of Jupiter's Little Red SPOT. , keywords =. doi:10.1088/0004-6256/135/6/2446 , adsurl =
-
[33]
Ammonia abundance in Jupiter's atmosphere derived from the attenuation of the Galileo probe's radio signal. , keywords =. doi:10.1029/98JE01635 , adsurl =
-
[34]
Analysis of Jupiter North Equatorial Belt hot spots in the 4-5- m range from Galileo/near-infrared mapping spectrometer observations: Measurements of cloud opacity, water, and ammonia. , keywords =. doi:10.1029/98JE01049 , adsurl =
-
[35]
, year = 1999, month = oct, volume =
A comparison of the atmospheres of Jupiter and Saturn: deep atmospheric composition, cloud structure, vertical mixing, and origin. , year = 1999, month = oct, volume =. doi:10.1016/S0032-0633(99)00047-1 , adsurl =
-
[36]
Cyclic expansions & planetary waves
Jupiter's North Equatorial Belt & Jet I. Cyclic expansions & planetary waves. Journal of the British Astronomical Association , year = 2019, month = feb, volume =
2019
-
[37]
Temperatures, Winds, and Composition in the Saturnian System. Science , keywords =. doi:10.1126/science.1105806 , adsurl =
-
[38]
Earth and Space Science , keywords =
Spatial Variations of Jovian Tropospheric Ammonia via Ground-Based Imaging. Earth and Space Science , keywords =. doi:10.1029/2024EA003562 , archivePrefix =. 2311.16422 , primaryClass =
-
[39]
The visual spectrum of Jupiter's Great Red Spot accurately modeled with aerosols produced by photolyzed ammonia reacting with acetylene. , keywords =. doi:10.1016/j.icarus.2019.04.008 , adsurl =
-
[40]
Fresh Ammonia Ice Clouds in Jupiter. I. Spectroscopic Identification, Spatial Distribution, and Dynamical Implications. , year = 2002, month = sep, volume =. doi:10.1006/icar.2002.6901 , adsurl =
arXiv 2002
-
[41]
, year = 1998, month = sep, volume =
Jupiter's Cloud Structure from Galileo Imaging Data. , year = 1998, month = sep, volume =. doi:10.1006/icar.1998.5985 , adsurl =
arXiv 1998
-
[42]
, year = 2006, month = oct, volume =
Scattering properties and location of the jovian 5-micron absorber from Galileo/NIMS limb-darkening observations. , year = 2006, month = oct, volume =. doi:10.1016/j.jqsrt.2006.02.074 , adsurl =
-
[43]
Cloud structure and atmospheric composition of Jupiter retrieved from Galileo near-infrared mapping spectrometer real-time spectra. , keywords =. doi:10.1029/98JE00948 , adsurl =
-
[44]
, year = 2002, month = mar, volume =
The Retrieval of Cloud Structure Maps in the Equatorial Region of Jupiter Using a Principal Component Analysis of Galileo/NIMS Data. , year = 2002, month = mar, volume =. doi:10.1006/icar.2001.6773 , adsurl =
arXiv 2002
-
[45]
, year = 2001, month = feb, volume =
The Origin of Belt/Zone Contrasts in the Atmosphere of Jupiter and Their Correlation with 5- m Opacity. , year = 2001, month = feb, volume =. doi:10.1006/icar.2000.6542 , adsurl =
arXiv 2001
-
[46]
An introduction to their physics and chemistry
Theory of planetary atmospheres. An introduction to their physics and chemistry. 2nd Edition
-
[47]
A rotation-vibration line list for hot ammonia
ExoMol molecular line lists - XXXV. A rotation-vibration line list for hot ammonia. , keywords =. doi:10.1093/mnras/stz2778 , archivePrefix =. 1911.10369 , primaryClass =
Pith/arXiv arXiv 1911
-
[48]
, year = 2002, month = jan, volume =
A far wing lineshape for H2 broadened CH4 infrared transitions. , year = 2002, month = jan, volume =. doi:10.1016/S0022-4073(01)00058-9 , adsurl =
-
[49]
The Infrared Telescope Facility (IRTF) Spectral Library: Cool Stars. , keywords =. doi:10.1088/0067-0049/185/2/289 , archivePrefix =. 0909.0818 , primaryClass =
-
[50]
, year = 1991, month = may, volume =
A description of the correlated-k distribution method for modelling nongray gaseous absorption, thermal emission, and multiple scattering in vertically inhomogeneous atmospheres. , year = 1991, month = may, volume =. doi:10.1029/90JD01945 , adsurl =
-
[51]
Analysis of gaseous ammonia (NH _ 3 ) absorption in the visible spectrum of Jupiter - Update. , keywords =. doi:10.1016/j.icarus.2018.12.008 , adsurl =
-
[52]
Analysis of gaseous ammonia (NH _ 3 ) absorption in the visible spectrum of Jupiter. , keywords =. doi:10.1016/j.icarus.2017.11.031 , archivePrefix =. 1812.05383 , primaryClass =
Pith/arXiv arXiv 2017
-
[53]
Planetary Science Journal , keywords =
Ammonia Abundance Derived from Juno MWR and VLA Observations of Jupiter. Planetary Science Journal , keywords =. doi:10.3847/PSJ/acaf6b , archivePrefix =. 2209.03513 , primaryClass =
-
[54]
The distribution of ammonia on Jupiter from a preliminary inversion of Juno microwave radiometer data. , keywords =. doi:10.1002/2017GL073159 , adsurl =
-
[55]
Evidence for Multiple Ferrel-Like Cells on Jupiter. , keywords =. doi:10.1029/2021GL095651 , archivePrefix =. 2110.07255 , primaryClass =
-
[56]
Journal of Geophysical Research (Planets) , keywords =
Jupiter's Temperate Belt/Zone Contrasts Revealed at Depth by Juno Microwave Observations. Journal of Geophysical Research (Planets) , keywords =. doi:10.1029/2021JE006858 , archivePrefix =. 2110.14620 , primaryClass =
-
[57]
Journal of Geophysical Research (Planets) , keywords =
Jupiter's Equatorial Plumes and Hot Spots: Spectral Mapping from Gemini/TEXES and Juno/MWR. Journal of Geophysical Research (Planets) , keywords =. doi:10.1029/2020JE00639910.1002/essoar.10502118.1 , adsurl =
-
[58]
, pages =
Colour and cloud structure in the atmospheres of the giant planets , volume =. , pages =. 2019 , series =
2019
-
[59]
, year = 2013, month = jul, volume =
Saturn's cloud structure inferred from Cassini ISS. , year = 2013, month = jul, volume =. doi:10.1016/j.icarus.2013.03.015 , adsurl =
-
[60]
Explaining the Juno Observations
Storms and the Depletion of Ammonia in Jupiter: II. Explaining the Juno Observations. Journal of Geophysical Research (Planets) , keywords =. doi:10.1029/2020JE00640410.1002/essoar.10502179.1 , adsurl =
-
[61]
Journal of Geophysical Research (Planets) , keywords =
Saturn's Atmosphere in Northern Summer Revealed by JWST/MIRI. Journal of Geophysical Research (Planets) , keywords =. doi:10.1029/2023JE007924 , archivePrefix =. 2309.06052 , primaryClass =
-
[62]
Planetary Science Journal , keywords =
Vertical Structure and Color of Jovian Latitudinal Cloud Bands during the Juno Era. Planetary Science Journal , keywords =. doi:10.3847/PSJ/abd400 , archivePrefix =. 2012.06740 , primaryClass =
Pith/arXiv arXiv 2012
-
[63]
Colour and tropospheric cloud structure of Jupiter from MUSE/VLT: Retrieving a universal chromophore. , keywords =. doi:10.1016/j.icarus.2019.113589 , archivePrefix =. 1912.00918 , primaryClass =
arXiv 2019
-
[64]
A method for the determination of abundance ratios in the outer planets Application to Jupiter. , keywords =. doi:10.1016/0019-1035(79)90096-4 , adsurl =
-
[65]
, year = 1998, month = may, volume =
Methane, Ammonia, and Temperature Measurements of the Jovian Planets and Titan from CCD-Spectrophotometry. , year = 1998, month = may, volume =. doi:10.1006/icar.1998.5913 , adsurl =
arXiv 1998
-
[66]
, keywords =
What Color Is the Solar System?. , keywords =
-
[67]
Thermal imaging of Uranus: Upper-tropospheric temperatures one season after Voyager. , keywords =. doi:10.1016/j.icarus.2015.07.004 , adsurl =
-
[68]
Spectrophotometry of the Jovian Planets and Titan at 300- to 1000-nm Wavelength: The Methane Spectrum. , keywords =. doi:10.1006/icar.1994.1139 , adsurl =
arXiv 1994
-
[69]
The composition of the Jovian atmosphere as determined by the Galileo probe mass spectrometer. , keywords =. doi:10.1029/98JE01050 , adsurl =
-
[70]
Uranus in Northern Midspring: Persistent Atmospheric Temperatures and Circulations Inferred from Thermal Imaging. , keywords =. doi:10.3847/1538-3881/ab5dc7 , archivePrefix =. 1911.12830 , primaryClass =
Pith/arXiv arXiv 1911
-
[71]
, year = 2013, month = sep, volume =
Stratospheric aerosols on Jupiter from Cassini observations. , year = 2013, month = sep, volume =. doi:10.1016/j.icarus.2013.05.020 , adsurl =
-
[72]
The HITRAN2020 molecular spectroscopic database. , keywords =. doi:10.1016/j.jqsrt.2021.107949 , adsurl =
arXiv 2021
-
[73]
, year = 2001, month = dec, volume =
Color and the Vertical Structure in Jupiter's Belts, Zones, and Weather Systems. , year = 2001, month = dec, volume =. doi:10.1006/icar.2001.6742 , adsurl =
arXiv 2001
-
[74]
Investigating temporal changes in Jupiter's aerosol structure with rotationally-averaged 2015-2020 HST WFC3 images. , keywords =. doi:10.1016/j.icarus.2022.115224 , adsurl =
arXiv 2015
-
[75]
Journal of Geophysical Research (Planets) , year = 2021, month = nov, volume =
Vertical Distribution of Aerosols and Hazes Over Jupiter's Great Red Spot and Its Surroundings in 2016 From HST/WFC3 Imaging. Journal of Geophysical Research (Planets) , year = 2021, month = nov, volume =. doi:10.1029/2021JE006996 , adsurl =
-
[76]
Color and aerosol changes in Jupiter after a North Temperate Belt disturbance. , keywords =. doi:10.1016/j.icarus.2020.114031 , adsurl =
arXiv 2020
-
[77]
Aerosols and Water Ice in Jupiter s Stratosphere from UV-NIR Ground-based Observations. , keywords =. doi:10.3847/1538-3881/aadcef , adsurl =
-
[78]
Collision-induced Infrared Spectra of H2-He Pairs at Temperatures from 18 to 7000 K. II. Overtone and Hot Bands. , keywords =. doi:10.1086/167515 , adsurl =
-
[79]
Modeling of pressure-induced far-infrared absorption spectra Molecular hydrogen pairs. , keywords =. doi:10.1086/163482 , adsurl =
-
[80]
Collision-induced Infrared Spectra of H2-He Pairs Involving 0 - 1 Vibrational Transitions and Temperatures from 18 to 7000 K. , keywords =. doi:10.1086/167027 , adsurl =
discussion (0)
Sign in with ORCID, Apple, or X to comment. Anyone can read and Pith papers without signing in.