REVIEW 4 major objections 5 minor 28 references
Bayesian Localization and Uncertainty Quantification of Trace Species in Two-Dimensional SIMS Imaging
T0 review · 4 major / 5 minor · reviewed 2026-08-14 · deepseek-v4-flash
Pith's one-line read This paper claims that a Bayesian model of SIMS images as Gaussian blobs plus Poisson noise can localize trace species to submicrometer accuracy and attach rigorous uncertainties to every position.
desk verdict Competent Bayesian localization framework for SIMS with real SEM-referenced data, but the headline accuracy numbers rest on unquantified registration error and the synthetic check is circular. read the letter →
The pith
A machine-rendered reading of the paper's core claim, the machinery that carries it, and where it could break.
The reading
What carries the argument
The load-bearing object is the forward model of Eq. (1): the latent signal at each pixel is a sum of two-dimensional Gaussian spread functions, each with an intensity $h_k$, center $(\mu_k,\nu_k)$, scale $a_k$, and anisotropy/orientation parameters $b_k$ and $c_k$. The observed counts are then modeled as Poisson draws from that latent signal (Eq. 3), producing the likelihood in Eq. (4). This machinery matters because the Poisson likelihood keeps the inference honest in the low-count regime where Gaussian-noise assumptions fail, while the Gaussian blobs provide a smooth, parameter-light description of beam-broadened signals; replica-exchange Monte Carlo then explores the resulting posterior, and the MAP parameter set gives the localized position while the sampled chains give its uncertainty. The one-component-per-ROI version ($K=1$) is what is used for the experimental demonstrations.
What would settle it
Generate a synthetic SIMS image with a known non-Gaussian point-spread function, or add a constant background and spatially correlated noise, then run the proposed framework and check whether the posterior intervals for the positions cover the true positions at their nominal rates; the Gaussian/Poisson premise fails if coverage drops noticeably below the stated probability or the errors become systematic.
Extended reading notes
Core claim
On its own terms, the paper establishes that a Bayesian forward model—each trace species contributes a two-dimensional Gaussian spread function and each pixel count follows a Poisson distribution—lets one estimate both the positions of trace species and their uncertainties from images with very few detected ions. The posterior distributions sampled by replica-exchange Monte Carlo are shown to be unimodal and concentrated near the SEM-derived reference positions, with interquartile ranges on the order of 100 nm, and the reference position typically falls inside or near the central 50 percent credible interval. The quantitative headline result is that for the smallest features tested (0.4 µm gold dots), the mean localization error dropped from 511 nm (5.1 percent of the 10 µm dot spacing) to 194 nm (1.9 percent) when measurement conditions were optimized, demonstrating submicrometer localization accuracy with statistically rigorous uncertainty quantification.
Load-bearing premise
The whole inference rests on the assumption that each trace species actually appears as a two-dimensional Gaussian blob and that pixel counts are independent Poisson draws with no background and no correlated noise; if the true point-spread function is non-Gaussian or the noise is correlated, the posterior centers and their error bars will be biased.
Editorial extensions
If this is right
- Localization accuracy in low-count SIMS can be improved without changing the instrument simply by tuning measurement parameters such as beam current, raster size, and pixel resolution, and the same Bayesian error bars provide a quantitative metric for that tuning.
- Accumulating multiple acquisition cycles tightens the posterior and reduces localization error, so the framework gives a principled guide to how many cycles are worth taking.
- Because the forward model is a superposition of Gaussians, the method extends directly to overlapping signals by increasing the number of components $K$, with Bayesian model selection available through the free energy.
- The posterior width itself is a valid estimate of localization uncertainty: the IQRs track the observed errors, which means downstream processes such as failure analysis or impurity mapping can propagate position uncertainty instead of assuming point locations.
Reading between the lines
- The same Poisson-plus-Gaussian Bayesian recipe should transfer almost unchanged to other counting-limited imaging modalities, such as Time-of-Flight SIMS, NanoSIMS, or single-molecule fluorescence, since nothing in the formalism is specific to the particular spectrometer used here.
- The consistently larger experimental than synthetic errors, especially for the 0.5 µm dots, hint that registration uncertainty in the SEM reference positions, rather than imaging statistics alone, may be a dominant error source; a joint registration-and-localization model would be a natural next step.
- A testable prediction follows from the model: for a fixed true position, the posterior width should scale roughly inversely with the square root of the accumulated ion count, so experiments that vary dwell time could confirm or refute the Poisson noise model directly.
Editorial analysis
A structured set of objections, weighed in public.
Referee Report
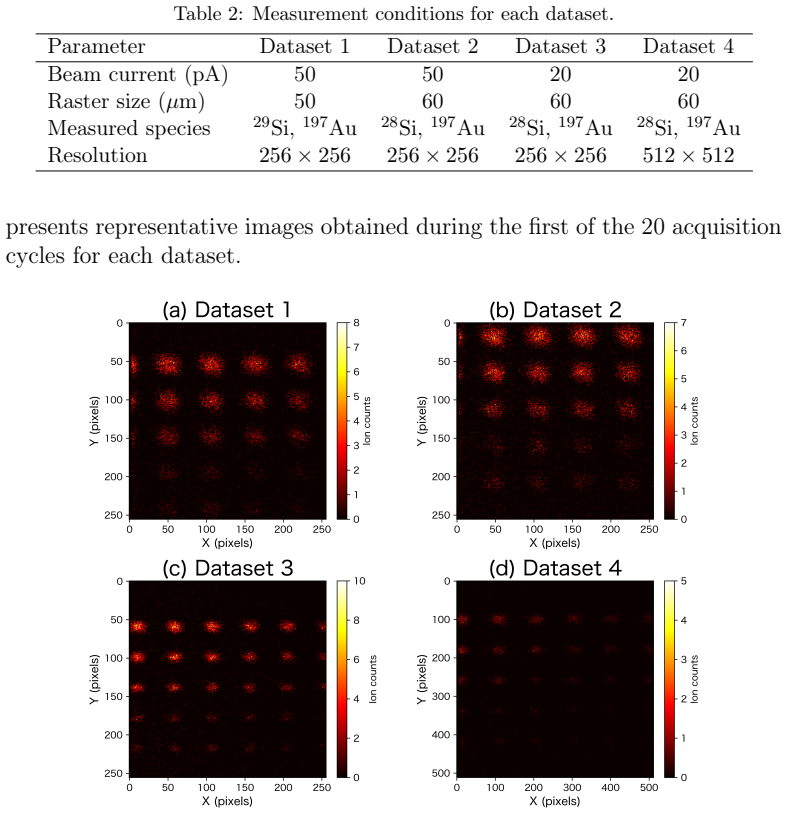
Summary. The paper proposes a Bayesian framework for localizing trace species in two-dimensional SIMS imaging. The latent signal is modeled as a sum of two-dimensional Gaussian spread functions (Eq. 1), pixel counts are modeled as independent Poisson variables (Eq. 3), uniform priors are placed on the parameters (Eqs. 9-10), and replica-exchange Monte Carlo (REMC) is used to sample the posterior. The MAP position estimates are compared with reference positions obtained from scanning electron microscopy (SEM) images registered to each SIMS image via a three-point affine transformation. The method is validated on synthetic data generated from the same forward model and on experimental SIMS images of Au dots with diameters from 0.4 to 2.0 um under four measurement conditions. The main quantitative result is that for 0.4 um dots the mean localization error decreased from 511.0 nm (Dataset 1) to 193.8 nm (Dataset 4), corresponding to a drop in relative error from 5.1% to 1.9%. The paper also reports posterior distributions, localization errors as a function of dot diameter, and the effect of accumulating multiple acquisition cycles.
Significance. If the reported accuracy is reliable, the framework would be a useful tool for uncertainty-aware localization in low-count SIMS imaging, a regime where centroid and least-squares methods are known to struggle. The paper's strengths are its explicit forward model, the use of a Poisson likelihood appropriate for low counts, the systematic comparison of four measurement conditions, and the attempt to validate against SEM-based reference positions. However, the central accuracy claim is currently tied to an unquantified image-registration uncertainty, the synthetic validation is circular by construction, the uncertainty-quantification claim is calibrated on a single example, and no comparison with simpler baseline methods is provided. These gaps are load-bearing for the paper's stated conclusions, so the manuscript requires substantial revision before the claims can be accepted.
major comments (4)
- [Section 2.2, Appendix A, Eq. (A.1), Eq. (15), Table 4] The reference positions (R_x,R_y) are obtained from an affine transformation estimated from only three manually selected corresponding point pairs, and the text acknowledges that these positions 'may contain small positional uncertainties arising from the alignment process' without quantifying or propagating that uncertainty. Every localization error d in Eq. (15) therefore includes the registration error in addition to the Bayesian estimator error, so the absolute errors and the headline reduction from 511.0 nm to 193.8 nm for the 0.4 um dots are not established until the registration uncertainty is characterized. Because the pixel sizes differ among datasets (Table 3), dataset-specific registration errors could plausibly contribute to the observed Dataset 1 versus Dataset 4 difference. Please quantify this uncertainty, for example by repeated manual point selection, leave-one-out checks, or a proper statistical model of the affine transformation, propagate it through Eq. (15), and report confidence intervals on the mean localization errors and on the difference between datasets.
- [Section 2.3 and Section 3.3] The synthetic datasets are generated using the same Gaussian-Poisson forward model (Eqs. (1) and (3)) that defines the likelihood used for inference. The synthetic experiments therefore test the internal consistency of the posterior sampler and the estimator, but they do not validate the adequacy of the forward model for real SIMS measurements. The statement in Section 3.3 that the synthetic/experimental agreement 'suggests that the proposed forward model provides a reasonable description of the SIMS signal generation process' overreaches. Please either reframe the synthetic analysis explicitly as a self-consistency and sampler validation, or generate additional synthetic data from perturbed, non-Gaussian, background-containing, or correlated-noise forward models so that the validation has external content.
- [Section 3.1 and Figure 6] The empirical calibration of the claimed uncertainty quantification is shown for only a single 0.4 um dot in a single acquisition cycle, with the reference position lying inside the IQR for μ_y but only near the IQR boundary for μ_x. This is anecdotal evidence, not a statistically rigorous calibration. To support the claim of quantitative posterior-based uncertainty estimates, report a coverage analysis over the full set of dots and cycles: for example, the fraction of reference positions falling within the 50% and 90% posterior credible intervals, and a comparison between posterior interval widths and observed squared localization errors.
- [Section 1, Section 3.2] The introduction identifies centroid estimation and least-squares Gaussian fitting as currently used localization methods, but the paper provides no quantitative comparison with these baselines on either the synthetic or experimental data. Without such a comparison it is unclear what the Bayesian framework adds for the isolated, non-overlapping dots considered here, and the claim of improved localization accuracy is not contextualized. Please add baseline results for the same datasets and report the same error metrics for those methods.
minor comments (5)
- [Eq. (14)] The displayed equation defines E(Θ) = E_N(Θ) - (1/N) log p(Θ), which is the normalized negative log-posterior, not the negative log-posterior as written in the preceding text; the normalization should be stated explicitly.
- [Section 2.3] The synthetic datasets are said to be 'the same' as those used in the companion study [18], but [18] is listed as a manuscript in preparation, so the synthetic generation is not fully reproducible from this paper alone; please provide the exact generation details or make the data and code available.
- [Figure 5] The caption says the posterior samples were obtained from 'EMC sampling,' while the method section and the rest of the text describe REMC; the terminology should be made consistent.
- [Table 4] The table reports means and ± values but does not state the number of dots per diameter or whether the ± values are standard deviations or standard errors; this information should be added to the table caption or text.
- [Section 3.4 and Section 4.3] The anomalous behavior of the 0.5 um dot is attributed to larger uncertainty in its reference position, but no independent evidence is provided for this claim; a repeat-registration or cross-check for that particular dot would make the explanation more convincing.
Circularity Check
The synthetic-data validation is circular by construction because the benchmark images are generated from the same Gaussian-Poisson forward model used as the likelihood, but the central experimental localization claim is anchored to external SEM reference positions and does not reduce to the model inputs.
-
self definitional
[Section 2.3 (synthetic data) and Section 2.4.1, Eq. (1) and Eq. (3) vs. Eq. (4); invoked again in Section 4.3.]
"The synthetic datasets ... were generated using the forward model underlying the likelihood function introduced in Section 2.4.4. ... Because the synthetic datasets were generated using the same forward model assumed in the proposed Bayesian framework, comparison between the synthetic and experimental results enables indirect assessment of the consistency of the forward model with practical SIMS measurements."
The synthetic images are draws from the same generative process used as the likelihood: Eq. (1) defines S(i,j|Theta) as a Gaussian spread function and Eq. (3) gives y_ij ~ Poisson(S(i,j|Theta)), while Eq. (4) is exactly that Poisson density. Running the REMC estimator on these images can only confirm that the sampler finds the known parameters of the assumed model; the agreement is built into the data-generation step. Section 4.3 then cites the synthetic/experimental agreement as 'additional support for the validity of the proposed forward model,' which uses the model's own output as its own confirmation. The SEM-based experimental localization errors are a separate, external benchmark and are not circular.
full rationale
The only constructed circularity is the synthetic-data validation: the benchmark images are generated from the same Gaussian-Poisson forward model (Eqs. 1 and 3) that defines the likelihood (Eq. 4), so synthetic agreement tests the REMC sampler and the identifiability of parameters under the assumed model rather than the truth of the model. The paper is transparent about this, explicitly noting that the datasets were generated with the same forward model. The central quantitative claim is the experimental localization of Au dots against SEM reference positions, including the reduction of relative error from 5.1% to 1.9%; that claim is externally grounded and does not reduce to the model's inputs. The paper itself flags that these reference positions 'may contain small positional uncertainties arising from the alignment process' (Section 2.2); that unquantified registration uncertainty is a correctness or limitation issue affecting the external benchmark, not a circularity. Reference [18] is a companion manuscript by overlapping authors, but it is used only to supply the synthetic datasets whose construction is fully described in Section 2.3, so no load-bearing conclusion rests on that self-citation alone. Overall, this is one auxiliary circular validation with an independent experimental core, giving a moderate-low circularity score of 4.
Assumptions & free parameters
free parameters (2)
- Prior range bounds for Gaussian parameters =
h in [0,5], a in [0.5,20], b in [0.6,1.4], c in [-0.5,0.5], mu and nu in [5,35]
- Synthetic intensity calibration =
Lowest intensity matched to Dataset 1 0.4 um dot; other intensities scale with dot diameter squared
assumptions (5)
- domain assumption Each trace species produces a two-dimensional Gaussian spread function in the SIMS image.
- domain assumption Detected ion counts are independent Poisson random variables given the Gaussian signal.
- domain assumption Each analyzed region of interest contains exactly one localized species, so K equals 1.
- ad hoc to paper Uniform prior ranges in Eqs. 9 and 10 cover the true parameter values.
- domain assumption The SEM-to-SIMS affine registration provides reliable reference positions.
Cite this review
Pith. "Pith review of Bayesian Localization and Uncertainty Quantification of Trace Species in Two-Dimensional SIMS Imaging." pith.science (2026). https://pith.science/paper/3NXXVH7C
@misc{pith2026260808495,
  author       = {Pith},
  title        = {Pith review of: Bayesian Localization and Uncertainty Quantification of Trace Species in Two-Dimensional SIMS Imaging},
  year         = {2026},
  howpublished = {\url{https://pith.science/paper/3NXXVH7C}},
  note         = {Machine review of arXiv:2608.08495}
}
abstract
To enable accurate localization of trace species on material surfaces, we propose a Bayesian framework for analyzing two-dimensional (2D) secondary ion mass spectrometry (SIMS) imaging data. SIMS is widely used in semiconductor manufacturing, materials science, geology, environmental science, and life sciences because of its high sensitivity and excellent elemental and isotopic specificity. However, precise localization remains challenging because of primary ion beam broadening, overlap between neighboring ion distributions, and limited ion counts. The underlying distribution of trace species is modeled as a superposition of two-dimensional Gaussian peaks. To account for the stochastic nature of low-count measurements, the detected ion counts are assumed to follow a Poisson likelihood within a Bayesian framework. Posterior distributions of the peak parameters are estimated using replica-exchange Monte Carlo (REMC), enabling stable inference together with quantitative uncertainty estimation under low-count conditions. The proposed method is first validated using synthetic datasets with known ground truth and is then applied to SIMS measurements of semiconductor samples containing regularly arranged gold (Au) dots with diameters ranging from 0.4 to 2.0~$\mu$m, using scanning electron microscopy (SEM) images as the reference. Optimization of the measurement conditions reduced the relative localization error for 0.4~$\mu$m dots from 5.1$\%$ to 1.9$\%$. These results demonstrate accurate submicrometer localization with statistically rigorous uncertainty quantification in 2D SIMS imaging.
Figures


Figures from the paper (6 more)


Reference graph
Works this paper leans on
-
[1]
P. A. W. van der Heide, V. Spampinato, A. Franquet, C. Zborowski, T. Conard, J. Ludwig, K. Paredis, W. Vandervorst, A. Pirkl, E. Niehuis, Surface analysis in the semiconductor industry: Present use and future possibilities, Surf.InterfaceAnal.52(12)(2020)786–791.doi:10.1002/ sia.6766
work page 2020
- [2]
-
[3]
J. Narayan, A. Kumar, Secondary ion mass spectrometry, in: L. Sangely, B. Boyer, E. de Chambost, et al. (Eds.), Sector Field Mass Spectrom- etry for Elemental and Isotopic Analysis, Royal Society of Chemistry, Cambridge, 2014, pp. 207–225.doi:10.1039/9781782622177-00207
-
[4]
F. Boulsina, M. Berrabah, J. C. Dupuy, Deconvolution of sims depth profiles: Towards simple and faster techniques, Applied Surface Science 255 (5) (2008) 1946–1958.doi:10.1016/j.apsusc.2008.06.124
-
[5]
S. Y. Lian, Z. J. Wang, C. L. Wang, X. L. Yan, F. R. Lin, J. Y. Wang, C. K. Xu, Deconvolution method for obtaining directly the original in- depth distribution of composition from measured sputter depth profile, Vacuum (2019).doi:10.1016/j.vacuum.2019.05.008
-
[6]
B. Gautier, G. Prudon, J. C. Dupuy, Toward a better reliability in the deconvolution of sims depth profiles, Surf. Interface Anal. 26 (13) (1998) 974–983.doi:10.1002/(SICI)1096-9918(199812)26: 13<974::AID-SIA445>3.0.CO;2-O. 24
-
[7]
T. M. Milillo, J. A. Gardella, Spatial statistics and interpolation meth- ods for tof sims imaging, Applied Surface Science 252 (19) (2006) 6883– 6890.doi:10.1016/j.apsusc.2006.02.164
-
[8]
T.Lombardo, F.Walther, C.Kern, Y.Moryson, T.Weintraut, A.Henss, M. Rohnke, Tof-sims in battery research: Advantages, limitations, and best practices, Journal of Vacuum Science & Technology A 41 (5) (2023) 053207.doi:10.1116/6.0002850
Show all 28 references
-
[9]
Slodzian, B
G. Slodzian, B. Daigne, F. Girard, F. Boust, F. Hillion, Scanning sec- ondary ion analytical microscopy with parallel detection, Biology of the Cell 74 (1992) 43–50.doi:10.1016/0248-4900(92)90102-T
1992 doi
-
[10]
Guerquin-Kern, T.-D
J.-L. Guerquin-Kern, T.-D. Wu, C. Quintana, A. Croisy, Progress in analytical imaging of the cell by dynamic secondary ion mass spectrom- etry (sims microscopy), Biochimica et Biophysica Acta 1724 (3) (2005) 228–238.doi:10.1016/j.bbagen.2005.05.013
2005 doi
-
[11]
Green, A
F. Green, A. Henderson, J. S. Fletcher, Advancements in tof-sims imag- ing for life sciences, Mass Spectrometry Reviews 42 (4) (2023) e22065. doi:10.1002/mas.22065
2023 doi
-
[12]
Onizawa, K
T. Onizawa, K. Higuchi, M. Goto, N. Tokuda, R. Hasunuma, K. Yam- abe, Dielectric degradation of gate sio2 films by cu contamination poste- rior to poly si gate mos capacitor fabrication, ECS Transactions (2004) 317–325
2004
-
[13]
J. M. Soden, C. F. Hawkins, Effects of contamination on semiconductor manufacturing and reliability, Microelectronics Reliability 35 (1) (1995) 145–165
1995
-
[14]
N. P. Lockyer, S. Aoyagi, J. S. Fletcher, I. S. Gilmore, P. A. W. van der Heide, K. L. Moore, B. J. Tyler, L.-T. Weng, Secondary ion mass spectrometry, Nature Reviews Methods Primers 4 (2024) 32. doi:10.1038/s43586-024-00311-9
2024 doi
-
[15]
Senoner, T
M. Senoner, T. Wirth, W. E. S. Unger, Imaging surface analysis: Lat- eral resolution and its relation to contrast and noise, Journal of Ana- lytical Atomic Spectrometry 25 (9) (2010) 1440–1452.doi:10.1039/ C0JA00423K. 25
2010
-
[16]
Rabasco, T
S. Rabasco, T. D. K. Nguyen, C. Gu, M. E. Kurczy, N. T. N. Phan, A. G. Ewing, Localization and absolute quantification of dopamine in discrete intravesicular compartments using nanosims imaging, In- ternational Journal of Molecular Sciences 23 (1) (2022) 160.doi: 10.3390/ijms23010160
2022 doi
-
[17]
Nagata, R
K. Nagata, R. Muraoka, Y.-i. Mototake, T. Sasaki, M. Okada, Bayesian spectral deconvolution based on poisson distribution: Bayesian measure- ment and virtual measurement analytics (vma), J. Phys. Soc. Jpn. 88 (2018) 044003.doi:10.7566/JPSJ.88.044003
2018 doi
-
[18]
Shieh, M
B. Shieh, M. Wang, I. Akai, M. Hara, M. Yoshioka, T. Hashishin, T. Aonishi, A marginalization-based semi-blind deconvolution frame- work for 2d sims imaging under poisson counting statistics, manuscript in preparation (2026)
2026
-
[19]
T. T. Li, X. M. Zhuang, H. M. Li, Y. X. Xu, Z. Q. Ma, J. Q. Zheng, Y. Q. Geng, C. L. Wang, S. Y. Lian, J. Y. Wang, C. K. Xu, Optimization of deconvoluted parameter for the quantification of high-resolution sims depth profiles, Vacuum 215 (2023) 112342.doi:10.1016/j.vacuum. 2023.112342
2023
-
[20]
Boulakroune, D
M. Boulakroune, D. Benatia, Improvement of sims multilayer profile analysis, in: 2012 6th International Conference on Sciences of Elec- tronics, Technologies of Information and Telecommunications (SETIT), 2012
2012
-
[21]
Boulakroune, D
M. Boulakroune, D. Benatia, A. E. Oualkadi, Multiscale deconvolution using wavelet transform for improving the depth resolution in secondary ion mass spectrometry analysis, in: 2008 International Conference on Signals, Circuits and Systems, 2008
2008
-
[22]
P. N. Allen, M. G. Dowsett, R. Collins, Sims profile quantification by maximum entropy deconvolution, Surface and Interface Analysis 20 (1993) 696–702
1993
-
[23]
J. W. Lee, K. J. Kim, H. K. Kim, D. W. Moon, Sims deconvolution of delta layers in silicon, Journal of Surface Analysis 10 (1) (2003) 16–18. 26
2003
-
[24]
R. E. Thompson, D. R. Larson, W. W. Webb, Precise nanometer local- ization analysis for individual fluorescent probes, Biophysical Journal 82 (5) (2002) 2775–2783.doi:10.1016/S0006-3495(02)75618-X
2002 doi
-
[25]
Nagata, S
K. Nagata, S. Sugita, M. Okada, Bayesian spectral deconvolution with the exchange monte carlo method, Neural Netw. 28 (2012) 82–89.doi: 10.1016/j.neunet.2011.12.001
2012 doi
-
[26]
Hukushima, K
K. Hukushima, K. Nemoto, Exchange monte carlo method and applica- tion to spin glass simulations, Journal of the Physical Society of Japan 65 (6) (1996) 1604–1608.doi:10.1143/JPSJ.65.1604
1996 doi
-
[27]
P. H. Garthwaite, Y. Fan, S. A. Sisson, Adaptive optimal scaling of metropolis–hastings algorithms using the robbins–monro process, Com- munications in Statistics - Theory and Methods 45 (17) (2016) 5098– 5111.doi:10.1080/03610926.2014.936562
2016
-
[28]
Okajima, K
K. Okajima, K. Nagata, M. Okada, Fast bayesian deconvolution using simple reversible jump moves, Journal of the Physical Society of Japan 90 (3) (2021) 034001.doi:10.7566/JPSJ.90.034001. 27
2021 doi
Reviewed August 14, 2026 · model on record in the stance chip above.
Discussion (0). Continue with ORCID to comment.