REVIEW 3 major objections 5 minor 37 references
Math-Vision Diagrams: A Comprehensive Benchmark for Evaluating LLM Mathematical Diagram Generation Capabilities
T0 review · 3 major / 5 minor · reviewed 2026-08-14 · deepseek-v4-flash
Pith's one-line read The paper introduces Math-Vision Diagrams, the first benchmark for evaluating LLMs on mathematical diagram generation across text-to-code and text-to-image paradigms, and shows that no single model dominates all evaluation axes.
desk verdict A genuinely useful new benchmark resource for LLM math diagram generation, but the headline claim that code models hold a structural advantage over image models rests on edge metrics the authors themselves admit are too coarse to support it. read the letter →
The pith
A machine-rendered reading of the paper's core claim, the machinery that carries it, and where it could break.
The reading
What carries the argument
The load-bearing mechanism is the pair of pipelines the paper builds. The first is a data-curation pipeline: start from the MathVision dataset, filter out non-mathematical images, have three vision-language model families describe each retained image in parallel, merge the descriptions with an image-grounded open-source judge, then condense the result into a single "Draw..." prompt using a text-only LLM. Prompt sufficiency is checked by two subject-matter experts on a random 50-pair sample on completeness, correctness, and clarity (mean 4.86/5). The second is an evaluation protocol that runs eleven models—nine code-generating LLMs and two text-to-image models—over all 2,920 prompts, compiles code outputs with format-specific renderers, and scores every output on four per-image metrics: DISTS, CLIP cosine similarity, Edge IoU, and Edge F1. The metrics are designed to be complementary; edge metrics capture the geometric skeleton that defines a diagram, while DISTS and CLIP capture perceptual and semantic similarity.
What would settle it
Run the same eleven models on prompts written directly from the original competition problem statements, without seeing any target images, and compare their scores with the image-derived prompts reported here. If performance falls substantially, the benchmark would be measuring caption-conditioned reconstruction rather than mathematical diagram generation from authentic specifications.
Extended reading notes
Core claim
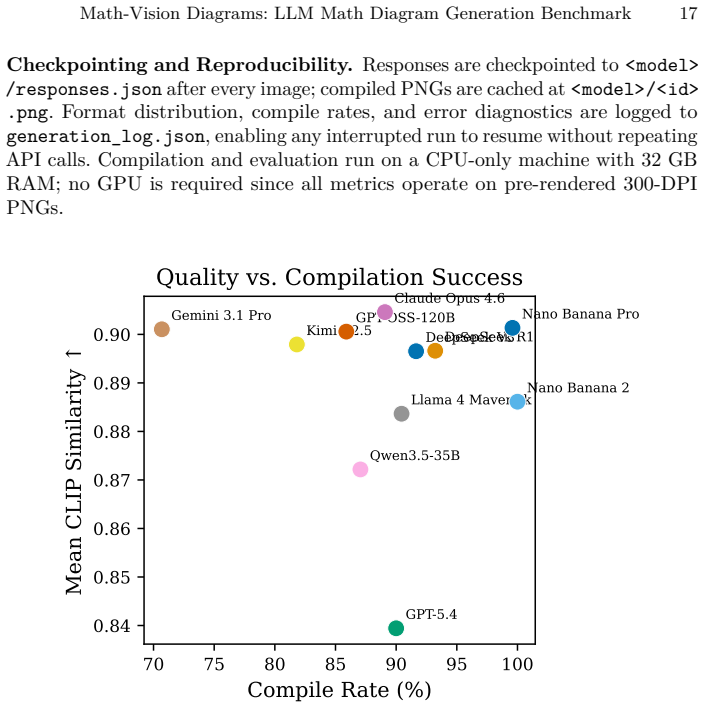
On its own terms, the paper's central discovery is that mathematical diagram generation splits into three partially independent axes—perceptual quality, structural fidelity, and generation reliability—and that current models must trade these off against each other. On the perceptual and semantic metrics (DISTS, CLIP similarity), the best code-generating model, Claude Opus 4.6, leads, while Gemini 3.1 Pro wins on edge-based structural overlap (Edge IoU 0.095, Edge F1 0.164) but compiles only 70.7% of the time. The two text-to-image models, Nano Banana Pro and Nano Banana 2, reach 99.6% and 100% success rates, yet their edge IoU scores (about 0.077–0.079) trail the best code generators. A common-subset analysis on 1,068 prompts that all models rendered confirms that these rankings are not an artifact of selection effects, and the paper reports that the ordering persists. The paper also finds that subject category and problem difficulty strongly modulate performance, with standard plane geometry relatively easy and statistics, topology, and transformation diagrams hardest.
Load-bearing premise
The benchmark's validity rests on the assumption that prompts distilled from vision-language descriptions of the reference images are sufficient and representative stand-ins for authentic mathematical prompts, a property validated on only 50 of the 2,920 prompt-image pairs by two human raters.
Editorial extensions
If this is right
- Code-based generation retains a measurable structural advantage over direct image synthesis on geometric precision, even on the common subset where all models produce output.
- Text-to-image models offer near-perfect reliability (99.6–100%), making them the safer choice when a diagram must always render, at the cost of structural exactness.
- No single model dominates all evaluation axes, so model choice should be driven by whether the deployment prioritizes perceptual quality, geometric fidelity, or failure-free generation.
- Problem category and difficulty are strong moderators: plane-geometry diagrams are within reach of current models, while statistics, topology, and transformation diagrams remain unsolved.
- Because all code, data, prompts, and evaluation scripts are open-sourced, the benchmark can serve as a shared yardstick for future model releases.
Reading between the lines
- Because every prompt is synthesized from a reference image via VLM descriptions, the benchmark likely overstates true generation ability; a prompt set derived from the original problem statements would probably show a wider capability gap.
- The near-floor edge metric values (best Edge IoU 0.100) suggest the Canny-based edge detector may saturate; a learned structural metric or adaptive thresholding could separate models more cleanly than the current implementation.
- The paper's observation that GPT-5.4's extended chain-of-thought appears to hurt code generation is a testable hypothesis: ablating reasoning traces on the same benchmark would isolate whether reasoning depth is the cause.
- The benchmark's static 2D and English-only scope means the difficulty ranking across categories may not transfer to dynamic, multilingual, or 3D diagram generation, which could be a natural extension.
Signed reviews
Editorial analysis
A structured set of objections, weighed in public.
Referee Report
Summary. The paper introduces Math-Vision Diagrams, a benchmark of 2,920 prompt-image pairs derived from the MathVision competition dataset. Prompts are synthesized by an ensemble of VLMs, condensed by an LLM judge, and validated by two subject-matter experts on a random sample of 50 pairs. Eleven models are evaluated: nine text-to-code LLMs (TikZ/SVG/Matplotlib) and two text-to-image models. Metrics are DISTS, CLIP cosine similarity, and Canny-based Edge IoU/Edge F1, with a common-subset analysis on 1,068 prompts and Holm-Bonferroni-corrected Wilcoxon signed-rank tests. The paper reports three central findings: text-to-code models have a measurable structural advantage on geometric precision but suffer compilation failures; no single model dominates all axes; and category/difficulty strongly modulate performance.
Significance. If validated, this benchmark would be a reusable resource: it is the first to evaluate text-to-code and text-to-image paradigms jointly on mathematical diagram generation, and it includes a careful statistical protocol (single-shot generation, common-subset analysis, corrected significance tests), transparent compilation/checkpointing details, and SME-scored prompt-sufficiency data in the appendix. The multi-metric design, distinguishing perceptual quality from structural fidelity, is a sensible step. However, the headline structural-advantage claim rests on edge metrics that the paper itself acknowledges operate at the floor of their range, and the prompt-sufficiency validation covers only 1.7% of the dataset. These issues do not invalidate the resource, but they do mean the central finding is currently supported less strongly than the text asserts.
major comments (3)
- [§5, §7.2(3), §7.3, Table 6] Finding 1, that text-to-code LLMs retain a 'measurable structural advantage' over text-to-image models, rests entirely on Edge IoU and Edge F1. The Limitations paragraph in §7.3 states that these metrics 'operate at the floor of their range (best model achieves Edge IoU of 0.100)' and that fixed-parameter Canny 'may not be sufficiently discriminative across diagrams with varying stroke widths and rendering styles.' On the common subset (Table 6), the best code model achieves Edge IoU 0.100 and the Nano Banana models achieve 0.070–0.071, a gap of about 0.03 at near-floor values. Because code outputs are rendered as sharp 300-DPI vector strokes while diffusion outputs have softer, textured edges, the fixed Canny threshold can systematically disadvantage text-to-image models. The paper should either add an artifact-resistant structural metric (e.g., adaptive edge extraction or a learned structural similarity), validate the edge scores against human judgments on a sample, or explicitly downgrade Finding 1 to a hypothesis pending such evidence.
- [§3.5] Prompt-sufficiency was validated by only two SMEs on 50 of 2,920 prompt-image pairs (1.7%), with 47/50 meeting the clarity threshold of 4. This sample is too small to establish that the synthesized prompts are sufficient across all 16 categories and difficulty levels; for instance, topology has only 5 images in the common subset. Additionally, because each prompt is generated from VLM descriptions of the target image, the task is, as the authors note, 'closer to caption-conditioned reconstruction than to generation from an authentic mathematical prompt.' The abstract and introduction claim a benchmark for 'mathematical diagram generation' from textual prompts; the revised text should more prominently qualify this as image-derived caption-conditioned reconstruction, or provide a larger stratified validation sample.
- [§4.2, §7.1] The evaluation suite contains no metric that directly measures mathematical validity, such as label correctness, coordinate accuracy, or topological consistency. The error analysis in §7.1 identifies label hallucination, coordinate miscalculation, and topological errors, and notes that CLIP scores remain high for topologically wrong diagrams. DISTS and CLIP are perceptual/semantic similarity measures, and the edge metrics are near floor. For a benchmark whose stated purpose is mathematical diagram precision, the absence of a semantic/structural validity metric means the most important evaluation dimension is not directly measured. The authors should add a human-validated sample study or programmatic geometric checks (e.g., comparing extracted labels and constraints) to support claims about mathematical validity.
minor comments (5)
- [Abstract] The phrase 'both both text-to-code and text-to-image paradigms' contains a duplicated 'both'.
- [§7.3] The sentence 'This begs the need for a new set of appropriate metrics' is grammatically awkward; consider 'This motivates the need' or 'This highlights the need'.
- [Figure 7] The caption says 'Mean CLIP similarity as a function of MathVision difficulty level,' but the figure axis lists category names, not difficulty levels 1–5. The caption and figure should be reconciled.
- [References] Reference [16] (Evaluating LLM-generated diagrams via graphs) appears in the bibliography but is not discussed in the related work; it should either be cited in the text or removed.
- [Code/data availability] The paper states that all code and data 'will be fully open-sourced' but provides no repository URL or artifact availability statement. For a benchmark contribution, a release link or a clear statement of the review-time availability is expected.
Circularity Check
Benchmark construction is image-to-prompt-to-image by design; the paper discloses this, and the model comparisons remain independent, so circularity is minor.
-
other
[Section 3.5, Prompt-Sufficiency Validation]
"Because each prompt is synthesized from VLM descriptions of the target image rather than from the original competition problem statement, the task we measure is closer to caption-conditioned reconstruction than to generation from an authentic mathematical prompt."
The ground-truth image is used to synthesize the input prompt, so the benchmark's input is derived from its own output reference. Performance on this benchmark therefore measures caption-conditioned reconstruction fidelity, not generation from an authentic mathematical specification. The paper explicitly acknowledges this design choice, and the model-vs-model comparisons are still empirical rather than forced by construction, so this is a disclosed construct-circularity in the benchmark's labeling rather than a hidden derivation chain.
full rationale
The paper's central contribution is a benchmark and an empirical evaluation, not a mathematical derivation whose conclusion is logically forced by its premises. The one genuinely circular element is the construction of prompts from the target images: each prompt is synthesized from VLM descriptions of the image that later serves as ground truth, making the measured task a caption-conditioned reconstruction rather than generation from an authentic math problem. The paper states this directly in Section 3.5, so the limitation is transparent. No parameter is fitted and then renamed as a prediction; no load-bearing claim depends on a self-citation; and the observed model rankings are empirical facts, not quantities that reduce to the benchmark inputs by construction. The edge-metric floor and Canny discrimination issues raised in Section 7.3 are validity concerns about the evaluation metrics, not circularity. Because the disclosed construct issue weakens only the name/generalization of the benchmark while the underlying model comparisons retain independent empirical content, a low circularity score is appropriate.
Assumptions & free parameters
free parameters (2)
- Canny edge detection parameters =
unspecified (likely OpenCV defaults; 3x3 dilation)
- Prompt-sufficiency threshold (clarity >= 4) =
4 on a 1-5 scale
assumptions (4)
- domain assumption MathVision's 3040 images are authentic competition problems with essential visual context
- domain assumption The 50-pair SME validation sample generalizes to all 2920 prompts
- domain assumption CLIP and DISTS similarities are valid proxies for mathematical diagram quality
- domain assumption Llama 3.3-70B condensation preserves the information in the four VLM descriptions
Cite this review
Pith. "Pith review of Math-Vision Diagrams: A Comprehensive Benchmark for Evaluating LLM Mathematical Diagram Generation Capabilities." pith.science (2026). https://pith.science/paper/JSUEKSCK
@misc{pith2026260808964,
  author       = {Pith},
  title        = {Pith review of: Math-Vision Diagrams: A Comprehensive Benchmark for Evaluating LLM Mathematical Diagram Generation Capabilities},
  year         = {2026},
  howpublished = {\url{https://pith.science/paper/JSUEKSCK}},
  note         = {Machine review of arXiv:2608.08964}
}
read the original abstract
The generation of mathematically precise diagrams from tex- tual prompts has emerged as a critical yet underexplored capability of Large Language Models (LLMs). This has been of interest to researchers in the areas of curriculum preparation, automated ranking of problem sets, and scientific publishing. For LLMs to achieve this, it requires per- fect coordination between Spatial Reasoning, Mathematical Reasoning, and Rendering systems. While existing benchmarks such as MathVision, MathVista are built for Math Reasoning or DiagramGenBenchmark, Mer- maidSeqBench on general purpose diagram generation, no prior work provides a standardized set of prompt, image pairs that can be used to evaluate the LLMs specifically on math diagram generation. This includes fields that span both both text-to-code and text-to-image paradigms. We introduce Math-Vision Diagrams, the first benchmark specifically designed to evaluate LLMs on mathematical diagram generation, and the first to assess text-to-code and text-to-image generation paradigms together in a single unified setting, agnostic of the underlying coding lan- guage or model type. Building on the Math-Vision benchmark, we select a subset of 2920 images out of 3040 from high-quality competition problems with essential visual context. A novel pipeline combining an ensemble of LLMs with Subject Matter Expert (SME) curation is presented, together with a suite of evaluation metrics. Testing several leading models against this benchmark, we demonstrate that LLMs struggle with math diagram generation. All code, data, curation pipeline, and evaluation scripts will be fully open-sourced.
Figures


Figures from the paper (6 more)


Reference graph
Works this paper leans on
-
[1]
Wang, K., et al.: Measuring multimodal mathematical reasoning with Math- Vision. NeurIPS Datasets Track (2024)
work page 2024
-
[2]
Lu, P., et al.: MathVista: Evaluating mathematical reasoning of foundation models in visual contexts. arXiv:2310.02255 (2023)
arXiv 2023
-
[3]
Chen, J., et al.: GeoQA: A geometric question answering benchmark. ACL Findings (2021)
work page 2021
-
[4]
Wei, J., et al.: From words to structured visuals: A benchmark and framework for text-to-diagram generation and editing. CVPR (2025)
work page 2025
-
[5]
Malik, R., et al.: MathemaTikZ: A dataset and benchmark for mathematical diagram generation. L@S (2025)
work page 2025
-
[6]
Belouadi, J., et al.: DeTikZify: Synthesizing graphics programs for scientific figures and sketches with TikZ. NeurIPS (2024)
work page 2024
-
[7]
Lee, J., et al.: From text to visuals: Using LLMs to generate math diagrams with vector graphics. AIED (2025)
work page 2025
-
[8]
Cui, Z., et al.: Draw with thought: Unleashing multimodal reasoning for scientific diagram generation. ACM MM (2025)
work page 2025
Show all 37 references
-
[9]
NeurIPS Math-AI Workshop (2025)
Kumar, V., et al.: DiagramIR: An automatic pipeline for educational math diagram evaluation. NeurIPS Math-AI Workshop (2025)
2025
-
[10]
IEEE ICCWAMTIP (2023)
Zhengyu, H., et al.: A precise text-to-diagram generation method for ele- mentary geometry. IEEE ICCWAMTIP (2023)
2023
-
[11]
arXiv:2502.13855 (2025)
Wang, J., et al.: MagicGeo: Training-free text-guided geometric diagram generation. arXiv:2502.13855 (2025)
2025 arXiv
-
[12]
CVPR (2025)
Xing, X., et al.: Empowering LLMs to understand and generate complex vector graphics. CVPR (2025)
2025
-
[13]
CVPR (2025)
Wu, R., et al.: Chat2SVG: Vector graphics generation with large language models and image. CVPR (2025)
2025
-
[14]
NeurIPS Workshop (2025)
Shbita, B., et al.: MermaidSeqBench: An evaluation benchmark for LLM-to- Mermaid sequence diagram generation. NeurIPS Workshop (2025)
2025
-
[15]
NeurIPS (2025)
MMMG authors: MMMG: A massive, multidisciplinary, multi-tier generation benchmark for text-to-image reasoning. NeurIPS (2025)
2025
-
[16]
EMNLP (2025)
Liang, C., et al.: Evaluating LLM-generated diagrams via graphs. EMNLP (2025)
2025
-
[17]
ICML (2021)
Radford, A., et al.: Learning transferable visual models from natural language supervision. ICML (2021)
2021
-
[18]
NeurIPS (2017)
Heusel, M., et al.: GANs trained by a two time-scale update rule. NeurIPS (2017)
2017
- [19]
-
[20]
arXiv (2026)
ScImage authors: ScImage benchmark for scientific images. arXiv (2026)
2026
-
[21]
ICML (2025)
Zhang, S., et al.: Primitive vision: Improving diagram understanding in MLLMs. ICML (2025)
2025
-
[22]
Under review ICLR (2026) 12 Kashyap et al
GeoLoom authors: GeoLoom: High-quality geometric diagram generation from textual input. Under review ICLR (2026) 12 Kashyap et al
2026
-
[23]
NeurIPS (2025)
OmniSVG authors: OmniSVG: A unified scalable vector graphics generation model. NeurIPS (2025)
2025
-
[24]
ICLR (2024)
MathVista authors: MathVista: Evaluating Mathematical Reasoning of Foun- dation Models in Visual Contexts. ICLR (2024)
2024
-
[25]
NeurIPS (2024)
MATH-Vision authors: MATH-Vision: Benchmarking Multimodal Mathe- matical Reasoning. NeurIPS (2024)
2024
-
[26]
ECCV (2024)
MathVerse authors: MathVerse: Does Your Model Really Understand Visual Math?. ECCV (2024)
2024
-
[27]
CVPR (2025)
MV-MATH authors: MV-MATH: Evaluating Multimodal Math Reasoning in Multi-Visual Contexts. CVPR (2025)
2025
-
[28]
Findings of ACL (2021)
GeoQA authors: GeoQA: A Geometric Question Answering Benchmark Towards Multimodal Numerical Reasoning. Findings of ACL (2021)
2021
-
[29]
CVPR (2025)
Text-to-Diagram authors: Text-to-Diagram Generation for Scientific Figures. CVPR (2025)
2025
-
[30]
EMNLP (2025)
R2I-Bench authors: R2I-Bench: Benchmarking Reasoning in Text-to-Image Models. EMNLP (2025)
2025
-
[31]
IEEE TPAMI (2020)
Ding, K., et al.: Image quality assessment: Unifying structure and texture similarity. IEEE TPAMI (2020)
2020
-
[32]
draw in latex/xml a circle inscribed in a triangle with all of its sides being a tangent
Jayasumana, S., et al.: Rethinking FID: Towards a better evaluation metric for image generation. CVPR (2024) Math-Vision Diagrams: LLM Math Diagram Generation Benchmark 13 Appendix 6 Diagram Generation by Text-to-Code LLMs Text-to-code LLMs generate executable diagram specific...
2024
-
[33]
Model selection depends on which property matters most for a given application
No single code-generating model dominates all axes.Claude Opus 4.6 leads on perceptual/semantic metrics; Gemini 3.1 Pro leads on structural precision; Nano Banana 2 leads on reliability. Model selection depends on which property matters most for a given application
-
[34]
In a production pipeline, the combination of high quality and low reliability may be worse than a model with moderate quality and high reliability
Compilation reliability is a first-order concern.Gemini 3.1 Pro pro- duces the best diagramswhen it compiles, but loses nearly 30% of its outputs. In a production pipeline, the combination of high quality and low reliability may be worse than a model with moderate quality and ...
-
[35]
The Nano Banana models are perceptually competitive but fall short on edge overlap, suggesting that explicit geometric primitives in code still matter for mathematical precision
Code-based generation retains a structural advantageover direct image synthesis, particularly on geometric detail. The Nano Banana models are perceptually competitive but fall short on edge overlap, suggesting that explicit geometric primitives in code still matter for mathema...
-
[36]
Future work on diagram generation should target these underperforming categories specifically
Mathematical subject strongly modulates difficulty.Models handle standard plane-geometry diagrams well but struggle with statistical charts, topological figures, and transformation diagrams. Future work on diagram generation should target these underperforming categories specifically
-
[37]
We hypothesize that its extended chain-of-thought reasoning, while beneficial for problem solving, may actively hurt code generation by producing overly complex output
GPT-5.4’s poor showing warrants investigation.The flagship Ope- nAI model is consistently the weakest code generator in our benchmark, a result that is statistically significant and persists on the common subset. We hypothesize that its extended chain-of-thought reasoning, whi...
2026
Reviewed August 14, 2026 · model on record in the stance chip above.
Discussion (0). Continue with ORCID to comment.