REVIEW 4 major objections 7 minor 1 cited by
Modeling the impacts of galaxy intrinsic alignments on weak lensing peak statistics
T0 review · 4 major / 7 minor · reviewed 2026-08-06 · deepseek-v4-flash
Pith's one-line read New model removes 8-sigma S8 bias from satellite galaxy alignments
desk verdict A solid, incremental extension of the halo-based peak model to include satellite IA, well-validated against its own mocks but conditional on a single-parameter IA law that real galaxies likely violate. read the letter →
The pith
A machine-rendered reading of the paper's core claim, the machinery that carries it, and where it could break.
The reading
What carries the argument
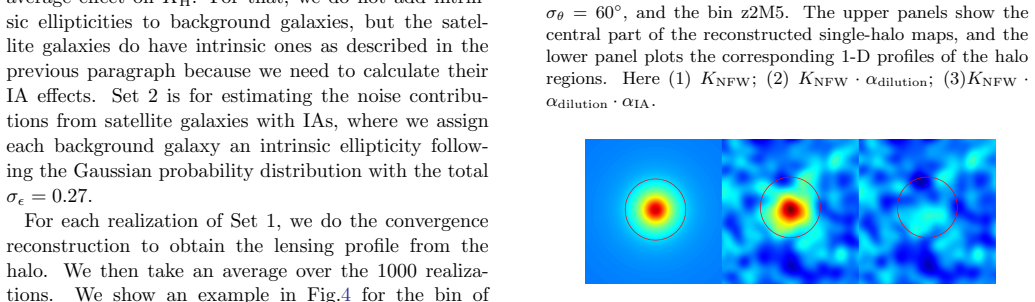
The central object is the halo-based peak count model built on Gaussian random field theory, in which high peaks are treated as massive clusters embedded in a Gaussian noise field. The IA corrections enter through two modifications: the halo convergence profile is replaced by $K_{\rm H}=K_{\rm H}^{\rm NFW}\,\alpha_{\rm dilution}\,\alpha_{\rm IA}$, where the correction factors come from single-halo simulations using the measured satellite number boost, and the noise moments $\sigma^2_{0,1,2}$ are recomputed separately for cluster regions (adding satellite IA noise from the same single-halo runs) and field regions (adding NLA II/GI power). These modified profile and noise parameters are then inserted into the closed-form peak abundance integrals, which is what makes the model predictive rather than a pure simulation calibration.
What would settle it
Take a simulated survey with satellite IAs described by two distinct populations (for example, a strongly aligned population in the cluster core and a nearly isotropic outer population) and check whether the model's recovered $\sigma_\theta$ and $S_8$ remain unbiased; a significant bias would show that the single-dispersion Gaussian assumption is insufficient.
Extended reading notes
Core claim
On the paper's own terms, the discovery is that the impact of galaxy intrinsic alignments on weak-lensing high peak statistics is dominated by satellite galaxies in massive clusters, and this impact can be modeled theoretically rather than only in simulations. The alignments enter through two channels: the average lensing profile of a cluster is rescaled by the satellite number boost and the coherent satellite orientations, captured in the factor $\alpha_{\rm dilution}\alpha_{\rm IA}$ applied to the NFW convergence profile, and the shape noise inside cluster regions gains a correlated component computed from single-halo Monte Carlo realizations, with the large-scale II/GI noise added from the NLA model. The resulting IA-corrected peak counts agree with mock data for alignment dispersions $\sigma_\theta>45^\circ$, and the corrected model shifts the inferred $S_8$ from an $8\sigma$ to $10\sigma$ bias to within $1\sigma$ of the fiducial value, while a Fisher forecast shows the same high-peak data can simultaneously constrain $\sigma_\theta$ to about $\pm24^\circ$.
Load-bearing premise
Satellite galaxies are assumed to align radially around their host cluster center with one shared dispersion angle $\sigma_\theta$, drawn from a Gaussian that does not depend on galaxy luminosity, morphology (beyond the disk/elliptical split), or distance from the cluster center, so if the real satellite IAs vary with these properties in ways the single parameter cannot capture, the calibrated corrections and the recovered $\sigma_\theta$ will be biased.
Editorial extensions
If this is right
- If the model is correct, weak-lensing high peak counts from Euclid/CSST-like surveys can be used for unbiased $S_8$ constraints without discarding small-scale cluster regions.
- The same peak data alone can measure the satellite galaxy alignment dispersion $\sigma_\theta$ at the $\pm24^\circ$ level, offering an independent probe of cluster astrophysics.
- Scaling the survey area to roughly $15000\,\mathrm{deg}^2$ sharpens the projected $\sigma_\theta$ constraint to about $6^\circ$, making Stage IV surveys a competitive platform for satellite IA measurements.
- Because the corrections enter through the cluster density profile and noise properties, the framework can be extended to baryonic effects by changing the mass-concentration relation or using baryon-corrected profiles.
- A model-based emulator interpolating single-halo simulation outputs over $\sigma_\theta$ would allow full MCMC constraints on $(\Omega_m,\sigma_8,\sigma_\theta)$ from observational peak counts.
Reading between the lines
- The paper's reliance on a single Gaussian dispersion $\sigma_\theta$ means the model could be biased if real satellite IAs depend on luminosity, morphology, or cluster-centric distance; the framework itself could be used to test this by fitting a two-parameter or radially varying IA model to the same peak counts.
- The strong degeneracy between $\sigma_8$ and $\sigma_\theta$ seen in the Fisher forecast suggests that combining peak height with peak steepness statistics, which respond differently to the cluster profile, could break this degeneracy and sharpen both constraints.
- The satellite number boost must be measured from the cluster catalogs of the survey itself, so the model's accuracy at the $1\sigma$ level depends on cluster detection and mass-calibration quality; the mass-uncertainty tests in the paper suggest this is under control for $1000\,\mathrm{deg}^2$ but could matter for larger surveys.
Editorial analysis
A structured set of objections, weighed in public.
Referee Report
Summary. This paper extends the authors' halo-based model for weak lensing high-peak counts to include galaxy intrinsic alignments (IAs). The model incorporates two IA effects: a modification of cluster lensing profiles due to the dilution and alignment of satellite galaxies in the source sample (Eq. 18), and additional shape-noise correlations from satellite IAs and large-scale NLA II/GI contributions (Eqs. 20-23). The correction factors alpha_dilution*alpha_IA and sigma^2_map,i(halo) are calibrated from single-halo simulations, and the model is compared with mock convergence maps built from ELUCID ray-tracing with semi-analytic galaxies, for satellite alignment dispersions sigma_theta = 75, 60, and 45 degrees. The paper reports that, for a Euclid/CSST-like source distribution and about 1000 deg^2, ignoring IA corrections biases S8 by about 8-10 sigma, while the corrected model reduces this bias to within 1 sigma. A Fisher forecast is used to argue that sigma_theta can be constrained to about 24 degrees simultaneously with cosmological parameters from high-peak counts alone.
Significance. If the model is robust, it provides an analytic route to use WL high peaks in Stage IV surveys while mitigating IA systematics and extracting information on satellite galaxy alignments. The paper's strengths are the explicit, computationally inexpensive modeling framework; the careful single-halo validation in Appendix B; the comparison against mock data for three IA strengths; the treatment of off-centering and cluster mass uncertainties; and the use of a simulation-fitted NLA amplitude and Hartlap-corrected bootstrap covariance. Nevertheless, the validation is performed entirely within the same single-Gaussian satellite IA model (Eq. 24) used to calibrate the corrections, and the headline sigma_theta forecast rests on idealized Fisher assumptions (fixed AIA, no super-sample variance, known cosmology). These caveats are acknowledged in places but are not reflected in the abstract's strong claims.
major comments (4)
- [Secs. 3.1, 3.3, 3.4] The mock data and the calibration of alpha_dilution*alpha_IA and sigma^2_map,i(halo) both use the same 3D Gaussian radial-alignment law of Eq. (24). The agreement in Figs. 7-8 therefore validates the internal consistency of the halo-based peak formalism under the assumed IA model, but it does not test the model against real satellite IAs, which the paper itself notes depend on luminosity, galaxy type, and distance to the cluster center (Sec. 4; see also Huang et al. 2018, Fortuna et al. 2021, Tenneti et al. 2021). To support the abstract's practical bias-mitigation claim, the authors should either validate the correction against an independent IA model (e.g., a radially dependent or luminosity-dependent sigma_theta) or explicitly restrict the claim to the adopted Gaussian model.
- [Sec. 3.6, Eq. (28)] The forecast sigma(sigma_theta) ~ 24 deg fixes the NLA amplitude AIA at the simulation-fitted value 0.8581, uses a bootstrap covariance from 156 patches of 3x3 deg^2 that excludes super-sample variance, and marginalizes only over (Omega_m, sigma_8, sigma_theta) with all other parameters fixed. The abstract's statement that satellite IA can be constrained 'simultaneously from WL high peak analyses alone' overstates what is demonstrated. The forecast should at least be tested with AIA as a free parameter and with an estimate of super-sample covariance, or the claim should be qualified accordingly.
- [Sec. 3.5, Table 2] The bias-mitigation demonstration assumes that sigma_theta is known in the corrected model ('we assume that the underlying sigma_theta is known in our IA-corrected model calculations'). In a real analysis sigma_theta is unknown and must be marginalized over; the Fisher forecast suggests a 24 deg uncertainty at 1000 deg^2. The paper should demonstrate that marginalizing over sigma_theta does not reintroduce bias or degrade the S8 constraint beyond the quoted 1 sigma, or at least quantify the expected degradation.
- [Sec. 3.4, Fig. 8] The paper claims the model works well for sigma_theta > 45 deg, but for sigma_theta = 45 the mock data lie above the model at SNR > 8, and the discrepancy is attributed to sample variance from a single N-body box. This explanation cannot be tested with the present data. In addition, the SNR ranges used in the MCMC fits differ between the sigma_theta = 75 and 60 cases ([5,11.5] vs [5,9.5]), so the quality of agreement in the claimed validity region is not quantified. The authors should provide a goodness-of-fit measure for the full claimed range and, ideally, test with multiple realizations or a larger simulation volume.
minor comments (7)
- [Abstract] The notation 'sigma(sigma_theta) ~ +/-24 deg' should read 'a 1-sigma uncertainty of about 24 deg'; the plus/minus sign is misleading for an uncertainty.
- [Sec. 2.3, Eq. (17)] The expression for alpha_IA is written as a scalar ratio of sums, but the IA effect is directional (tangential relative to the cluster center); the scalar/vector nature should be clarified.
- [Sec. 2.3, Eq. (19)] The notation 'n_g S_eff = sum n_halo_g S_halo_eff + n_field_g S_field_eff' is confusing because n_g appears on both sides; please define explicitly the area-weighted average and the meaning of S_eff.
- [Table 2] The row labels 'IAin' and 'IAno' are unclear; use 'with IA corrections' and 'without IA corrections'.
- [Fig. 8] The lower panel label 'Nmock/Ntheory' does not match the text 'relative differences'; either plot (Nmock - Ntheory)/Ntheory or change the y-axis label.
- [Sec. 3.4] Typo in 'Euclid-llike case' should be 'Euclid-like case'.
- [Sec. 3.6] When quoting the 1-sigma constraint on sigma_theta, the sentence should explicitly state that AIA is fixed at the simulation-fitted value.
Circularity Check
No significant circularity: the peak predictions are forward-modeled from independently calibrated IA corrections and are not fit to the peak counts; the main weaknesses are model-robustness limitations, not definitional circularity.
full rationale
The paper's derivation chain is not circular in the sense prohibited here. The IA correction factor alpha_dilution*alpha_IA and the halo-region noise sigma^2_map,i(halo) are measured from single-halo simulations (Sec. 3.3) that use the same Eq. (24) Gaussian IA law that generates the mocks. That makes the Sec. 3.4 validation an internal-consistency check of the analytic peak formalism rather than an external test of the IA model, but the agreement is not enforced by construction: the peak predictions are obtained by inserting these inputs into the non-trivial Gaussian-peak integrals Eqs. (10)-(16), and the mock peak counts come from full ray-tracing reconstructions (Sec. 3.1). The model could have failed even with the correct IA inputs, and the paper explicitly reports where it degrades (sigma_theta = 45 deg, high-SNR end). The large-scale IA amplitude AIA is fit to large-scale II correlations at theta > 5 arcmin (Sec. 3.4), a statistic independent of the peak counts, so its use is calibration, not a fitted-input-called-prediction. The Sec. 3.5 MCMC bias-mitigation test fixes sigma_theta to the mock truth, an assumption the paper states explicitly, and the Sec. 3.6 Fisher forecast is a parameter-sensitivity forecast, not a claim to have measured sigma_theta from data. The self-citations (Fan et al. 2010; Yuan et al. 2018; Zhang et al. 2022) are prior published models and simulations, including applications to external survey data, and no uniqueness theorem is imported to forbid alternatives. The acknowledged Sec. 4 limitation that satellite IAs may depend on luminosity, morphology, and cluster-centric distance is a real robustness and correctness risk for applying the calibrated corrections to real Euclid/CSST data, but it does not make the present derivation equivalent to its inputs by construction. The bootstrap covariance from 156 patches and the fixed AIA are optimistic choices that affect the forecast's realism, but they are not circularity. Accordingly, the appropriate circularity score is 0.
Assumptions & free parameters
free parameters (4)
- AIA (NLA amplitude) =
0.8581
- M* (mass threshold for massive halos) =
10^14 h^-1 M_sun
- sigma_theta (satellite IA dispersion) =
75, 60, 45 degrees as inputs; forecast constraint ~24 degrees
- C1 (NLA normalization) =
5e-14 h^-2 M_sun^-1 Mpc^3
assumptions (5)
- domain assumption WL high peaks are dominantly produced by individual massive halos with M >= M*, and KLSS + N can be treated as a Gaussian random field.
- domain assumption The satellite IA model of Eq. (24) with a single Gaussian dispersion sigma_theta describes all satellite alignments, independent of luminosity, galaxy type beyond disk/elliptical, and distance from cluster center.
- domain assumption The correction factors alpha_dilution alpha_IA and sigma^2_map,i(halo) obtained from single-halo simulations at the fiducial cosmology can be applied to all cosmologies in the MCMC.
- domain assumption The NLA model describes large-scale II and GI correlations, while one-halo satellite IAs must be treated separately.
- domain assumption Bootstrap covariance over 156 patches of 3x3 deg^2 approximates the full survey covariance.
Cite this review
Pith. "Pith review of Modeling the impacts of galaxy intrinsic alignments on weak lensing peak statistics." pith.science (2026). https://pith.science/paper/H6QKFOOU
@misc{pith2026250709232,
  author       = {Pith},
  title        = {Pith review of: Modeling the impacts of galaxy intrinsic alignments on weak lensing peak statistics},
  year         = {2026},
  howpublished = {\url{https://pith.science/paper/H6QKFOOU}},
  note         = {Machine review of arXiv:2507.09232}
}
abstract
Weak gravitational lensing (WL) peak statistics capture cosmic non-linear structures and can provide additional cosmological information complementary to cosmic shear two-point correlation analyses. They have been applied to different WL surveys successfully. To further facilitate their high precision applications, it is very timely to investigate the impacts of different systematics on WL peak statistics and how to mitigate them. Concerning the influence from galaxy intrinsic alignments (IAs), in this paper, we develop a theoretical model for WL high peaks taking into account the IA effects. It is an extension of our previous halo-based model. The IA corrections mainly include the modification of the lensing profile of clusters of galaxies due to the alignments of satellite galaxies and the additional shape noise correlations. We validate our model using simulations with the semi-analytical galaxy formation. We consider the cases where the satellite galaxies are averagely radially aligned toward the centers of their host clusters but with different dispersions $\sigma_{\theta}$. We show that our model works well for $\sigma_{\theta}>45^{\circ}$. If the IA corrections are not included in the model, for the Euclid/CSST-like source galaxy distribution and the survey area of $\sim 1000 deg^2$, the IA induced bias on $S_8$ can reach $\sim 8\sigma$ even for $\sigma_{\theta}=75^{\circ}$. With our model, not only the bias can be well mitigated, but also we can constrain the satellite IA to the level of {\bf $\sigma(\sigma_{\theta})\sim \pm 24^{\circ}$} simultaneously from WL high peak analyses alone using data from such a survey.
Figures


Figures from the paper (11 more)



Forward citations
Cited by 1 Pith paper
-
Artifacts in Halo Shapes: Imprints of the Initial Condition
Grid-based initial conditions imprint roughly one-percent alignment artifacts on simulated halo shapes, with a redshift-dependent sign flip whose origin is not yet pinned down.
Reference graph
Works this paper leans on
-
[1]
kԲ w rtg̻ qE # 7mZ=S P 81ޞa,p52f`J ^qѦ?h iM?G|
thebibliography [1] 20pt to REFERENCES 6pt =0pt -12pt 10pt plus 3pt =0pt =0pt =1pt plus 1pt =0pt =0pt -12pt =13pt plus 1pt =20pt =13pt plus 1pt \@M =10000 =-1.0em =0pt =0pt 0pt =0pt =1.0em @enumiv\@empty 10000 10000 `\.\@m \@noitemerr \@latex@warning Empty `thebibliography' environment \@ifnextchar \@reference \@latexerr Missing key on reference command E...
arXiv 2021
-
[2]
Abbott , T. M. C., Aguena , M., Alarcon , A., et al. 2022, , 105, 023520, 10.1103/PhysRevD.105.023520
-
[3]
2018, , 70, S4, 10.1093/pasj/psx066
Aihara , H., Arimoto , N., Armstrong , R., et al. 2018, , 70, S4, 10.1093/pasj/psx066
-
[4]
2019, arXiv e-prints, arXiv:1902.05569, 10.48550/arXiv.1902.05569
Akeson , R., Armus , L., Bachelet , E., et al. 2019, arXiv e-prints, arXiv:1902.05569, 10.48550/arXiv.1902.05569
-
[5]
E., Hern \'a ndez-Monteagudo , C., et al
Aric \`o , G., Angulo , R. E., Hern \'a ndez-Monteagudo , C., et al. 2020, , 495, 4800, 10.1093/mnras/staa1478
-
[6]
Bardeen , J. M., Bond , J. R., Kaiser , N., & Szalay , A. S. 1986, , 304, 15, 10.1086/164143
doi:10.1086/164143 1986
-
[7]
2001, , 340, 291, 10.1016/S0370-1573(00)00082-X
Bartelmann , M., & Schneider , P. 2001, , 340, 291, 10.1016/S0370-1573(00)00082-X
-
[8]
Blazek , J. A., MacCrann , N., Troxel , M. A., & Fang , X. 2019, , 100, 103506, 10.1103/PhysRevD.100.103506
Show all 83 references
-
[9]
R., & Efstathiou , G
Bond , J. R., & Efstathiou , G. 1987, , 226, 655, 10.1093/mnras/226.3.655
1987 doi
-
[10]
2007, New Journal of Physics, 9, 444, 10.1088/1367-2630/9/12/444
Bridle , S., & King , L. 2007, New Journal of Physics, 9, 444, 10.1088/1367-2630/9/12/444
2007 doi
- [11]
-
[12]
B., et al
Dark Energy Survey Collaboration , Abbott , T., Abdalla , F. B., et al. 2016, , 460, 1270, 10.1093/mnras/stw641
2016 doi
-
[13]
2025, , 536, 572, 10.1093/mnras/stae2601
Ding , J., Dalal , R., Sunayama , T., et al. 2025, , 536, 572, 10.1093/mnras/stae2601
2025 doi
-
[15]
2024, arXiv e-prints, arXiv:2405.13491, 10.48550/arXiv.2405.13491
Euclid Collaboration , Mellier , Y., Abdurro'uf , et al. 2024, arXiv e-prints, arXiv:2405.13491, 10.48550/arXiv.2405.13491
2024 doi
-
[16]
2010, , 719, 1408, 10.1088/0004-637X/719/2/1408
Fan , Z., Shan , H., & Liu , J. 2010, , 719, 1408, 10.1088/0004-637X/719/2/1408
2010 doi
-
[17]
Fan , Z. H. 2007, , 669, 10, 10.1086/521182
2007 doi
- [18]
-
[19]
C., Hoekstra , H., Joachimi , B., et al
Fortuna , M. C., Hoekstra , H., Joachimi , B., et al. 2021, , 501, 2983, 10.1093/mnras/staa3802
2021 doi
-
[20]
2013, , 434, 1531, 10.1093/mnras/stt1117
Fu , J., Kauffmann , G., Huang , M.-l., et al. 2013, , 434, 1531, 10.1093/mnras/stt1117
2013 doi
-
[21]
2014, Research in Astronomy and Astrophysics, 14, 1061, 10.1088/1674-4527/14/9/002
Fu , L.-P., & Fan , Z.-H. 2014, Research in Astronomy and Astrophysics, 14, 1061, 10.1088/1674-4527/14/9/002
2014 doi
- [22]
-
[23]
2019, , 883, 203, 10.3847/1538-4357/ab391e
Gong , Y., Liu , X., Cao , Y., et al. 2019, , 883, 203, 10.3847/1538-4357/ab391e
2019 doi
-
[24]
E., et al
Guo , Q., White , S., Angulo , R. E., et al. 2013, , 428, 1351, 10.1093/mnras/sts115
2013 doi
-
[25]
2004, , 350, 893, 10.1111/j.1365-2966.2004.07691.x
Hamana , T., Takada , M., & Yoshida , N. 2004, , 350, 893, 10.1111/j.1365-2966.2004.07691.x
2004
-
[26]
2022, , 509, 3868, 10.1093/mnras/stab3222
Harnois-D \'e raps , J., Martinet , N., & Reischke , R. 2022, , 509, 3868, 10.1093/mnras/stab3222
2022 doi
-
[27]
2024, , 534, 3305, 10.1093/mnras/stae2249
Harnois-D \'e raps , J., Heydenreich , S., Giblin , B., et al. 2024, , 534, 3305, 10.1093/mnras/stae2249
2024 doi
-
[28]
2007, , 464, 399, 10.1051/0004-6361:20066170
Hartlap , J., Simon , P., & Schneider , P. 2007, , 464, 399, 10.1051/0004-6361:20066170
2007 doi
-
[29]
2012, , 427, 146, 10.1111/j.1365-2966.2012.21952.x
Heymans , C., Van Waerbeke , L., Miller , L., et al. 2012, , 427, 146, 10.1111/j.1365-2966.2012.21952.x
2012
-
[30]
2021, , 646, A140, 10.1051/0004-6361/202039063
Heymans , C., Tr \"o ster , T., Asgari , M., et al. 2021, , 646, A140, 10.1051/0004-6361/202039063
2021 doi
-
[31]
M., & Seljak , U
Hirata , C. M., & Seljak , U. 2004, , 70, 063526, 10.1103/PhysRevD.70.063526
2004 doi
-
[32]
E., et al
Huang , H.-J., Mandelbaum , R., Freeman , P. E., et al. 2018, , 474, 4772, 10.1093/mnras/stx2995
2018 doi
-
[33]
M., Tyson , J
Ivezi \'c , Z ., Kahn , S. M., Tyson , J. A., et al. 2019, , 873, 111, 10.3847/1538-4357/ab042c
2019 doi
-
[34]
B., & Bridle , S
Joachimi , B., Mandelbaum , R., Abdalla , F. B., & Bridle , S. L. 2011, , 527, A26, 10.1051/0004-6361/201015621
2011 doi
-
[35]
2013, , 436, 819, 10.1093/mnras/stt1618
Joachimi , B., Semboloni , E., Hilbert , S., et al. 2013, , 436, 819, 10.1093/mnras/stt1618
2013 doi
-
[36]
D., et al
Joachimi , B., Cacciato , M., Kitching , T. D., et al. 2015, , 193, 1, 10.1007/s11214-015-0177-4
2015 doi
-
[37]
2016, , 463, 3653, 10.1093/mnras/stw2070
Kacprzak , T., Kirk , D., Friedrich , O., et al. 2016, , 463, 3653, 10.1093/mnras/stw2070
2016 doi
-
[38]
1993, , 404, 441, 10.1086/172297
Kaiser , N., & Squires , G. 1993, , 404, 441, 10.1086/172297
1993 doi
-
[39]
2015, Reports on Progress in Physics, 78, 086901, 10.1088/0034-4885/78/8/086901
Kilbinger , M. 2015, Reports on Progress in Physics, 78, 086901, 10.1088/0034-4885/78/8/086901
2015 doi
-
[40]
2008, , 386, L52, 10.1111/j.1745-3933.2008.00459.x
Knebe , A., Draganova , N., Power , C., et al. 2008, , 386, L52, 10.1111/j.1745-3933.2008.00459.x
2008
-
[41]
R., et al
Knebe , A., G \'a mez-Mar \' n , M., Pearce , F. R., et al. 2020, , 495, 3002, 10.1093/mnras/staa1407
2020 doi
-
[42]
2015, , 454, 3500, 10.1093/mnras/stv2140
Kuijken , K., Heymans , C., Hildebrandt , H., et al. 2015, , 454, 3500, 10.1093/mnras/stv2140
2015 doi
-
[43]
2024, , 974, 40, 10.3847/1538-4357/ad6982
Lan , Y., Tang , L., Lin , W., & Gong , J. 2024, , 974, 40, 10.3847/1538-4357/ad6982
2024 doi
-
[44]
2011, arXiv e-prints, arXiv:1110.3193
Laureijs , R., Amiaux , J., Arduini , S., et al. 2011, arXiv e-prints, arXiv:1110.3193. 1110.3193
2011 arXiv
-
[45]
2023 a , , 108, 123518, 10.1103/PhysRevD.108.123518
Li , X., Zhang , T., Sugiyama , S., et al. 2023 a , , 108, 123518, 10.1103/PhysRevD.108.123518
2023 doi
-
[46]
2023 b , , 520, 6382, 10.1093/mnras/stad534
Li , Z., Liu , X., & Fan , Z. 2023 b , , 520, 6382, 10.1093/mnras/stad534
2023 doi
-
[47]
2023, , 519, 594, 10.1093/mnras/stac2971
Liu , X., Yuan , S., Pan , C., et al. 2023, , 519, 594, 10.1093/mnras/stac2971
2023 doi
-
[48]
2015, , 450, 2888, 10.1093/mnras/stv784
Liu , X., Pan , C., Li , R., et al. 2015, , 450, 2888, 10.1093/mnras/stv784
2015 doi
-
[49]
2016, , 117, 051101, 10.1103/PhysRevLett.117.051101
Liu , X., Li , B., Zhao , G.-B., et al. 2016, , 117, 051101, 10.1103/PhysRevLett.117.051101
2016 doi
-
[50]
Z., Meng , X
LiuD , D. Z., Meng , X. M., Er , X. Z., et al. 2023, , 669, A128, 10.1051/0004-6361/202243978
2023 doi
-
[51]
2015, , 91, 063507, 10.1103/PhysRevD.91.063507
LiuJ , J., Petri , A., Haiman , Z., et al. 2015, , 91, 063507, 10.1103/PhysRevD.91.063507
2015 doi
-
[52]
2023, , 521, 2050, 10.1093/mnras/stad686
Lu , T., Haiman , Z., & Li , X. 2023, , 521, 2050, 10.1093/mnras/stad686
2023 doi
-
[53]
2016, , 458, 366, 10.1093/mnras/stw268
Luo , Y., Kang , X., Kauffmann , G., & Fu , J. 2016, , 458, 366, 10.1093/mnras/stw268
2016 doi
-
[54]
2018, , 56, 393, 10.1146/annurev-astro-081817-051928
Mandelbaum , R. 2018, , 56, 393, 10.1146/annurev-astro-081817-051928
2018 doi
-
[55]
A., Liu , J., Shirasaki , M., et al
Marques , G. A., Liu , J., Shirasaki , M., et al. 2024, , 528, 4513, 10.1093/mnras/stae098
2024 doi
-
[56]
2018, , 474, 712, 10.1093/mnras/stx2793
Martinet , N., Schneider , P., Hildebrandt , H., et al. 2018, , 474, 712, 10.1093/mnras/stx2793
2018 doi
-
[57]
J., Brieden , S., Tr \"o ster , T., & Heymans , C
Mead , A. J., Brieden , S., Tr \"o ster , T., & Heymans , C. 2021, , 502, 1401, 10.1093/mnras/stab082
2021 doi
-
[58]
J., Peacock , J
Mead , A. J., Peacock , J. A., Heymans , C., Joudaki , S., & Heavens , A. F. 2015, , 454, 1958, 10.1093/mnras/stv2036
2015 doi
-
[59]
F., Frenk , C
Navarro , J. F., Frenk , C. S., & White , S. D. M. 1996, , 462, 563, 10.1086/177173
1996 doi
- [60]
-
[61]
2025, arXiv e-prints, arXiv:2505.15470, 10.48550/arXiv.2505.15470
Navarro-Giron \'e s , D., Crocce , M., Gazta \ n aga , E., et al. 2025, arXiv e-prints, arXiv:2505.15470, 10.48550/arXiv.2505.15470
2025 doi
-
[62]
2018, , 70, S20, 10.1093/pasj/psx042
Oguri , M., Lin , Y.-T., Lin , S.-C., et al. 2018, , 70, S20, 10.1093/pasj/psx042
2018 doi
-
[63]
S., Koester , B
Rykoff , E. S., Koester , B. P., Rozo , E., et al. 2012, , 746, 178, 10.1088/0004-637X/746/2/178
2012 doi
-
[64]
S., Rozo , E., Hollowood , D., et al
Rykoff , E. S., Rozo , E., Hollowood , D., et al. 2016, , 224, 1, 10.3847/0067-0049/224/1/1
2016 doi
-
[65]
D., & Bridle , S
Schneider , M. D., & Bridle , S. 2010, , 402, 2127, 10.1111/j.1365-2966.2009.15956.x
2010
- [66]
- [67]
-
[68]
2018, , 474, 1116, 10.1093/mnras/stx2837
Shan , H., Liu , X., Hildebrandt , H., et al. 2018, , 474, 1116, 10.1093/mnras/stx2837
2018 doi
-
[69]
K., & Tormen , G
Sheth , R. K., & Tormen , G. 1999, , 308, 119, 10.1046/j.1365-8711.1999.02692.x
1999
-
[70]
2015, , 575, A48, 10.1051/0004-6361/201424435
Sif \'o n , C., Hoekstra , H., Cacciato , M., et al. 2015, , 575, A48, 10.1051/0004-6361/201424435
2015 doi
-
[71]
1996, , 473, 65, 10.1086/178127
Squires , G., & Kaiser , N. 1996, , 473, 65, 10.1086/178127
1996 doi
-
[72]
2012, , 761, 152, 10.1088/0004-637X/761/2/152
Takahashi , R., Sato , M., Nishimichi , T., Taruya , A., & Oguri , M. 2012, , 761, 152, 10.1088/0004-637X/761/2/152
2012 doi
-
[73]
D., Joachimi , B., & Di Matteo , T
Tenneti , A., Kitching , T. D., Joachimi , B., & Di Matteo , T. 2021, , 501, 5859, 10.1093/mnras/staa3934
2021 doi
- [74]
-
[75]
J., Yang , X., Jing , Y
Wang , H., Mo , H. J., Yang , X., Jing , Y. P., & Lin , W. P. 2014, , 794, 94, 10.1088/0004-637X/794/1/94
2014 doi
-
[76]
J., Yang , X., et al
Wang , H., Mo , H. J., Yang , X., et al. 2016, , 831, 164, 10.3847/0004-637X/831/2/164
2016 doi
-
[77]
2018 a , , 478, 2987, 10.1093/mnras/sty1268
Wei , C., Li , G., Kang , X., et al. 2018 a , , 478, 2987, 10.1093/mnras/sty1268
2018 doi
-
[78]
2018 b , , 853, 25, 10.3847/1538-4357/aaa40d
---. 2018 b , , 853, 25, 10.3847/1538-4357/aaa40d
2018 doi
- [79]
-
[80]
M., Wang , S., et al
Yang , X., Kratochvil , J. M., Wang , S., et al. 2011, , 84, 043529, 10.1103/PhysRevD.84.043529
2011 doi
-
[81]
2018, , 857, 112, 10.3847/1538-4357/aab900
Yuan , S., Liu , X., Pan , C., Wang , Q., & Fan , Z. 2018, , 857, 112, 10.3847/1538-4357/aab900
2018 doi
-
[82]
2022, , 940, 96, 10.3847/1538-4357/ac9a4c
Zhang , T., Liu , X., Wei , C., et al. 2022, , 940, 96, 10.3847/1538-4357/ac9a4c
2022 doi
-
[83]
A., et al
Zhou , C., Tong , A., Troxel , M. A., et al. 2023, , 526, 323, 10.1093/mnras/stad2712
2023 doi
-
[84]
2022, , 511, 2075, 10.1093/mnras/stac078
Z \"u rcher , D., Fluri , J., Sgier , R., et al. 2022, , 511, 2075, 10.1093/mnras/stac078
2022 doi
Reviewed August 6, 2026 · model on record in the stance chip above.
Discussion (0). Continue with ORCID to comment.