REVIEW 3 major objections 4 minor 1 cited by
Tomographer: End-to-end Redshift Distribution Estimation for Source Catalogs and Intensity Maps
T0 review · 3 major / 4 minor · reviewed 2026-08-15 · deepseek-v4-flash
Pith's one-line read Tomographer returns bias-weighted redshift distributions for source catalogs and intensity maps from sky positions alone.
desk verdict Solid, thoroughly validated clustering-redshift tool with a real speedup via activation maps; the only serious caveat is that the absolute normalization is anchored internally, not independently. read the letter →
The pith
A machine-rendered reading of the paper's core claim, the machinery that carries it, and where it could break.
The reading
What carries the argument
The load-bearing object is the activation map: for each redshift slice of the reference sample, a HEALPix map in which each pixel accumulates weighted counts of reference objects within a fixed projected physical annulus (default $0.5$–$10\,h^{-1}\,\mathrm{Mpc}$), with per-pair weight $\theta^{\gamma-1}$. One map is built from the reference data and one from its random catalog, thereby encoding both the large-scale structure signal and the survey selection function. At run time any source catalog or intensity map is pixelized onto the same HEALPix grid, and every correlation estimator—test–reference cross terms and reference auto-correlation—becomes an inner product between that pixel vector and the precomputed activation maps. This is what converts pair-counting from $O(N\log N)$ into $O(1)$ map multiplications and makes the redshift decomposition run in minutes on a laptop.
What would settle it
Build a simulated galaxy catalog with a known, strongly scale-dependent bias, give it a known $dN/dz$, run Tomographer, and check whether the recovered $b(z)dN/dz$ matches the input within the bootstrap errors; a mismatch beyond the quoted uncertainties would falsify the linear-bias factorization.
Extended reading notes
Core claim
Tomographer's central claim is that a single end-to-end tool, built on a fixed spectroscopic reference sample, can recover the bias-weighted redshift distribution of essentially any projected extragalactic field. For a source catalog the output is $b(z)\,dN/dz(z)$; for an intensity map it is $b(z)\,dI/dz(z)$, in both cases over $0<z\lesssim4$ with absolute normalization and in fine redshift bins. The inference uses the standard clustering-redshift relation $\bar w_{\rm tr}(z_i)=\bar w_m(z_i)\,b_t(z_i)\,b_r(z_i)\,dS/dz(z_i)$, with the reference bias $b_r$ measured from the reference auto-correlation and the matter anchor $\bar w_m$ computed from the nonlinear matter power spectrum under Limber's approximation. What the user receives is the test field's bias-weighted redshift content, with the reference bias divided out and the theoretical matter correction applied. The paper supports this claim with validation against spectroscopically known samples, sharp top-hat reconstructions, reference-independence tests, synthetic intensity maps with beam smoothing and foregrounds, and an external comparison.
Load-bearing premise
The recovery assumes that on the chosen scales the clustering of the test and reference populations is each a fair, scale-independent multiple of the matter clustering, so that the scale-dependent parts cancel and the measured cross-correlation factorizes into bias times redshift distribution.
Editorial extensions
If this is right
- Photometric-redshift bins can be validated and recalibrated from positions alone, with sharp-edge resolution that photo-$z$ methods smooth out.
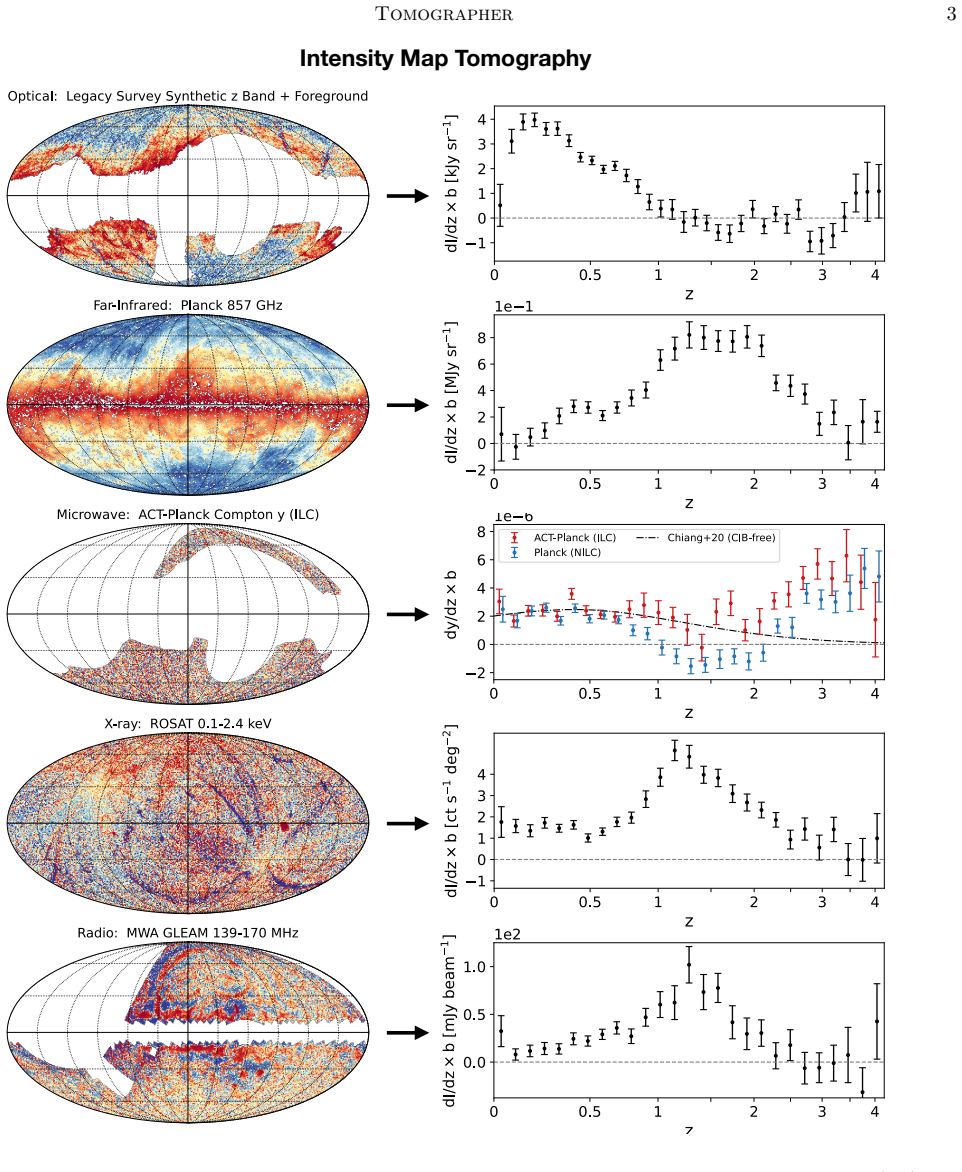
- Diffuse backgrounds from radio to X-rays can be decomposed into bias-weighted redshift contributions without detecting individual sources.
- A survey's target-selection response can be characterized before spectroscopy begins, as the DESI imaging-target example shows.
- Because bootstrap realizations are shared across runs, multi-band or multi-sample tomographies can be combined with consistent covariances.
Reading between the lines
- The same activation-map construction could be rebuilt on any future spectroscopic reference, so the $O(1)$ runtime is a property of the architecture, not of this particular reference sample.
- A natural testable extension is to use Tomographer as a survey-systematics diagnostic on every imaging catalog: repeated footprint-split runs would flag spatially varying selection functions that manifest as shape changes in the recovered distribution.
- Although the paper notes the bias-weighted kernel is the fundamental quantity for large-scale structure, a practical corollary not developed is that these outputs can be fed directly into cross-correlation analyses with CMB lensing or the integrated Sachs–Wolfe effect.
Signed reviews
Editorial analysis
A structured set of objections, weighed in public.
Referee Report
Summary. The paper introduces Tomographer, a publicly released end-to-end clustering-redshift framework. The central design is a set of precomputed HEALPix 'activation maps' built from ~3 million SDSS spectroscopic galaxies and quasars over 10,440 deg^2; any test source catalog or intensity map is projected onto the same pixel grid, and all cross- and auto-correlation measurements reduce to inner products, removing user-side pair counting. The output is the bias-weighted redshift distribution b(z) dN/dz for source catalogs or b(z) dI/dz for intensity maps over 0 < z < 4. The authors validate the method against SDSS spectroscopic samples with known redshift distributions, show recovery of sharp top-hat edges, demonstrate reference-independence by analyzing a single test sample against five different spectroscopic reference subsamples, test sensitivity to footprint splits and a synthetic completeness gradient, compare shapes with the independent analysis of Krolewski et al. (2020) for unWISE galaxies, and validate the intensity-map mode with synthetic maps subject to beam smoothing and foregrounds. The paper also presents ten example applications spanning source-catalog and intensity-map inputs from radio to X-ray wavelengths.
Significance. If the claims hold, Tomographer substantially lowers the technical barrier to clustering-redshift estimation: it ships with a curated, bias-characterized reference sample, eliminates user-side pair counting, and extends the method to intensity maps in a single workflow. The activation-map architecture is elegant and the validation suite is unusually broad: known-redshift recovery, sharp-edge resolution, reference-independence across five tracers, latitude splits, a synthetic completeness gradient, an external shape comparison, and a synthetic intensity-map test with beam and foreground effects. The code is publicly available, and the paper is candid about the bias degeneracy and truncation limits of the reference coverage. The main weakness is that the absolute normalization of b(z) dS/dz, which the paper advertises as a headline deliverable, is validated only internally against truth estimates that share the same theory and estimator ingredients; the single external comparison is shape-only because the comparison catalog was published with arbitrary normalization.
major comments (3)
- [Section 4.1 and Section 3.3] The absolute amplitude of b(z) dN/dz is validated only against 'truth' curves derived from the auto-correlation of the same spectroscopic samples divided by the same theoretical matter anchor w_m and the same empirically measured reference bias b_r (Section 4.1; the truth construction is described in the text above Figure 7). Any normalization error in the halofit-based w_m on the adopted 0.5-10 Mpc/h scales, or any common estimator normalization factor, cancels exactly in this comparison, and the unit-Gaussian residuals in Figure 7 cannot detect it. Because the abstract, Section 3.4, and Section 6.2 claim that Tomographer directly recovers the absolute physical normalization of b(z) dS/dz, this is a load-bearing validation gap rather than a cosmetic one. I recommend adding an external amplitude anchor: for example, a mock galaxy catalog with a known input b(z) dN/dz run through the full pipeline, or a comparison of the recovered b(z) dN/dz for a well-studied sample whose bias is independently calibrated by galaxy-galaxy lensing or by clustering ratios.
- [Section 4.5] The synthetic intensity-map test uses the Tomographer source-mode output on the same galaxies as the reference 'truth' for the intensity-mode validation. This validates the beam- and foreground-handling machinery of the intensity mode relative to the source mode, but it does not provide an independent check on the absolute scale of b(dI/dz): any normalization error in the source-mode estimator propagates directly into the adopted truth. The paper should either add an external or mock-based intensity-map test with a known b(z) dI/dz amplitude, or explicitly state in the conclusions that the intensity-mode absolute normalization rests on the same unanchored ingredients as the source mode.
- [Section 6.2 and Section 3.3] The paper acknowledges that scale-dependent bias is 'absorbed into the effective b_t and b_r' and argues that applying the same r_p range and weighting to auto- and cross-correlations makes leading effects cancel in Equation (6). This argument is plausible but not quantitatively tested for the test-sample bias: the reference-independence test in Figure 8 probes only whether the b_r correction works for different reference tracers, not whether the recovered b_t(z) dN/dz amplitude is immune to the scale dependence of the test tracer's bias. Since the single external comparison (Figure 10) is shape-only and the internal validations share the same scale choice, the claim that residual scale-dependent bias is 'empirically small' is not directly supported by the presented tests. I suggest adding an explicit validation in which the same test sample is analyzed with at least two of the five precomputed r_p,min configurations (e.g., 0.5 and 2.0 Mpc/h) and the recovered b(z) dN/dz amplitudes are compared.
minor comments (4)
- [Section 3.1] The complexity claim 'reducing computational scaling from O(N log N) to O(1)' is imprecise: the inner-product operations in Equation (15) scale with the number of HEALPix pixels and the number of redshift bins, not with the input source number. Consider rephrasing as 'independent of the test and reference sample sizes' or 'O(N_pix) per redshift bin' to avoid a technically misleading statement.
- [Figure 10 and Section 4.4] The text notes that the Krolewski et al. (2020) curves were rescaled to the same integrated area as Tomographer, but Figure 10 and the caption would be clearer if they explicitly stated that this rescaling removes all absolute-normalization information, and if possible reported the normalization ratio between the two analyses so that the reader can see the implied amplitude difference.
- [Section 4.2] The claim that the five reference-sub-sample measurements 'collapse onto a single consistent track' after the b_r correction is visually supported by Figure 8, but a quantitative statement (e.g., reduced chi-square or maximum fractional deviation between any pair of curves) would strengthen the reference-independence validation, particularly because the plotted curves may have correlated uncertainties.
- [Section 2.2, Equation (10)] In Equation (9), the notation \bar{w}'_m = \bar{w}_m / \Delta z assumes that the matter clustering amplitude is diluted inversely with the bin width; this is only an approximation for wide bins. A brief clarifying sentence on when this approximation is valid would help readers apply the tri-band correction in Equation (10).
Circularity Check
No derivation-level circularity; validation of the absolute normalization is partly self-referential.
-
self definitional
[Section 4.1, validation against known spectroscopic distributions, building on Eqs. (6)-(10)]
"Our first validation uses test samples drawn from the SDSS spectroscopic catalogs, for which the true dN/dz(z) and, from their measured auto-correlations, the true b(z) dN/dz(z) are known."
The 'true' bias-weighted distribution is not an independent external measurement: it is constructed from the same reference auto-correlation and the same theoretical matter anchor wm (Eqs. 9-10) that Tomographer divides by in Eq. (6). A normalization error in wm, in the nonlinear halofit prediction, or in a common estimator normalization cancels exactly between the two sides. The unit-Gaussian residuals in Fig. 7 therefore validate internal consistency and shape recovery, but not the absolute normalization of b(z)dS/dz claimed in Section 6.2. The amplitude check is self-referential.
-
other
[Section 4.5, intensity-mapping mode synthetic map test]
"Since the previous source-mode validations have already established accurate redshift recovery for resolved objects, the corresponding Tomographer output serves as the reference truth for the intensity-mapping validation."
Here the 'truth' for the intensity-map test is produced by Tomographer itself from the resolved-source catalog. Comparing the intensity-mode output with this truth demonstrates consistency between the source and intensity modes of the same pipeline, but it does not independently establish that the recovered b(z)dI/dz amplitude is physically correct. Moreover, the only external comparison (Section 4.4) rescales the published curves to Tomographer's integrated area, so it tests shape only. The absolute normalization of b(z)dS/dz therefore has no independent amplitude anchor.
full rationale
The core estimator is not circular: Eq. (6) defines the output b(z)dS/dz as the measured cross-correlation divided by a theoretical matter anchor wm and an empirically measured reference bias br, with the bias degeneracy stated openly in Section 6.1. No fitted parameter is relabeled as a prediction, and the activation-map implementation is an independent computational reformulation of the pair-counting estimators (Section 3.1 and Appendix A). The circularity concern is confined to amplitude validation. In Section 4.1 the 'truth' b(z)dN/dz is built from the same auto-correlations and the same wm used by the estimator, so normalization errors cancel. In Section 4.5 the intensity-map truth is the Tomographer source-mode output itself. The external unWISE comparison (Section 4.4) is explicitly rescaled to Tomographer's integral, making it shape-only. These issues do not undermine the shape, sharp-edge, zero-level, bootstrap-calibration, footprint-split, beam, or foreground tests, nor the computational framework; they mean the absolute normalization of b(z)dS/dz is validated only internally. This is a validation gap and mild self-reference, not a derivation-level circularity.
Assumptions & free parameters
free parameters (4)
- Angular weighting index gamma =
-0.8
- Minimum projected separation rp,min =
0.5, 1.0, 1.5, 2.0, 2.5 h^-1 Mpc
- Maximum projected separation rp,max =
10 h^-1 Mpc
- High-redshift reference bias regularization fit =
not reported
assumptions (5)
- domain assumption Tracer fluctuations are linearly related to the matter density field with a bias that is independent of scale over the adopted rp range (Equation 6).
- standard math Limber approximation and the nonlinear matter power spectrum from CLASS with halofit describe the angular matter clustering wm(z).
- domain assumption Reference random catalogs accurately describe the SDSS selection functions, including the approximate random catalog built for nonLSS quasars.
- domain assumption The test sample has a unique, well-defined redshift distribution across the analysis footprint.
- domain assumption The chosen scales rp = 0.5 to 10 Mpc/h exclude one-halo and wide-angle contributions while remaining in the quasi-linear regime.
Cite this review
Pith. "Pith review of Tomographer: End-to-end Redshift Distribution Estimation for Source Catalogs and Intensity Maps." pith.science (2026). https://pith.science/paper/UD3APBJL
@misc{pith2026260803415,
  author       = {Pith},
  title        = {Pith review of: Tomographer: End-to-end Redshift Distribution Estimation for Source Catalogs and Intensity Maps},
  year         = {2026},
  howpublished = {\url{https://pith.science/paper/UD3APBJL}},
  note         = {Machine review of arXiv:2608.03415}
}
abstract
Redshift information is central to nearly every extragalactic and cosmological application of sky surveys, yet only a small fraction of cataloged sources, and none of the photons forming diffuse backgrounds, have spectroscopic redshifts. Clustering-based redshift inference estimates the redshift distribution of an arbitrary dataset through spatial cross-correlation with a reference sample of known redshifts. It relies only on positional information, making it applicable to any tracer of large-scale structure, including source populations and diffuse intensity maps. Its broader adoption, however, has been limited by technical barriers: assembling and characterizing spectroscopic references, expensive pair-counting computations, theoretical corrections, and systematic control. To remove these barriers, we introduce Tomographer, an end-to-end clustering-redshift framework. The key design feature is a set of precomputed "activation maps" encoding the spatial pair information of 3 million SDSS spectroscopic galaxies and quasars up to $z\sim4$ over $10{,}000\,{\rm deg}^2$. This eliminates user-end pair counting, reducing computational scaling from $O(N\log N)$ to $O(1)$ map multiplications. Given a source catalog or intensity map, Tomographer returns the bias-weighted redshift distribution, $b(z)\,{\rm d}N/{\rm d}z(z)$ or $b(z)\,{\rm d}I/{\rm d}z(z)$. We validate the framework against samples with known redshifts, demonstrate accurate uncertainty estimates, and show robustness to survey footprint, spatially varying selection functions, beam smoothing, and foreground contamination. We showcase applications to source catalogs selected by flux, color, photometric redshift, morphology, or variability, and to intensity maps from radio to X-rays. Future Tomographer releases will incorporate additional wide-field spectroscopic reference samples as they become available.
Figures


Figures from the paper (9 more)


Forward citations
Cited by 1 Pith paper
-
CIBER $\times$ galaxy cross-correlations reveal a bright, low-redshift NIR background
First tomographic CIBER×galaxy cross-correlations reveal near-infrared background fluctuations at z<0.6 several times stronger than integrated-galaxy-light model predictions.
Reference graph
Works this paper leans on
-
[1]
New York University Value-Added Galaxy Catalog: A Galaxy Catalog Based on New Public Surveys. , keywords =. doi:10.1086/429803 , archivePrefix =. astro-ph/0410166 , primaryClass =
-
[2]
Global survey of star clusters in the Milky Way. II. The catalogue of basic parameters. , keywords =. doi:10.1051/0004-6361/201322302 , archivePrefix =. 1308.5822 , primaryClass =
-
[3]
The 2MASS Large Galaxy Atlas. , keywords =. doi:10.1086/345794 , adsurl =
-
[4]
The Gaia mission. , keywords =. doi:10.1051/0004-6361/201629272 , archivePrefix =. 1609.04153 , primaryClass =
-
[5]
The MCXC: a meta-catalogue of x-ray detected clusters of galaxies. , keywords =. doi:10.1051/0004-6361/201015377 , archivePrefix =. 1007.1916 , primaryClass =
arXiv 1916
-
[6]
Planck 2015 results. XXVI. The Second Planck Catalogue of Compact Sources. , keywords =. doi:10.1051/0004-6361/201526914 , archivePrefix =. 1507.02058 , primaryClass =
arXiv 2015
-
[9]
Atacama Cosmology Telescope: High-resolution component-separated maps across one third of the sky. , keywords =. doi:10.1103/PhysRevD.109.063530 , archivePrefix =. 2307.01258 , primaryClass =
-
[10]
Cosmic Star-Formation History. , keywords =. doi:10.1146/annurev-astro-081811-125615 , archivePrefix =. 1403.0007 , primaryClass =
Show all 152 references
-
[11]
Planck 2015 results. VIII. High Frequency Instrument data processing: Calibration and maps. , keywords =. doi:10.1051/0004-6361/201525820 , archivePrefix =. 1502.01587 , primaryClass =
2015 arXiv
-
[12]
The SAGA Survey. II. Building a Statistical Sample of Satellite Systems around Milky Way-like Galaxies. , keywords =. doi:10.3847/1538-4357/abce58 , archivePrefix =. 2008.12783 , primaryClass =
2008 arXiv
-
[13]
, keywords =
LSST: From Science Drivers to Reference Design and Anticipated Data Products. , keywords =. doi:10.3847/1538-4357/ab042c , archivePrefix =. 0805.2366 , primaryClass =
-
[14]
The extragalactic content
Gaia Data Release 3. The extragalactic content. , keywords =. doi:10.1051/0004-6361/202243232 , archivePrefix =. 2206.05681 , primaryClass =
-
[15]
, keywords =
The Sloan Digital Sky Survey: Technical Summary. , keywords =. doi:10.1086/301513 , archivePrefix =. astro-ph/0006396 , primaryClass =
-
[16]
, keywords =
Target Selection and Sample Characterization for the DESI LOW-Z Secondary Target Program. , keywords =. doi:10.3847/1538-4357/ace902 , archivePrefix =. 2212.07433 , primaryClass =
-
[17]
Extending the SAGA Survey (xSAGA). I. Satellite Radial Profiles as a Function of Host-galaxy Properties. , keywords =. doi:10.3847/1538-4357/ac4eea , archivePrefix =. 2112.01542 , primaryClass =
-
[18]
, keywords =
Target Selection and Validation of DESI Quasars. , keywords =. doi:10.3847/1538-4357/acb3c2 , archivePrefix =. 2208.08511 , primaryClass =
-
[19]
, keywords =
Target Selection and Validation of DESI Emission Line Galaxies. , keywords =. doi:10.3847/1538-3881/acb213 , archivePrefix =. 2208.08513 , primaryClass =
-
[20]
, keywords =
Target Selection and Validation of DESI Luminous Red Galaxies. , keywords =. doi:10.3847/1538-3881/aca5fb , archivePrefix =. 2208.08515 , primaryClass =
-
[21]
, keywords =
The DESI Bright Galaxy Survey: Final Target Selection, Design, and Validation. , keywords =. doi:10.3847/1538-3881/accff8 , archivePrefix =. 2208.08512 , primaryClass =
-
[23]
, keywords =
All-purpose, all-sky photometric redshifts for the Legacy Imaging Surveys Data Release 8. , keywords =. doi:10.1093/mnras/stac608 , archivePrefix =. 2203.01949 , primaryClass =
-
[27]
Planck 2018 results. VI. Cosmological parameters. , keywords =. doi:10.1051/0004-6361/201833910 , archivePrefix =. 1807.06209 , primaryClass =
2018 arXiv
-
[28]
, keywords =
HI4PI: A full-sky H I survey based on EBHIS and GASS. , keywords =. doi:10.1051/0004-6361/201629178 , archivePrefix =. 1610.06175 , primaryClass =
-
[30]
, keywords =
The completed SDSS-IV extended Baryon Oscillation Spectroscopic Survey: large-scale structure catalogues and measurement of the isotropic BAO between redshift 0.6 and 1.1 for the Emission Line Galaxy Sample. , keywords =. doi:10.1093/mnras/staa3336 , archivePrefix =. 2007.0900...
-
[31]
, keywords =
Dark Energy Survey Year 3 results: calibration of lens sample redshift distributions using clustering redshifts with BOSS/eBOSS. , keywords =. doi:10.1093/mnras/stac1160 , archivePrefix =. 2012.12826 , primaryClass =
2012 arXiv
-
[33]
, keywords =
A Full-sky, High-resolution Atlas of Galactic 12 m Dust Emission with WISE. , keywords =. doi:10.1088/0004-637X/781/1/5 , archivePrefix =. 1312.0947 , primaryClass =
-
[37]
, keywords =
Testing KiDS cross-correlation redshifts with simulations. , keywords =. doi:10.1051/0004-6361/202038835 , archivePrefix =. 2007.01846 , primaryClass =
2007 arXiv
-
[38]
, keywords =
The Completed SDSS-IV extended Baryon Oscillation Spectroscopic Survey: Large-scale structure catalogues for cosmological analysis. , keywords =. doi:10.1093/mnras/staa2416 , archivePrefix =. 2007.09000 , primaryClass =
2007 arXiv
-
[39]
, keywords =
The Cosmic Thermal History Probed by Sunyaev-Zeldovich Effect Tomography. , keywords =. doi:10.3847/1538-4357/abb403 , archivePrefix =. 2006.14650 , primaryClass =
2006 arXiv
-
[40]
, keywords =
The Sloan Digital Sky Survey Quasar Catalog: Sixteenth Data Release. , keywords =. doi:10.3847/1538-4365/aba623 , archivePrefix =. 2007.09001 , primaryClass =
2007 arXiv
-
[41]
, keywords =
unWISE tomography of Planck CMB lensing. , keywords =. doi:10.1088/1475-7516/2020/05/047 , archivePrefix =. 1909.07412 , primaryClass =
2020 arXiv
-
[42]
, keywords =
Broadband Intensity Tomography: Spectral Tagging of the Cosmic UV Background. , keywords =. doi:10.3847/1538-4357/ab1b35 , archivePrefix =. 1810.00885 , primaryClass =
-
[43]
, keywords =
The clustering of the SDSS-IV extended Baryon Oscillation Spectroscopic Survey DR14 quasar sample: first measurement of baryon acoustic oscillations between redshift 0.8 and 2.2. , keywords =. doi:10.1093/mnras/stx2630 , archivePrefix =. 1705.06373 , primaryClass =
-
[44]
, keywords =
the-wizz: clustering redshift estimation for everyone. , keywords =. doi:10.1093/mnras/stx342 , archivePrefix =. 1609.09085 , primaryClass =
-
[45]
, keywords =
The Sloan Digital Sky Survey Quasar Catalog: Twelfth data release. , keywords =. doi:10.1051/0004-6361/201527999 , archivePrefix =. 1608.06483 , primaryClass =
-
[46]
, keywords =
SDSS-III Baryon Oscillation Spectroscopic Survey Data Release 12: galaxy target selection and large-scale structure catalogues. , keywords =. doi:10.1093/mnras/stv2382 , archivePrefix =. 1509.06529 , primaryClass =
-
[47]
, keywords =
Clustering of intermediate redshift quasars using the final SDSS III-BOSS sample. , keywords =. doi:10.1093/mnras/stv1763 , archivePrefix =. 1507.08380 , primaryClass =
-
[48]
A 4 per cent distance measure at z = 0.15
The clustering of the SDSS DR7 main Galaxy sample - I. A 4 per cent distance measure at z = 0.15. , keywords =. doi:10.1093/mnras/stv154 , archivePrefix =. 1409.3242 , primaryClass =
-
[49]
, keywords =
On using angular cross-correlations to determine source redshift distributions. , keywords =. doi:10.1093/mnras/stt914 , archivePrefix =. 1302.0857 , primaryClass =
-
[50]
arXiv e-prints , keywords =
Clustering-based redshift estimation: method and application to data. arXiv e-prints , keywords =
-
[52]
The Sloan Digital Sky Survey Quasar Catalog. V. Seventh Data Release. , keywords =. doi:10.1088/0004-6256/139/6/2360 , archivePrefix =. 1004.1167 , primaryClass =
-
[53]
, keywords =
Calibrating Redshift Distributions beyond Spectroscopic Limits with Cross-Correlations. , keywords =. doi:10.1086/589982 , archivePrefix =. 0805.1409 , primaryClass =
-
[54]
, keywords =
Spectroscopic Target Selection in the Sloan Digital Sky Survey: The Main Galaxy Sample. , keywords =. doi:10.1086/342343 , archivePrefix =. astro-ph/0206225 , primaryClass =
-
[55]
, year = 2013, month = may, volume =
Recovering redshift distributions with cross-correlations: pushing the boundaries. , year = 2013, month = may, volume =. doi:10.1093/mnras/stt410 , archivePrefix =. 1303.0292 , primaryClass =
2013 arXiv
-
[56]
, year = 2015, month = mar, volume =
Clustering-based redshift estimation: comparison to spectroscopic redshifts. , year = 2015, month = mar, volume =. doi:10.1093/mnras/stu2636 , archivePrefix =. 1407.7860 , primaryClass =
2015 arXiv
-
[57]
, year = 2016, month = jul, volume =
Exploring the SDSS photometric galaxies with clustering redshifts. , year = 2016, month = jul, volume =. doi:10.1093/mnras/stw981 , archivePrefix =. 1512.03057 , primaryClass =
2016 arXiv
-
[58]
, year = 2016, month = oct, volume =
Clustering-based redshift estimation: application to VIPERS/CFHTLS. , year = 2016, month = oct, volume =. doi:10.1093/mnras/stw1500 , archivePrefix =. 1605.05501 , primaryClass =
2016 arXiv
-
[59]
, year = 2018, month = jun, volume =
Cross-correlation redshift calibration without spectroscopic calibration samples in DES Science Verification Data. , year = 2018, month = jun, volume =. doi:10.1093/mnras/sty787 , archivePrefix =. 1710.02517 , primaryClass =
2018 arXiv
-
[60]
, year = 2018, month = jun, volume =
Dark Energy Survey Year 1 results: cross-correlation redshifts - methods and systematics characterization. , year = 2018, month = jun, volume =. doi:10.1093/mnras/sty466 , archivePrefix =. 1709.00992 , primaryClass =
2018 arXiv
-
[61]
, year = 2022, month = feb, volume =
Dark Energy Survey Year 3 results: clustering redshifts - calibration of the weak lensing source redshift distributions with redMaGiC and BOSS/eBOSS. , year = 2022, month = feb, volume =. doi:10.1093/mnras/stab3311 , archivePrefix =. 2012.08569 , primaryClass =
2022
-
[62]
, year = 2019, month = jan, volume =
Extragalactic Imprints in Galactic Dust Maps. , year = 2019, month = jan, volume =. doi:10.3847/1538-4357/aaf4f6 , archivePrefix =. 1808.03294 , primaryClass =
2019 arXiv
-
[63]
, year = 2022, month = aug, volume =
Photometric Redshifts for Next-Generation Surveys. , year = 2022, month = aug, volume =. doi:10.1146/annurev-astro-032122-014611 , archivePrefix =. 2206.13633 , primaryClass =
2022 arXiv
-
[64]
, year = 2010, month = sep, volume =
Reconstructing Redshift Distributions with Cross-correlations: Tests and an Optimized Recipe. , year = 2010, month = sep, volume =. doi:10.1088/0004-637X/721/1/456 , archivePrefix =. 1003.0687 , primaryClass =
2010 arXiv
-
[65]
, year = 2005, month = apr, volume =
HEALPix: A Framework for High-Resolution Discretization and Fast Analysis of Data Distributed on the Sphere. , year = 2005, month = apr, volume =. doi:10.1086/427976 , archivePrefix =. astro-ph/0409513 , adsurl =
2005 arXiv
-
[66]
, year = 2019, month = may, volume =
Overview of the DESI Legacy Imaging Surveys. , year = 2019, month = may, volume =. doi:10.3847/1538-3881/ab089d , archivePrefix =. 1804.08657 , primaryClass =
2019 arXiv
-
[67]
, year = 2019, month = feb, volume =
The unWISE Catalog: Two Billion Infrared Sources from Five Years of WISE Imaging. , year = 2019, month = feb, volume =. doi:10.3847/1538-4365/aafbea , archivePrefix =. 1901.03337 , primaryClass =
2019 arXiv
-
[68]
arXiv e-prints , year = 2016, month = oct, eid =
The DESI Experiment Part I: Science, Targeting, and Survey Design. arXiv e-prints , year = 2016, month = oct, eid =
2016
-
[69]
, year = 2005, month = jan, volume =
The Galaxy Evolution Explorer: A Space Ultraviolet Survey Mission. , year = 2005, month = jan, volume =. doi:10.1086/426387 , archivePrefix =. astro-ph/0411302 , adsurl =
2005 arXiv
-
[70]
A low-frequency extragalactic catalogue
GaLactic and Extragalactic All-sky Murchison Widefield Array (GLEAM) survey - I. A low-frequency extragalactic catalogue. , year = 2017, month = jan, volume =. doi:10.1093/mnras/stw2337 , archivePrefix =. 1610.08318 , primaryClass =
2017 arXiv
-
[72]
, keywords =
The power spectrum of the thermal Sunyaev─Zeldovich effect. , keywords =. doi:10.1093/mnras/staf709 , archivePrefix =. 2502.10232 , primaryClass =
-
[73]
Planck 2015 results. XXII. A map of the thermal Sunyaev-Zeldovich effect. , year = 2016, month = sep, volume =. doi:10.1051/0004-6361/201525826 , archivePrefix =. 1502.01596 , primaryClass =
2015 arXiv
-
[74]
Planck 2018 results. I. Overview and the cosmological legacy of Planck. , year = 2020, month = sep, volume =. doi:10.1051/0004-6361/201833880 , archivePrefix =. 1807.06205 , primaryClass =
2018 arXiv
-
[75]
, keywords =
Euclid: Photometric redshift calibration performance with the clustering-redshifts technique in the Flagship 2 simulation. , keywords =. doi:10.1051/0004-6361/202555551 , archivePrefix =. 2505.10416 , primaryClass =
-
[76]
, keywords =
Corrected SFD: A More Accurate Galactic Dust Map with Minimal Extragalactic Contamination. , keywords =. doi:10.3847/1538-4357/acf4a1 , archivePrefix =. 2306.03926 , primaryClass =
-
[77]
, keywords =
Cosmic Infrared Background Tomography and a Census of Cosmic Dust and Star Formation. , keywords =. doi:10.3847/1538-4357/adfb6a , archivePrefix =. 2504.05384 , primaryClass =
-
[79]
, keywords =
Full calibration of the tomographic redshift distribution from the HSC PDR3 Shape Catalog with DESI. , keywords =. doi:10.1088/1475-7516/2026/05/073 , archivePrefix =. 2511.18133 , primaryClass =
2026 arXiv
-
[80]
, keywords =
The Angular Correlation Function of Galaxies from Early Sloan Digital Sky Survey Data. , keywords =. doi:10.1086/342787 , archivePrefix =. astro-ph/0107417 , primaryClass =
-
[81]
, keywords =
KiDS-1000 catalogue: Redshift distributions and their calibration. , keywords =. doi:10.1051/0004-6361/202039018 , archivePrefix =. 2007.15635 , primaryClass =
2007 arXiv
-
[84]
, keywords =
Inferring the redshift distribution of the cosmic infrared background. , keywords =. doi:10.1093/mnras/stu2275 , archivePrefix =. 1407.0031 , primaryClass =
-
[85]
, keywords =
The SDSS galaxy angular two-point correlation function. , keywords =. doi:10.1093/mnras/stt450 , archivePrefix =. 1303.2432 , primaryClass =
-
[86]
Part II: Approximation schemes
The Cosmic Linear Anisotropy Solving System (CLASS). Part II: Approximation schemes. , year = 2011, month = jul, volume =. doi:10.1088/1475-7516/2011/07/034 , archivePrefix =. 1104.2933 , primaryClass =
2011 arXiv
-
[87]
2025, arXiv e-prints, arXiv:2503.07923, 10.48550/arXiv.2503.07923
Besuner , R., Dey , A., Drlica-Wagner , A., et al. 2025, arXiv e-prints, arXiv:2503.07923, 10.48550/arXiv.2503.07923
2025 doi
-
[88]
R., Schlegel , D
Blanton , M. R., Schlegel , D. J., Strauss , M. A., et al. 2005, , 129, 2562, 10.1086/429803
2005 doi
-
[89]
2011, , 2011, 034, 10.1088/1475-7516/2011/07/034
Blas , D., Lesgourgues , J., & Tram , T. 2011, , 2011, 034, 10.1088/1475-7516/2011/07/034
2011 doi
-
[90]
Brown , R. A. 2014, arXiv e-prints, arXiv:1410.5420, 10.48550/arXiv.1410.5420
2014 doi
-
[91]
2022, , 513, 5517, 10.1093/mnras/stac1160
Cawthon , R., Elvin-Poole , J., Porredon , A., et al. 2022, , 513, 5517, 10.1093/mnras/stac1160
2022 doi
- [92]
-
[93]
2023, , 944, 107, 10.3847/1538-4357/acb3c2
Chaussidon , E., Y \`e che , C., Palanque-Delabrouille , N., et al. 2023, , 944, 107, 10.3847/1538-4357/acb3c2
2023 doi
-
[94]
2023, , 958, 118, 10.3847/1538-4357/acf4a1
Chiang , Y.-K. 2023, , 958, 118, 10.3847/1538-4357/acf4a1
2023 doi
-
[95]
2026, Nature Astronomy, 10, 742, 10.1038/s41550-026-02798-6
---. 2026, Nature Astronomy, 10, 742, 10.1038/s41550-026-02798-6
2026 doi
-
[96]
2025, , 992, 65, 10.3847/1538-4357/adfb6a
Chiang , Y.-K., Makiya , R., & M \'e nard , B. 2025, , 992, 65, 10.3847/1538-4357/adfb6a
2025 doi
-
[97]
2020, , 902, 56, 10.3847/1538-4357/abb403
Chiang , Y.-K., Makiya , R., M \'e nard , B., & Komatsu , E. 2020, , 902, 56, 10.3847/1538-4357/abb403
2020 doi
-
[98]
2019, , 870, 120, 10.3847/1538-4357/aaf4f6
Chiang , Y.-K., & M \'e nard , B. 2019, , 870, 120, 10.3847/1538-4357/aaf4f6
2019 doi
-
[99]
2019, , 877, 150, 10.3847/1538-4357/ab1b35
Chiang , Y.-K., M \'e nard , B., & Schiminovich , D. 2019, , 877, 150, 10.3847/1538-4357/ab1b35
2019 doi
-
[100]
Gontcho , S., Seljak , U., et al
Choppin de Janvry , J., Gontcho A. Gontcho , S., Seljak , U., et al. 2026, , 2026, 073, 10.1088/1475-7516/2026/05/073
2026 doi
-
[101]
J., Scranton , R., Johnston , D., et al
Connolly , A. J., Scranton , R., Johnston , D., et al. 2002, , 579, 42, 10.1086/342787
2002 doi
-
[102]
S., Duivenvoorden , A
Coulton , W., Madhavacheril , M. S., Duivenvoorden , A. J., et al. 2024, , 109, 063530, 10.1103/PhysRevD.109.063530
2024 doi
-
[103]
F., Mao , Y.-Y., et al
Darragh-Ford , E., Wu , J. F., Mao , Y.-Y., et al. 2023, , 954, 149, 10.3847/1538-4357/ace902
2023 doi
-
[104]
2025, , 702, A155, 10.1051/0004-6361/202555551
d'Assignies , W., Manera , M., Padilla , C., et al. 2025, , 702, A155, 10.1051/0004-6361/202555551
2025 doi
-
[105]
2018, , 477, 2196, 10.1093/mnras/sty787
Davis , C., Gatti , M., Vielzeuf , P., et al. 2018, , 477, 2196, 10.1093/mnras/sty787
2018 doi
-
[106]
Davis , M., & Peebles , P. J. E. 1983, , 267, 465, 10.1086/160884
1983 doi
-
[107]
2016, arXiv e-prints, arXiv:1611.00036
DESI Collaboration , Aghamousa , A., Aguilar , J., et al. 2016, arXiv e-prints, arXiv:1611.00036. 1611.00036
2016 arXiv
-
[108]
J., Lang , D., et al
Dey , A., Schlegel , D. J., Lang , D., et al. 2019, , 157, 168, 10.3847/1538-3881/ab089d
2019 doi
-
[109]
Duncan , K. J. 2022, , 512, 3662, 10.1093/mnras/stac608
2022 doi
-
[110]
2025, , 540, 1055, 10.1093/mnras/staf709
Efstathiou , G., & McCarthy , F. 2025, , 540, 1055, 10.1093/mnras/staf709
2025 doi
-
[111]
D., White , M., et al
Eftekharzadeh , S., Myers , A. D., White , M., et al. 2015, , 453, 2779, 10.1093/mnras/stv1763
2015 doi
-
[112]
Gaia Collaboration , Prusti , T., de Bruijne , J. H. J., et al. 2016, , 595, A1, 10.1051/0004-6361/201629272
2016 doi
-
[113]
Gaia Collaboration , Bailer-Jones , C. A. L., Teyssier , D., et al. 2023, , 674, A41, 10.1051/0004-6361/202243232
2023 doi
-
[114]
M., et al
Gatti , M., Giannini , G., Bernstein , G. M., et al. 2022, , 510, 1223, 10.1093/mnras/stab3311
2022 doi
-
[115]
2018, , 477, 1664, 10.1093/mnras/sty466
Gatti , M., Vielzeuf , P., Davis , C., et al. 2018, , 477, 1664, 10.1093/mnras/sty466
2018 doi
-
[116]
M., Hivon , E., Banday , A
G \'o rski , K. M., Hivon , E., Banday , A. J., et al. 2005, , 622, 759, 10.1086/427976
2005 doi
-
[117]
J., Ruiz-Macias , O., et al
Hahn , C., Wilson , M. J., Ruiz-Macias , O., et al. 2023, , 165, 253, 10.3847/1538-3881/accff8
2023 doi
-
[118]
2016, , 594, A116, 10.1051/0004-6361/201629178
HI4PI Collaboration , Ben Bekhti , N., Fl \"o er , L., et al. 2016, , 594, A116, 10.1051/0004-6361/201629178
2016 doi
-
[119]
L., Wright , A
Hildebrandt , H., van den Busch , J. L., Wright , A. H., et al. 2021, , 647, A124, 10.1051/0004-6361/202039018
2021 doi
-
[120]
R., Hancock , P
Hurley-Walker , N., Callingham , J. R., Hancock , P. J., et al. 2017, , 464, 1146, 10.1093/mnras/stw2337
2017 doi
-
[121]
M., Tyson , J
Ivezi \'c , Z ., Kahn , S. M., Tyson , J. A., et al. 2019, , 873, 111, 10.3847/1538-4357/ab042c
2019 doi
-
[122]
V., Piskunov , A
Kharchenko , N. V., Piskunov , A. E., Schilbach , E., R \"o ser , S., & Scholz , R.-D. 2013, , 558, A53, 10.1051/0004-6361/201322302
2013 doi
- [123]
-
[124]
F., & White , M
Krolewski , A., Ferraro , S., Schlafly , E. F., & White , M. 2020, , 2020, 047, 10.1088/1475-7516/2020/05/047
2020 doi
-
[125]
J., et al
Krolewski , A., Dalal , N., Percival , W. J., et al. 2026, arXiv e-prints, arXiv:2606.16297, 10.48550/arXiv.2606.16297
2026 doi
- [126]
-
[127]
Limber , D. N. 1953, , 117, 134, 10.1086/145672
1953 doi
-
[128]
Loh , J. M. 2008, , 681, 726, 10.1086/588631
2008 doi
-
[129]
W., Higley , A
Lyke , B. W., Higley , A. N., McLane , J. N., et al. 2020, , 250, 8, 10.3847/1538-4365/aba623
2020 doi
-
[130]
2014, , 52, 415, 10.1146/annurev-astro-081811-125615
Madau , P., & Dickinson , M. 2014, , 52, 415, 10.1146/annurev-astro-081811-125615
2014 doi
- [131]
-
[132]
H., et al
Mao , Y.-Y., Geha , M., Wechsler , R. H., et al. 2021, , 907, 85, 10.3847/1538-4357/abce58
2021 doi
-
[133]
J., & Newman , J
Matthews , D. J., & Newman , J. A. 2010, , 721, 456, 10.1088/0004-637X/721/1/456
2010 doi
-
[134]
2013, , 433, 2857, 10.1093/mnras/stt914
McQuinn , M., & White , M. 2013, , 433, 2857, 10.1093/mnras/stt914
2013 doi
-
[135]
M., & Finkbeiner , D
Meisner , A. M., & Finkbeiner , D. P. 2014, , 781, 5, 10.1088/0004-637X/781/1/5
2014 doi
-
[136]
2013, arXiv e-prints, arXiv:1303.4722
M \'e nard , B., Scranton , R., Schmidt , S., et al. 2013, arXiv e-prints, arXiv:1303.4722. 1303.4722
2013 arXiv
-
[137]
B., Hildebrandt , H., Schmidt , S
Morrison , C. B., Hildebrandt , H., Schmidt , S. J., et al. 2017, , 467, 3576, 10.1093/mnras/stx342
2017 doi
-
[138]
Newman , J. A. 2008, , 684, 88, 10.1086/589982
2008 doi
-
[139]
A., & Gruen , D
Newman , J. A., & Gruen , D. 2022, , 60, 363, 10.1146/annurev-astro-032122-014611
2022 doi
-
[140]
P., et al
P \^a ris , I., Petitjean , P., Ross , N. P., et al. 2017, , 597, A79, 10.1051/0004-6361/201527999
2017 doi
-
[141]
W., Pointecouteau , E., & Melin , J.-B
Piffaretti , R., Arnaud , M., Pratt , G. W., Pointecouteau , E., & Melin , J.-B. 2011, , 534, A109, 10.1051/0004-6361/201015377
2011 doi
-
[142]
2016 a , , 594, A22, 10.1051/0004-6361/201525826
Planck Collaboration , Aghanim , N., Arnaud , M., et al. 2016 a , , 594, A22, 10.1051/0004-6361/201525826
2016 doi
-
[143]
Planck Collaboration , Adam , R., Ade , P. A. R., et al. 2016 b , , 594, A8, 10.1051/0004-6361/201525820
2016 doi
-
[144]
Planck Collaboration , Ade , P. A. R., Aghanim , N., et al. 2016 c , , 594, A26, 10.1051/0004-6361/201526914
2016 doi
-
[145]
2020, , 641, A6, 10.1051/0004-6361/201833910
Planck Collaboration , Aghanim , N., Akrami , Y., et al. 2020, , 641, A6, 10.1051/0004-6361/201833910
2020 doi
-
[146]
J., & Morrison , C
Rahman , M., M \'e nard , B., Scranton , R., Schmidt , S. J., & Morrison , C. B. 2015, , 447, 3500, 10.1093/mnras/stu2636
2015 doi
-
[147]
J., M \'e nard , B., et al
Rahman , M., Mendez , A. J., M \'e nard , B., et al. 2016, , 460, 163, 10.1093/mnras/stw981
2016 doi
-
[148]
J., et al
Raichoor , A., de Mattia , A., Ross , A. J., et al. 2021, , 500, 3254, 10.1093/mnras/staa3336
2021 doi
-
[149]
A., et al
Raichoor , A., Moustakas , J., Newman , J. A., et al. 2023, , 165, 126, 10.3847/1538-3881/acb213
2023 doi
-
[150]
2016, , 455, 1553, 10.1093/mnras/stv2382
Reid , B., Ho , S., Padmanabhan , N., et al. 2016, , 455, 1553, 10.1093/mnras/stv2382
2016 doi
-
[151]
J., Samushia , L., Howlett , C., et al
Ross , A. J., Samushia , L., Howlett , C., et al. 2015, , 449, 835, 10.1093/mnras/stv154
2015 doi
-
[152]
J., Bautista , J., Tojeiro , R., et al
Ross , A. J., Bautista , J., Tojeiro , R., et al. 2020, , 498, 2354, 10.1093/mnras/staa2416
2020 doi
-
[153]
2025, arXiv e-prints, arXiv:2512.15963, 10.48550/arXiv.2512.15963
Ruggeri , R., Blake , C., Aguilar , J., et al. 2025, arXiv e-prints, arXiv:2512.15963, 10.48550/arXiv.2512.15963
2025 doi
- [154]
-
[155]
F., Meisner , A
Schlafly , E. F., Meisner , A. M., & Green , G. M. 2019, , 240, 30, 10.3847/1538-4365/aafbea
2019 doi
-
[156]
J., M \'e nard , B., Scranton , R., Morrison , C., & McBride , C
Schmidt , S. J., M \'e nard , B., Scranton , R., Morrison , C., & McBride , C. K. 2013, , 431, 3307, 10.1093/mnras/stt410
2013 doi
-
[157]
J., M \'e nard , B., Scranton , R., et al
Schmidt , S. J., M \'e nard , B., Scranton , R., et al. 2015, , 446, 2696, 10.1093/mnras/stu2275
2015 doi
-
[158]
P., Richards , G
Schneider , D. P., Richards , G. T., Hall , P. B., et al. 2010, , 139, 2360, 10.1088/0004-6256/139/6/2360
2010 doi
-
[159]
R., et al
Scottez , V., Mellier , Y., Granett , B. R., et al. 2016, , 462, 1683, 10.1093/mnras/stw1500
2016 doi
-
[160]
E., Peacock , J
Smith , R. E., Peacock , J. A., Jenkins , A., et al. 2003, , 341, 1311, 10.1046/j.1365-8711.2003.06503.x
2003
-
[161]
L., Egger , R., Freyberg , M
Snowden , S. L., Egger , R., Freyberg , M. J., et al. 1997, , 485, 125, 10.1086/304399
1997 doi
-
[162]
A., Weinberg , D
Strauss , M. A., Weinberg , D. H., Lupton , R. H., et al. 2002, , 124, 1810, 10.1086/342343
2002 doi
-
[163]
L., Hildebrandt , H., Wright , A
van den Busch , J. L., Hildebrandt , H., Wright , A. H., et al. 2020, , 642, A200, 10.1051/0004-6361/202038835
2020 doi
-
[164]
J., & Dolence , J
Wang , Y., Brunner , R. J., & Dolence , J. C. 2013, , 432, 1961, 10.1093/mnras/stt450
2013 doi
-
[165]
D., Ross , N
White , M., Myers , A. D., Ross , N. P., et al. 2012, , 424, 933, 10.1111/j.1365-2966.2012.21251.x
2012
-
[166]
F., Peek , J
Wu , J. F., Peek , J. E. G., Tollerud , E. J., et al. 2022, , 927, 121, 10.3847/1538-4357/ac4eea
2022 doi
-
[167]
G., Adelman , J., Anderson , Jr., J
York , D. G., Adelman , J., Anderson , Jr., J. E., et al. 2000, , 120, 1579, 10.1086/301513
2000 doi
-
[168]
A., et al
Zhou , R., Dey , B., Newman , J. A., et al. 2023, , 165, 58, 10.3847/1538-3881/aca5fb
2023 doi
Reviewed August 15, 2026 · model on record in the stance chip above.
Discussion (0). Continue with ORCID to comment.