REVIEW 4 major objections 4 minor 28 references
Towards optimal photometric calibration of digital astronomical plates with deep learning
T0 review · 4 major / 4 minor · reviewed 2026-08-06 · deepseek-v4-flash
Pith's one-line read Deep learning doubles precision of historical plate photometry
desk verdict A credible mechanism and a new joint-calibration net, but the reported factor-of-two gain is measured on a test set that steered training; needs a clean split before I'd quote the numbers. read the letter →
The pith
A machine-rendered reading of the paper's core claim, the machinery that carries it, and where it could break.
The reading
What carries the argument
MFF-Net is a multi-layer fully connected network that takes four features—instrumental magnitude, color (BP−RP), and pixel coordinates (x, y)—and predicts the magnitude correction Δm = m_std − m_inst. It combines a fourth-order polynomial expansion in magnitude and second-order in color (matching the MYX25 formulation) with Fourier feature encoding of position, which allows the network to represent multi-scale spatial systematics. The explicit encodings let the network model the coupled, nonlinear dependencies among the input variables, directly addressing the failure of separable models.
What would settle it
Train MFF-Net on one random half of a plate's standard stars and validate on the other half, with no test-set feedback during training; if the precision gain over MYX25 shrinks or vanishes, the reported improvement is an artifact of the test set being used to drive training.
Extended reading notes
Core claim
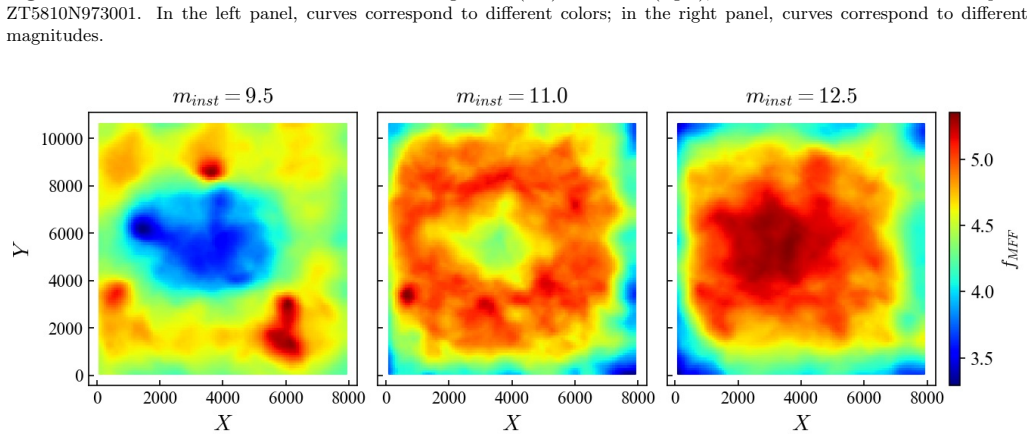
The central discovery is that the magnitude–position coupling seen in post-calibration residuals of digitized photographic plates is driven by magnitude-dependent spatial variations in image quality (FWHM). Because the plate response depends on surface brightness rather than total flux, stars of equal total brightness but different image quality require different magnitude corrections. The paper shows through simulations that a separable model like MYX25 cannot capture this coupling, and that a neural network—MFF-Net—which jointly learns a nonlinear correction as a function of magnitude, color, and position, removes the residual structure and improves photometric precision by nearly a factor
Load-bearing premise
The reported accuracy assumes the 20% test split is a clean held-out set, but the training loop uses that same test set to decide learning-rate decay and when to stop, so generalization gains may be overstated.
Editorial extensions
If this is right
- Historical plate archives such as those digitized in China can be recalibrated with MFF-Net to achieve sub-0.1 mag precision for bright stars, enabling more reliable time-domain and variability studies.
- The method can be adapted to other plate collections that have sufficient standard-star coverage, potentially improving the photometric homogeneity of legacy sky surveys worldwide.
- The finding that image-quality variations cause magnitude–position coupling suggests that future plate digitization efforts should record or model FWHM information to support more accurate calibration.
- The ability to model cross-term corrections with a single network may inspire similar deep-learning approaches for other nonlinear detectors or non-standard photometric systems.
Reading between the lines
- The same architecture could be applied to CCD data with spatially varying point-spread functions, where conventional flat-fielding assumes separability but PSF-induced magnitude biases may remain.
- The paper's attribution of the coupling to FWHM suggests a testable physical model: if plate response depends on surface brightness, a FWHM-based correction term could be added to traditional separable models, potentially achieving MFF-Net's precision with a simpler, interpretable function.
- Because the test set is used to drive learning-rate decay and early stopping, independent validation on truly held-out plates or a separate subset is needed to confirm that the reported gains generalize, a concern the paper does not explicitly address.
Editorial analysis
A structured set of objections, weighed in public.
Referee Report
Summary. The paper introduces MFF-Net, a neural-network-based photometric calibration model for digitized astronomical plates. The network takes instrumental magnitude, color, and pixel coordinates, applies a polynomial expansion for magnitude/color and a Fourier feature encoding for position, and predicts a magnitude correction trained with a Huber loss using standard-star residuals. Using 1,200 Chinese plates, the authors report that MFF-Net outperforms the separable MYX25 method, improving the 5th–95th percentile precision from 0.11–0.26 mag to 0.08–0.18 mag and delivering about a factor-of-two gain for bright sources. They also use simulations on one plate to argue that magnitude-dependent spatial variations in FWHM drive the coupled residuals that MYX25 misses.
Significance. If the reported gains survive an unbiased evaluation, this is a practically valuable contribution: historical plate archives contain millions of plates, and a flexible nonlinear calibrator that removes brightness–position coupling could improve their photometric utility. The paper also makes a concrete, testable physical claim (FWHM-driven coupling) and provides a broad empirical comparison across 1,200 plates, with a simple architecture and modest computational cost (tens to ~100 s per plate on one GPU). The residual maps on the example plate show a visible reduction of annular structure compared with MYX25. However, the central quantitative claims currently rest on an evaluation protocol that uses the test set for training decisions, and they lack uncertainty estimates. The accepted strength of the empirical contribution is therefore not yet established.
major comments (4)
- [§3, Training strategy] The text states: 'Every 20 epochs, we evaluate on the test set; if the mean residual over all sources falls below 0.025 and the test loss has decreased by less than 2x10^-4 since the previous evaluation, we reduce the learning rate by a factor of 0.2. Training terminates once the learning rate falls below 2x10^-6.' This explicitly uses the test set for learning-rate scheduling and early stopping, so the test set functions as a validation set. The reported precision on that set—the basis of the Abstract, Section 1, and Fig. 9—is therefore an optimistically biased estimate of generalization. The magnitude of the bias is unknown but potentially non-negligible given the network's flexibility and the repeated every-20-epoch decisions. The authors must re-run the evaluation with a genuinely held-out split (or a three-way split) and report the untouched test-set metrics.
- [§4 / Fig. 9] No uncertainties are reported on any of the precision values. The headline numbers (0.11–0.26 mag vs 0.08–0.18 mag) are presented as point estimates over 1,200 plates, but there are no error bars, confidence intervals, or plate-to-plate scatter statistics. It is also unclear what 'precision' means exactly (per-plate RMS? median absolute residual?) and how the 5th–95th percentile range is computed. Without uncertainty estimates, the claimed improvements—especially the 'factor of two' for bright sources—cannot be distinguished from noise, particularly given the known contamination described above. The authors should provide bootstrapped confidence intervals and specify the exact statistic plotted in Fig. 9.
- [§2, Simulation experiments] The attribution of coupled residuals to magnitude-dependent FWHM rests on simulations that use 'the plate response curve' to convert standard magnitudes to simulated instrumental magnitudes. The response curve is never specified: is it taken from the MYX25 calibration, fitted independently from standard stars, or assumed from first principles? If the response curve is derived from the very residuals being explained, the experiment is partly circular. Please state the functional form and provenance of the response curve, and ideally demonstrate that the simulation result is robust to reasonable variations in that curve.
- [§3, Hyperparameters] The authors write that 'All hyperparameters were selected empirically on our dataset' and that MFF-Net is 'stable over a reasonable range of settings,' but no details or supporting experiments are given. Because the test set is already used for training decisions, the hyperparameter selection may also be influenced by the same set, further weakening the independence of the evaluation. The authors should describe the hyperparameter search, including which set was used for model selection, and provide ablation or stability evidence for the claimed robustness.
minor comments (4)
- [Abstract / §3] The phrase 'Tests on 1,200 digitized Chinese plates' is slightly misleading: the evaluation is performed on a 20% star-level split per plate, not on 1,200 independent plate-level test sets. Please clarify this in the abstract or methods.
- [Fig. 9] The definition of bright sources as m_inst < (m_min + m_max)/2 is arbitrary and plate-dependent. A sensitivity check (e.g., using the 25th percentile, or a fixed absolute magnitude cut when available) would strengthen the bright-source claim.
- [Eq. (4)] The summation index appears as 'NM k=0' in the text; it should be 'N' or 'N-1' with a clear convention. The text also says '8 + 4×(N+1)' for the encoded feature dimension; please verify that this matches Eq. (4) as typeset.
- [§2] The statement that 'when the image quality is spatially uniform, the residual maps remain correspondingly uniform across magnitude' is presented without quantitative support. If this is based on visual inspection, say so; if it is a statistical test, report it.
Circularity Check
No significant circularity; the calibration target is external, though the 'test set' doubles as a validation set for early stopping, which is a separate evaluation-bias concern.
full rationale
The paper's central claim is a supervised regression: MFF-Net maps instrumental magnitude, color, and pixel coordinates to external standard magnitudes from the BEST catalog. The reported residuals are computed against those external labels, so the calibration result is not a tautology or a fit renamed as a prediction. The baseline MYX25 is a prior paper by the same group, but it functions as a comparison method, not as a load-bearing justification; no uniqueness theorem or untested ansatz is imported from it. The FWHM attribution is tested via forward simulations that inject FWHM-dependent surface-brightness effects and show that MYX25 reproduces the observed residual pattern; this is a controlled experiment, not a circular fit. The one notable methodological weakness is that the 'test set' is used for the learning-rate schedule and early stopping (Section 3: 'Every 20 epochs, we evaluate on the test set... Training terminates once the learning rate falls below 2e-6'), which makes the reported 5th-95th percentile precision an optimistically biased estimate of generalization. However, this is a validation leak, not a definitional circularity, and does not make the derivation equivalent to its inputs by construction. The FWHM simulation's plate response curve is not fully specified, but this is a reproducibility limitation rather than a circular step. Overall, the derivation chain is self-contained and the central claim has independent empirical content.
Assumptions & free parameters
free parameters (6)
- Fourier frequency count N (Eq. 5) =
2, 3, or 4 depending on standard-star count S
- Polynomial expansion degree for magnitude =
4
- Polynomial expansion degree for color =
2
- Huber loss threshold delta =
0.2
- Hidden layer width and count =
128 neurons per layer; total count unspecified
- Learning rate schedule thresholds =
initial 2e-4, decay factor 0.2, mean residual threshold 0.025, test-loss decrease 2e-4, terminate at 2e-6
assumptions (4)
- domain assumption Photographic plates respond to surface brightness rather than total flux
- domain assumption The BEST standard-star catalog provides accurate reference magnitudes for calibration
- domain assumption A neural network with inputs (m_inst, BP-RP, x, y) can represent the true correction function
- domain assumption The plate response curve used in the simulations is representative of the actual plate
Cite this review
Pith. "Pith review of Towards optimal photometric calibration of digital astronomical plates with deep learning." pith.science (2026). https://pith.science/paper/VFKAYFLU
@misc{pith2026260801391,
  author       = {Pith},
  title        = {Pith review of: Towards optimal photometric calibration of digital astronomical plates with deep learning},
  year         = {2026},
  howpublished = {\url{https://pith.science/paper/VFKAYFLU}},
  note         = {Machine review of arXiv:2608.01391}
}
read the original abstract
Photometric calibration of digitized photographic plates is commonly modeled with separable magnitude-, color-, and position-dependent terms, but this separability can break down when image quality varies across the field in a magnitude-dependent way, leaving coupled spatial systematics in the residuals. We introduce a deep-learning calibration framework, the Multi-Feature Fused Network (MFF-Net), which takes instrumental magnitude, color, and pixel coordinates as input and learns a single nonlinear correction that jointly captures their coupled dependencies. Tests on 1{,}200 digitized Chinese plates show that MFF-Net consistently outperforms the MYX25 method (Ma et al. 2025), improving the 5th--95th percentile precision from 0.11--0.26~mag to 0.08--0.18~mag and delivering an approximately factor-of-two gain for bright sources. The learned correction largely removes the magnitude--position coupling seen in post-calibration residual maps, enabling higher-precision plate photometry and more reliable use of large historical plate archives.
Figures


Figures from the paper (5 more)




Reference graph
Works this paper leans on
-
[1]
Barron, J. T., Mildenhall, B., Tancik, M., et al.\ 2021, 2021 IEEE/CVF International Conference on Computer Vision (ICCV), 580. doi:10.1109/ICCV48922.2021.00580
arXiv 2021
-
[2]
& Murphy, S.\ 2012, , 124, 912, 140
Bessell, M. & Murphy, S.\ 2012, , 124, 912, 140. doi:10.1086/664083
doi:10.1086/664083 2012
-
[3]
Boyle, B. J., Shanks, T., & Croom, S. M.\ 1995, , 276, 1, 33. doi:10.1093/mnras/276.1.33
-
[4]
Croom, S. M., Ratcliffe, A., Parker, Q. A., et al.\ 1999, , 306, 3, 592. doi:10.1046/j.1365-8711.1999.02560.x
arXiv 1999
-
[5]
doi:10.1051/0004-6361/202348793
Enke, H., Tuvikene, T., Groote, D., et al.\ 2024, , 687, A165. doi:10.1051/0004-6361/202348793
-
[7]
Hambly, N. C., MacGillivray, H. T., Read, M. A., et al.\ 2001, , 326, 4, 1279. doi:10.1111/j.1365-2966.2001.04660.x
arXiv 2001
-
[8]
A., Templeton, M., Terrell, D., et al.\ 2016, VizieR Online Data Catalog, 2336
Henden, A. A., Templeton, M., Terrell, D., et al.\ 2016, VizieR Online Data Catalog, 2336. II/336
work page 2016
-
[9]
Hoeg, E., B \"a ssgen, G., Bastian, U., et al.\ 1997, , 323, L57
work page 1997
Show all 28 references
-
[10]
doi:10.3847/1538-4365/ad18b1
Huang, B., Yuan, H., Xiang, M., et al.\ 2024, , 271, 1, 13. doi:10.3847/1538-4365/ad18b1
2024 doi
-
[11]
doi:10.1002/asna.201813515
Hudec, R.\ 2018, Astronomische Nachrichten, 339, 5, 408. doi:10.1002/asna.201813515
2018 doi
-
[12]
doi:10.1002/asna.201913676
Hudec, R.\ 2019, Astronomische Nachrichten, 340, 7, 690. doi:10.1002/asna.201913676
2019 doi
-
[13]
C., & Driffield, V
Hurter, F. C., & Driffield, V. C. \ 1890, J. Soc. Chem. Ind., 9, 5, 455. doi:10.1002/jctb.5000090508
-
[14]
Gaia Collaboration, Brown, A. G. A., Vallenari, A., et al.\ 2021, , 650, C3. doi:10.1051/0004-6361/202039657e
2021 doi
-
[15]
Gaia Collaboration, Vallenari, A., Brown, A. G. A., et al.\ 2023, , 674, A1. doi:10.1051/0004-6361/202243940
2023 doi
-
[16]
Grindlay, J., Tang, S., Simcoe, R., et al.\ 2009, Preserving Astronomy's Photographic Legacy: Current State and the Future of North American Astronomical Plates, 410, 101
2009
-
[17]
Kovalevsky, J., Lindegren, L., Perryman, M. A. C., et al.\ 1997, , 323, 620
1997
-
[18]
European Space Agency (ESA). 1997. The Hipparcos and Tycho Catalogues. Report No. ESA SP-1200, Noordwijk, The Netherlands: ESA Publications Division
1997
- [19]
-
[20]
M., Sturch, C
Lasker, B. M., Sturch, C. R., Lopez, C., et al.\ 1988, , 68, 1. doi:10.1086/191282
1988 doi
-
[21]
doi:10.1088/0004-6256/140/4/1062
Laycock, S., Tang, S., Grindlay, J., et al.\ 2010, , 140, 4, 1062. doi:10.1088/0004-6256/140/4/1062
2010 doi
-
[22]
doi:10.3847/1538-4365/adec7e
Ma, M., Yuan, H., Xiao, K., et al.\ 2025, , 280, 1, 18. doi:10.3847/1538-4365/adec7e
2025 doi
- [23]
-
[24]
Hurter, F. I G. \ 1954, Apr., 1, 3, 131. doi:10.2307/1504975
1954 doi
-
[25]
E., Hinton, G
Rumelhart, D. E., Hinton, G. E., & Williams, R. J.\ 1986, , 323, 6088, 533. doi:10.1038/323533a0
1986 doi
-
[26]
L., Lasker, B
Russell, J. L., Lasker, B. M., McLean, B. J., et al.\ 1990, , 99, 2059. doi:10.1086/115484
1990 doi
-
[27]
doi:10.1088/1674-4527/ad339d
Shang, Z.-J., Yu, Y., Wang, L.-L., et al.\ 2024, Research in Astronomy and Astrophysics, 24, 5, 055010. doi:10.1088/1674-4527/ad339d
2024 doi
-
[28]
doi:10.1086/671760
Tang, S., Grindlay, J., Los, E., et al.\ 2013, , 125, 929, 857. doi:10.1086/671760
2013 doi
-
[29]
doi:10.1038/s41597-026-06590-z
Xiao, K., Huang, Y., Yuan, H., et al.\ 2026, Nature Scientific Data, 13, 1, 265. doi:10.1038/s41597-026-06590-z
2026 doi
Reviewed August 6, 2026 · model on record in the stance chip above.
Discussion (0). Sign in to comment.