REVIEW 3 major objections 7 minor 37 references
ALMA CO Observations of a Giant Molecular Cloud in M33: Evidence for High-Mass Star Formation Triggered by Cloud-Cloud Collisions
T0 review · 3 major / 7 minor · reviewed 2026-08-14 · deepseek-v4-flash
Pith's one-line read ALMA observations of a giant molecular cloud in M33 show that roughly ten high-mass stars there were born from a collision between two molecular clouds about a million years ago.
desk verdict M33GMC 37 is now the best-resolved GMC in M33 and the two-cloud kinematics plus embedded mm sources are a real result; the CCC interpretation is plausible but not airtight, so treat the causal conclusion as conditional. read the letter →
The pith
A machine-rendered reading of the paper's core claim, the machinery that carries it, and where it could break.
The reading
What carries the argument
The load-bearing machinery is the set of four observational collision criteria the paper applies: (1) a supersonic velocity separation between two clouds, (2) a complementary spatial distribution, quantified by the Pearson correlation coefficient between the two clouds' intensity maps as a function of spatial displacement, (3) a bridging feature, an intermediate-velocity component connecting the two clouds, and (4) a V-shaped structure in the position-velocity diagram. These signatures were established by earlier simulations and observations as diagnostics of head-on cloud-cloud collisions, and the paper uses them to classify M33GMC 37. The correlation-coefficient minimisation turns the visual impression of complementarity into a quantitative displacement of about 6.2 pc, while the position-velocity V-shape ties the kinematics to a collision geometry rather than to expanding shells.
What would settle it
A decisive test would be to map M33GMC 37 in an optically thin molecular-line tracer such as C18O at even finer scale and look for a thin, high-density compressed layer between the red and blue clouds: the collision scenario predicts that the three continuum sources and the dense-gas peak should lie inside such a layer at the vertex of the V-shaped structure, whereas alternative explanations would place the sources offset from any such layer or would show the V shape produced by a single cloud's rotation or outflow.
Extended reading notes
Core claim
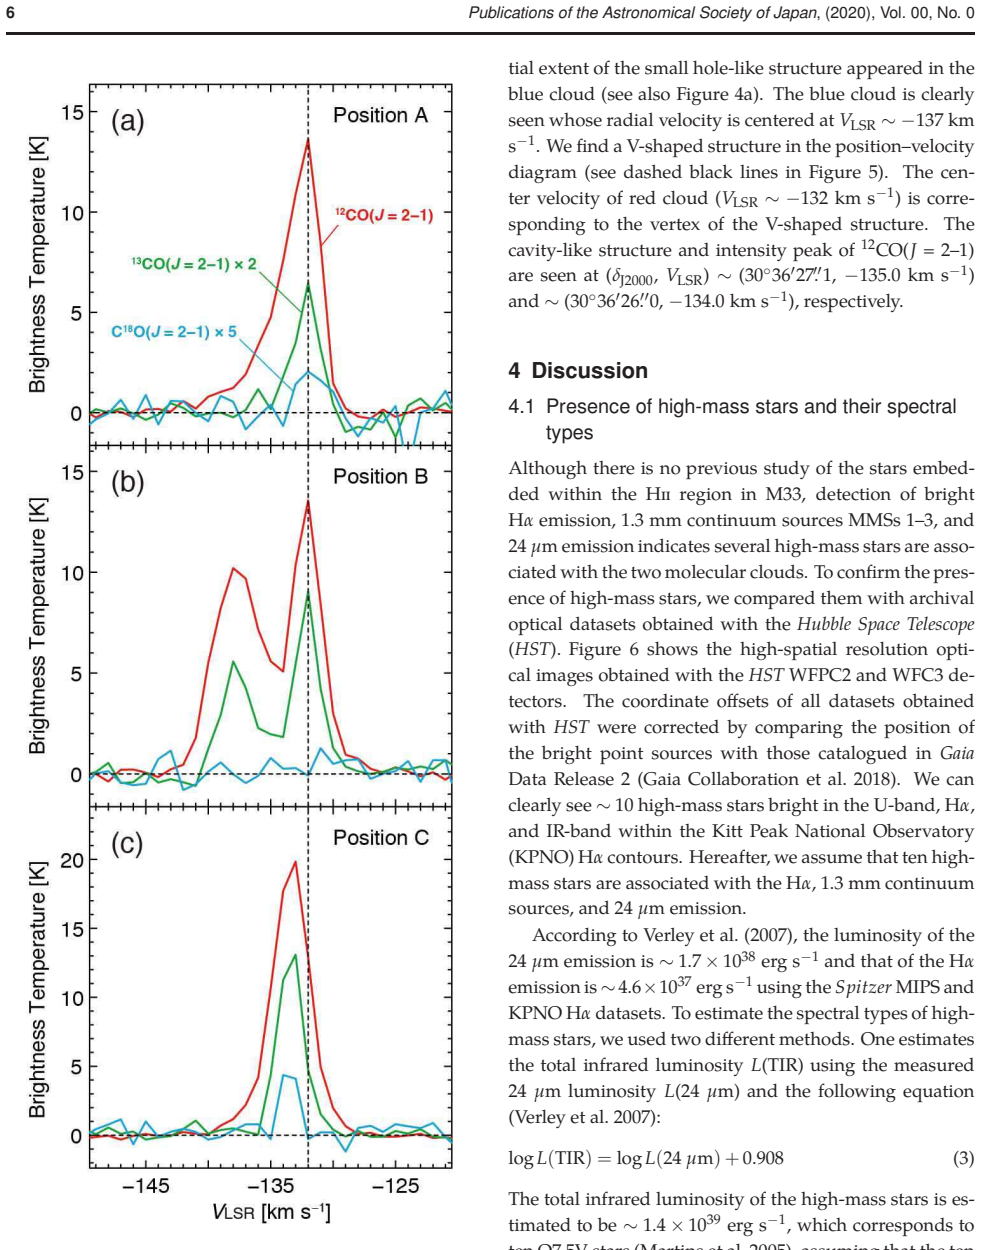
The paper's central discovery claim is that M33GMC 37, a giant molecular cloud in the spiral galaxy M33, is the site of a cloud-cloud collision that formed high-mass stars. ALMA's roughly 2 parsec resolution CO observations reveal two molecular clouds, a blue cloud at VLSR of about -143 to -134 km/s and a red cloud at about -133 to -127 km/s, separated by about 6 km/s. Embedded in the densest C18O gas are three 1.3 mm continuum sources, associated with H-alpha and 24 micron emission, that together correspond to up to ten high-mass stars of spectral type B0V to O7.5V. The clouds show a complementary spatial distribution with a best-fit spatial displacement of about 6.2 pc and a correlation coefficient minimum of -0.44, and the position-velocity diagram shows a V-shaped structure with an intermediate-velocity bridging feature. The authors conclude that the velocity separation cannot be produced by stellar winds or outflows, that the four observed signatures match the distinctive pattern of a head-on cloud-cloud collision, and that the collision occurred about 1 Myr ago.
Load-bearing premise
The entire collision interpretation rests on the premise that a complementary spatial distribution, a bridging velocity component, and a V-shaped position-velocity diagram are unique to cloud-cloud collisions and cannot be produced by expanding shells, unrelated foreground or background clouds, or internal velocity gradients.
Editorial extensions
If this is right
- If the central claim is right, cloud-cloud collisions operate as a star formation trigger not only in the Milky Way and Magellanic Clouds but also in a normal spiral galaxy in the Local Group, supporting the universality of the mechanism.
- The observed parameters of M33GMC 37, with column density around 4 to 5 times 10^22 per square centimeter and velocity separation around 6 km/s, fall on the trend from Milky Way collision sites that relates cloud column density and relative velocity to the number of OB stars formed, suggesting no critical difference between environments.
- The collision timescale of about 1 Myr is shorter than the roughly 1.5 Myr dispersal time of giant molecular clouds, which is consistent with the presence of dense molecular gas and a compact H II region around the young massive stars.
- High-mass star formation by cloud-cloud collision can occur with relatively modest cloud column densities, producing at most about ten O-type stars, rather than super star clusters that require column densities near 10^23 per square centimeter.
Reading between the lines
- Editorial inference: the four-signature method has a possible degeneracy, because expanding shells and chance line-of-sight pairings can mimic parts of the V-shape and complementary distributions; a stronger test would be a search for a separate intermediate-velocity atomic or ionised gas component, or for stellar proper motions consistent with the post-collision flow.
- Editorial inference: if collisions trigger high-mass star formation in M33, then a census of GMCs showing double-cloud morphology in high-resolution CO surveys of that galaxy could estimate what fraction of massive stars in M33 form through this channel; the paper does not attempt such a census.
- Editorial inference: the spectral-type estimate comes from integrated H-alpha and 24 micron luminosities assuming all ten stars share the same type; resolving individual stars would allow the collision-formation model to be checked against the stellar mass distribution, since collision theories make specific predictions about the masses formed in the compressed layer.
- Editorial inference: a direct check would be finer-scale C18O or dust continuum mapping to show whether the three continuum sources actually lie in the compressed collision layer, as the scenario requires, or are merely projected onto the cloud pair.
Signed reviews
Editorial analysis
A structured set of objections, weighed in public.
Referee Report
Summary. The paper presents ALMA Band 6 observations of the giant molecular cloud M33GMC 37 in M33. The authors resolve two molecular clouds with a velocity separation of roughly 6 km/s, complementary spatial distributions with a displacement of about 6.2 pc, a V-shaped structure in the position–velocity diagram, and three 1.3 mm continuum sources associated with up to about ten high-mass stars (B0V–O7.5V) identified in HST images. They argue that these features represent the four diagnostic signatures of cloud-cloud collisions and conclude that the high-mass stars were formed by a collision that took place roughly 1 Myr ago.
Significance. If the central claim holds, this is the first direct evidence for cloud-cloud collision–triggered high-mass star formation in an external spiral galaxy beyond the Magellanic Clouds, extending the CCC scenario into the Local Group with pc-scale ALMA resolution. The paper has clear strengths: the data reduction is carefully described, the missing-flux check against IRAM data is reassuring, the continuum sources are detected at 5-sigma or higher, and the complementarity between the two clouds is quantified with a correlation-coefficient map. These are useful new observational products. However, the uniqueness of the four diagnostic signatures is not established, and the application of the criteria is internally inconsistent for the bridging feature. The causal conclusion therefore currently overreaches the evidence presented.
major comments (3)
- [Section 4.3 (second paragraph and summary list)] The text states that the VLSR ~ -135 km/s feature in 13CO at position A is "possibly a bridging feature ... but is not significantly detected because of the small velocity separation," yet the final checklist in the same section lists "a presence of a bridging feature connecting the two clouds in velocity space" among the four fulfilled requirements. This is an internal contradiction. The authors must either revise the checklist to indicate that the bridging feature is tentative, or provide a detection at a defined significance level; as written, the checklist overstates the evidence.
- [Sections 4.2 and 4.3 (uniqueness of the four criteria)] The central inference that the four observed features uniquely identify a cloud-cloud collision is not quantified. The rejection of stellar feedback in Section 4.2 assumes a complete spherical shell centered on the exciting star, requiring a full ring in the moment-0 map, a full ellipse in the PV diagram, and monotonic spatial shifts in channel maps. A fragmented or inclined expanding shell, or an unrelated pair of clouds along the line of sight, can produce two velocity components, a complementary-looking morphology, and a V-shaped PV feature without any collision. The paper does not compare the observed moment maps, channel maps, or PV structure with such alternative models. Without these tests, the conclusion that the stars "were formed by cloud-cloud collisions" is a hypothesis rather than an inference, and the language in the abstract and Section 5 should be softened accordingly.
- [Section 4.3 and Figure 8 (correlation-coefficient significance)] The complementarity analysis yields a local minimum correlation coefficient of -0.44 at a specific displacement and reports a 0.5% significance level, but the statistical test is not described in enough detail to assess its validity. Adjacent spatial pixels in the CO maps are strongly autocorrelated, so the effective number of independent samples is far smaller than the number of pixels; the masked polygons used for the calculation were also chosen after visual inspection of the same images, so the displacement that minimizes the coefficient may be an overfit. A null distribution from Monte Carlo permutations of the cloud masks, or an a priori choice of the mask before computing the correlation map, would make the complementarity claim quantitative and robust.
minor comments (7)
- [Figure 2 caption] The caption says "toward M33GMC 35 for each line emission," but the paper is about M33GMC 37; this should be corrected.
- [Figure 8b caption and Section 4.3] The text uses "Right Accession" where "Right Ascension" is meant, and contains the typo "calicuate" for "calculate."
- [Section 4.3, paragraph on velocity separation] The sentence "the observed velocity separation of red and blue clouds is ~6 km/s (see CO spectra in Figure 2b)" cites Figure 2b, which is a moment-1 map; the CO spectra are shown in Figure 3. This cross-reference should be corrected.
- [Section 4.1] The text contains the typo "T o summaries" and also renders the reference as "V erley et al. (2007)" with a space; these formatting issues should be cleaned up.
- [Section 3 and Figure 5 caption] The right ascension values appear as "01h33m35.s243" and "01h33m35.s341"; the decimal point should follow the seconds value, e.g., 01h33m35.243s, to avoid ambiguity.
- [Section 4.3, paragraph on the V-shaped structure] The sentence "we can clearly see the V-shaped structure connecting the red and blue clouds as the intermediate velocity component that is called the bridging feature" conflates the V-shaped structure with the bridging feature, despite the earlier statement that the bridging feature is not significantly detected; this wording should be revised to distinguish the two.
- [Section 4.3, paragraph on collision geometry] The phrase "the angle of two colliding clouds theta is generally not 0 degrees or 90 degrees relative to the line-of-sight" is ambiguous; theta is presumably the angle between the collision axis and the line of sight, and this should be stated explicitly.
Circularity Check
The causal claim rests on a self-referential four-signature checklist, and the complementary-distribution evidence is obtained by fitting a displacement after assuming the collision geometry.
-
fitted input called prediction
[Section 4.3, Figure 8 (correlation-coefficient analysis)]
"By changing values of spatial displacement for one of the colliding clouds, we can obtain a map of correlation coefficient between the two clouds as a function of displacement. The best-fit value of the displacement for each coordinate can be derived as the point of the local minimum. ... Since the cloud-collision in M33GMC 37 is likely the head-on collision, the correlation coefficients were calculated toward inner parts of the blue cloud."
The abstract's 'complementary spatial distribution with a spatial displacement of ~6.2 pc' and the summary's fulfilled requirement (2) are outputs of a fit that minimizes the correlation coefficient over the same two maps; the displacement is not an independent observable. The mask is further restricted to 'inner parts of the blue cloud' because a head-on collision is already assumed, so the measurement region is conditioned on the conclusion. Thus the complementarity criterion passes only after fitting and selecting the data in a way that presupposes the collision scenario.
-
self citation load bearing
[Section 4.3, V-shaped/bridging feature discussion and summary checklist]
"if we make a position–velocity diagram that includes the collision region, we can find not only the bridging feature but also the V-shaped structure in the position–velocity diagram (e.g., Fukui et al. 2018a, 2018c, 2018d; Hayashi et al. 2018; Torii et al. 2018a, 2018b; Fujita et al. 2019b). ... To summarize, the red and blue clouds in M33GMC 37 fulfill four requirements of high-mass star formation triggered by cloud-cloud collisions ... We therefore suggest that the high-mass stars corresponding to ten B0V–O7.5V types in M33GMC 37 were formed by cloud-cloud collisions."
The four-requirement checklist is imported from prior papers dominated by the same authors, and the paper offers no independent discriminative test showing that V-shaped PV morphology, a bridging feature, and complementary morphology are unique to collisions. Treating the checklist as sufficient makes the causal conclusion rest on a self-citation chain, especially since Section 4.2 rejects only stellar feedback and not other configurations (e.g., line-of-sight superposition or an inclined/fragmented shell). The diagnostic power of the signatures is therefore inherited rather than independently established in this work.
full rationale
The raw ALMA observations are new and independent: the two velocity components, the 1.3 mm continuum sources, and the embedded B0V–O7.5V stars are genuinely measured and not derived from the collision conclusion. The circularity enters at the interpretive step. First, the 'complementary spatial distribution' is quantified by fitting a displacement that minimizes the correlation coefficient between the two cloud maps, and the calculation region is restricted to the inner blue cloud because a head-on collision was already assumed; the fitted displacement is then cited as a fulfilled collision requirement. Second, the four diagnostic signatures (supersonic separation, complementarity, bridging feature, V-shaped PV structure) are treated as sufficient to identify a collision, but their discriminative validity is justified by a chain of same-group papers rather than by an independent test against non-collision alternatives. The paper itself even concedes that the bridging feature is 'possibly a bridging feature ... but is not significantly detected because of the small velocity separation,' yet the summary lists it as fulfilled, which weakens the checklist further. Because the central claim still has substantial independent observational content, the paper is not self-deriving; the circularity is partial and concentrated in the interpretive framework, giving a score of 4.
Assumptions & free parameters
free parameters (2)
- Spatial displacement between red and blue clouds =
6.2 pc (15 pixels east, 12 pixels south)
- Collision angle theta =
45 degrees
assumptions (4)
- domain assumption Cloud-cloud collisions produce complementary spatial distributions, V-shaped position-velocity diagrams, and bridging features
- domain assumption The two velocity components at V_LSR near -137 and -132 km/s are two physically distinct molecular clouds, not a single cloud with internal velocity structure
- domain assumption The XCO conversion factor of 4.0e20 cm^-2 (K km/s)^-1 applies to M33GMC 37
- domain assumption The effective Jeans mass in a shock-compressed layer scales with the cube of the effective sound speed
Cite this review
Pith. "Pith review of ALMA CO Observations of a Giant Molecular Cloud in M33: Evidence for High-Mass Star Formation Triggered by Cloud-Cloud Collisions." pith.science (2026). https://pith.science/paper/EOB42P5Q
@misc{pith2026190808404,
  author       = {Pith},
  title        = {Pith review of: ALMA CO Observations of a Giant Molecular Cloud in M33: Evidence for High-Mass Star Formation Triggered by Cloud-Cloud Collisions},
  year         = {2026},
  howpublished = {\url{https://pith.science/paper/EOB42P5Q}},
  note         = {Machine review of arXiv:1908.08404}
}
abstract
We report the first evidence for high-mass star formation triggered by collisions of molecular clouds in M33. Using the Atacama Large Millimeter/submillimeter Array, we spatially resolved filamentary structures of giant molecular cloud 37 in M33 using $^{12}$CO($J$ = 2-1), $^{13}$CO($J$ = 2-1), and C$^{18}$O($J$ = 2-1) line emission at a spatial resolution of $\sim$2 pc. There are two individual molecular clouds with a systematic velocity difference of $\sim$6 km s$^{-1}$. Three continuum sources representing up to $\sim$10 high-mass stars with the spectral types of B0V-O7.5V are embedded within the densest parts of molecular clouds bright in the C$^{18}$O($J$ = 2-1) line emission. The two molecular clouds show a complementary spatial distribution with a spatial displacement of $\sim$6.2 pc, and show a V-shaped structure in the position-velocity diagram. These observational features traced by CO and its isotopes are consistent with those in high-mass star-forming regions created by cloud-cloud collisions in the Galactic and Magellanic Cloud HII regions. Our new finding in M33 indicates that the cloud-cloud collision is a promising process to trigger high-mass star formation in the Local Group.
Figures


Figures from the paper (7 more)


Reference graph
Works this paper leans on
-
[1]
Anathpindika, S. V . 2010, MNRAS, 405, 1431
work page 2010
-
[2]
Cornwell, T. J. 2008, IEEE Journal of Selected T opics in Sign al Processing, 2, 793
work page 2008
- [3]
- [4]
-
[5]
2019, P ASJ, doi:10.1093/pasj/psz119
Enokiya, R., T orii, K., & Fukui, Y . 2019, P ASJ, doi:10.1093/pasj/psz119
-
[6]
Freedman, W . L., Madore, B. F., Gibson, B. K., et al. 2001, ApJ , 553, 47
work page 2001
-
[7]
Fujita, S., Tsutsumi, D., Ohama, A., et al. 2017, arXiv e-pri nts, arXiv:1706.05664
work page Pith review arXiv 2017
-
[8]
2020, P ASJ, doi:10.1093/pasj/psaa005
Fujita, S., Tsutsumi, D., Ohama, A., et al. 2020, P ASJ, doi:10.1093/pasj/psaa005
Show all 37 references
-
[9]
2012, ApJ, 746, 82
Fukui, Y ., Sano, H., Sato, J., et al. 2012, ApJ, 746, 82
2012
-
[10]
2014, ApJ, 780, 36
Fukui, Y ., Ohama, A., Hanaoka, N., et al. 2014, ApJ, 780, 36
2014
-
[11]
2015, ApJL, 807, L4
Fukui, Y ., Harada, R., T okuda, K., et al. 2015, ApJL, 807, L4
2015
-
[12]
2016, ApJ, 820, 26
Fukui, Y ., T orii, K., Ohama, A., et al. 2016, ApJ, 820, 26
2016
-
[13]
2017, P ASJ, 69, L5
Fukui, Y ., Tsuge, K., Sano, H., et al. 2017, P ASJ, 69, L5
2017
-
[14]
2019, ApJ, 886, 14
Fukui, Y ., T okuda, K., Saigo, K., et al. 2019, ApJ, 886, 14
2019
-
[15]
R., Ohama, A., et al
Furukawa, N., Dawson, J. R., Ohama, A., et al. 2009, ApJL, 696, L115 Gaia Collaboration, Brown, A. G. A., Vallenari, A., et al. 2018, A&A, 616, A1
2009
-
[16]
J., et al
Gratier, P ., Braine, J., Rodriguez-Fernandez, N. J., et al. 2010, A&A, 522, A3
2010
-
[17]
J., et al
Gratier, P ., Braine, J., Rodriguez-Fernandez, N. J., et al. 2012, A&A, 542, A108
2012
-
[18]
1992, P ASJ, 44, 203
Habe, A., & Ohta, K. 1992, P ASJ, 44, 203
1992
-
[19]
B., et al
Hasegawa, T., Sato, F., Whiteoak, J. B., et al. 1994, ApJL, 42 9, L77
1994
-
[20]
2018, P ASJ, 70, S48
Hayashi, K., Sano, H., Enokiya, R., et al. 2018, P ASJ, 70, S48
2018
-
[21]
2013, ApJL, 774, L31
Inoue, T., & Fukui, Y . 2013, ApJL, 774, L31
2013
-
[22]
2018, P ASJ, 70, S53
Inoue, T., Hennebelle, P ., Fukui, Y ., et al. 2018, P ASJ, 70, S53
2018
-
[23]
Kruijssen, J. M. D., Schruba, A., Chevance, M., et al. 2019, N ature, 569, 519
2019
-
[24]
2000, ARA&A, 38, 613 Massey , P ., Olsen, K
Kudritzki, R.-P ., & Puls, J. 2000, ARA&A, 38, 613 Massey , P ., Olsen, K. A. G., Hodge, P . W ., et al. 2006, AJ, 131,2478
2000
-
[25]
Martins, F., Schaerer, D., & Hillier, D. J. 2005, A&A, 436, 10 49
2005
-
[26]
D., & Prabhu, T
Mayya, Y . D., & Prabhu, T. P . 1996, AJ, 111, 1252
1996
-
[27]
P ., Waters, B., Schiebel, D., Young, W ., & Golap , K
McMullin, J. P ., Waters, B., Schiebel, D., Young, W ., & Golap , K. 2007, Astronomical Data Analysis Software and Systems XVI, 376, 127
2007
-
[28]
E., Kohno, K., T osaki, T., et al
Miura, R. E., Kohno, K., T osaki, T., et al. 2012, ApJ, 761, 37
2012
-
[29]
2018, P ASJ, 70, S47
Ohama, A., Kohno, M., Fujita, S., et al. 2018, P ASJ, 70, S47
2018
-
[30]
2017, ApJ, 835, 108
Saigo, K., Onishi, T., Nayak, O., et al. 2017, ApJ, 835, 108
2017
-
[31]
2017b, arXiv e-prints, arXiv:1708.08149
Sano, H., T orii, K., Saeki, S., et al. 2017b, arXiv e-prints, arXiv:1708.08149
-
[32]
2018, P ASJ, 70, S43
Sano, H., Enokiya, R., Hayashi, K., et al. 2018, P ASJ, 70, S43
2018
-
[33]
J., Federrath, C., et al
Shima, K., Tasker, E. J., Federrath, C., et al. 2018, P ASJ, 70, S54
2018
-
[34]
2018, P ASJ, 70, S52
Tachihara, K., Gratier, P ., Sano, H., et al. 2018, P ASJ, 70, S52
2018
-
[35]
J., & Habe, A
Takahira, K., Tasker, E. J., & Habe, A. 2014, ApJ, 792, 63 T okuda, K., Onishi, T., Saigo, K., et al. 2018, ApJ, 862, 8 T okuda, K., Fukui, Y ., Harada, R., et al. 2019, ApJ, 886, 15 T orii, K., Enokiya, R., Sano, H., et al. 2011, ApJ, 738, 46 T orii, K., Hasegawa, K., Hattori...
2014
-
[36]
2019, ApJ, 871, 44 Verley , S., Hunt, L
Tsuge, K., Sano, H., Tachihara, K., et al. 2019, ApJ, 871, 44 Verley , S., Hunt, L. K., Corbelli, E., et al. 2007, A&A, 476, 1 161
2019
-
[37]
Zinnecker, H., & Yorke, H. W . 2007, ARA&A, 45, 481
2007
Reviewed August 14, 2026 · model on record in the stance chip above.
Discussion (0). Continue with ORCID to comment.