HyperLISTA-ABT: An Ultra-light Unfolded Network for Accurate Multi-component Differential Tomographic SAR Inversion
Pith reviewed 2026-05-24 06:46 UTC · model grok-4.3
The pith
HyperLISTA-ABT reconstructs accurate 4D differential TomoSAR using an ultra-light unfolded network with analytically determined weights.
A machine-rendered reading of the paper's core claim, the machinery that carries it, and where it could break.
Core claim
HyperLISTA-ABT determines the weights in the unfolded network analytically according to a minimum coherence criterion, resulting in an ultra-light model with only three hyperparameters. It further improves global thresholding by applying an adaptive blockwise thresholding scheme that uses block-coordinate techniques to preserve weak expressions and local features layer by layer. Simulations and real data experiments confirm superior computational efficiency with no significant degradation in performance for multi-component D-TomoSAR inversion.
What carries the argument
Analytical weight determination by minimum coherence criterion inside the HyperLISTA-ABT unfolded network, combined with adaptive blockwise thresholding.
If this is right
- High-quality 4D point clouds can be reconstructed over large areas with affordable computational resources and fast processing.
- The model requires far fewer training samples because it avoids learning millions of free parameters.
- Weak signals and local features are retained better than with conventional global thresholding.
- Memory burden and training time drop sharply relative to earlier deep-learning D-TomoSAR methods.
Where Pith is reading between the lines
- The same analytical-weight trick could reduce parameter counts in other high-dimensional sparse reconstruction tasks.
- Deployment on modest hardware for near-real-time SAR tomography becomes feasible.
- The blockwise idea might combine with other unrolled algorithms to handle even higher-dimensional imaging problems.
Load-bearing premise
The minimum coherence criterion will produce effective weights for the high-dimensional D-TomoSAR case that generalize without requiring data-driven training of millions of parameters.
What would settle it
A direct comparison on real D-TomoSAR data in which a fully trained network with millions of learned parameters shows clearly higher reconstruction accuracy than HyperLISTA-ABT would falsify the no-significant-degradation claim.
Figures




read the original abstract
Deep neural networks based on unrolled iterative algorithms have achieved remarkable success in sparse reconstruction applications, such as synthetic aperture radar (SAR) tomographic inversion (TomoSAR). However, the currently available deep learning-based TomoSAR algorithms are limited to three-dimensional (3D) reconstruction. The extension of deep learning-based algorithms to four-dimensional (4D) imaging, i.e., differential TomoSAR (D-TomoSAR) applications, is impeded mainly due to the high-dimensional weight matrices required by the network designed for D-TomoSAR inversion, which typically contain millions of freely trainable parameters. Learning such huge number of weights requires an enormous number of training samples, resulting in a large memory burden and excessive time consumption. To tackle this issue, we propose an efficient and accurate algorithm called HyperLISTA-ABT. The weights in HyperLISTA-ABT are determined in an analytical way according to a minimum coherence criterion, trimming the model down to an ultra-light one with only three hyperparameters. Additionally, HyperLISTA-ABT improves the global thresholding by utilizing an adaptive blockwise thresholding scheme, which applies block-coordinate techniques and conducts thresholding in local blocks, so that weak expressions and local features can be retained in the shrinkage step layer by layer. Simulations were performed and demonstrated the effectiveness of our approach, showing that HyperLISTA-ABT achieves superior computational efficiency and with no significant performance degradation compared to state-of-the-art methods. Real data experiments showed that a high-quality 4D point cloud could be reconstructed over a large area by the proposed HyperLISTA-ABT with affordable computational resources and in a fast time.
Editorial analysis
A structured set of objections, weighed in public.
Referee Report
Summary. The manuscript proposes HyperLISTA-ABT, an ultra-light unfolded network for four-dimensional differential TomoSAR (D-TomoSAR) inversion. The network weights are set analytically according to a minimum coherence criterion, reducing the model to only three hyperparameters, while an adaptive blockwise thresholding scheme replaces global thresholding to better retain weak scatterers and local features. Simulations and real-data experiments are used to claim that the method achieves superior computational efficiency with no significant performance degradation relative to state-of-the-art methods, thereby enabling high-quality 4D point-cloud reconstruction over large areas with modest resources.
Significance. If the minimum-coherence analytical weights prove effective for the joint spatial-temporal operator in high-dimensional D-TomoSAR, the work would offer a practical route to unfolded networks without the usual data and memory burden of millions of trainable parameters. The explicit use of an analytical rather than learned weight construction is a clear methodological strength that merits credit.
major comments (2)
- [§3] §3 (weight-determination paragraph): the central claim that the minimum-coherence criterion produces effective shrinkage for the 4D joint operator without performance loss rests on an unverified transfer from lower-dimensional LISTA settings; no explicit bound or comparative analysis is supplied showing that the resulting three-hyperparameter operator preserves differential-phase terms comparably to a trained network or classical baselines.
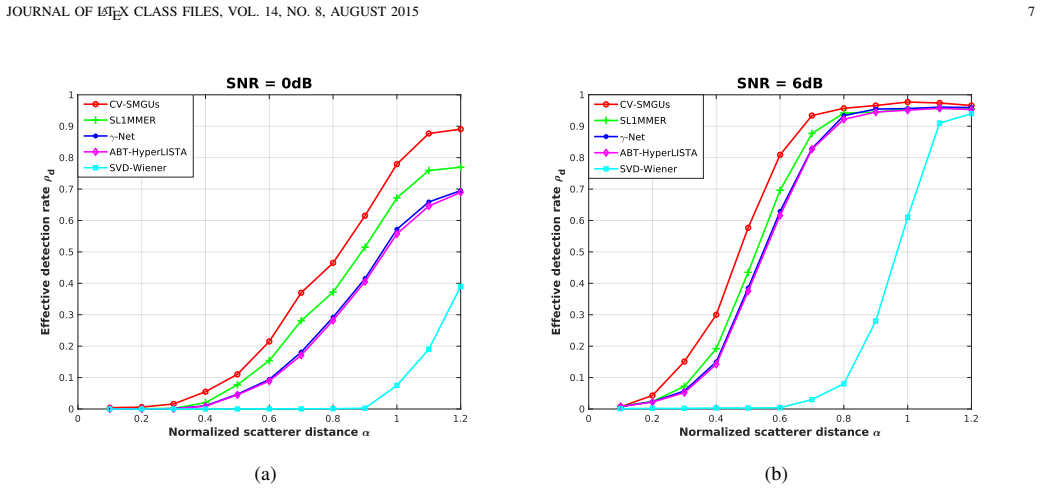
- [§4] §4 (simulation and real-data experiments): the assertion of “no significant performance degradation” is load-bearing for the practical claim, yet the reported results lack quantitative metrics (e.g., RMSE, detection probability for weak scatterers, or statistical tests across realizations) and error bars that would allow verification against the cited SOTA methods.
minor comments (2)
- [Abstract and §3] The three hyperparameters are mentioned repeatedly but never explicitly identified; listing them with their roles would improve clarity.
- [Figures] Figure captions should explicitly label all compared algorithms and indicate whether error bars represent standard deviation or range.
Simulated Author's Rebuttal
We thank the referee for the constructive comments, which help improve the clarity and rigor of our work on HyperLISTA-ABT for 4D D-TomoSAR inversion. We respond to each major comment below.
read point-by-point responses
-
Referee: [§3] §3 (weight-determination paragraph): the central claim that the minimum-coherence criterion produces effective shrinkage for the 4D joint operator without performance loss rests on an unverified transfer from lower-dimensional LISTA settings; no explicit bound or comparative analysis is supplied showing that the resulting three-hyperparameter operator preserves differential-phase terms comparably to a trained network or classical baselines.
Authors: We acknowledge that the manuscript relies on empirical validation rather than a new theoretical bound for the 4D joint operator. The minimum-coherence weights are derived from the same principle as in lower-dimensional LISTA, and simulations in §4 demonstrate comparable phase preservation to baselines. However, to strengthen the claim, we will add a dedicated comparative analysis subsection (including phase-error histograms versus trained networks and classical methods) in the revision. revision: yes
-
Referee: [§4] §4 (simulation and real-data experiments): the assertion of “no significant performance degradation” is load-bearing for the practical claim, yet the reported results lack quantitative metrics (e.g., RMSE, detection probability for weak scatterers, or statistical tests across realizations) and error bars that would allow verification against the cited SOTA methods.
Authors: The referee correctly notes that the current presentation of results would benefit from more quantitative detail. While the simulations compare reconstruction quality visually and via qualitative metrics against SOTA, we agree that RMSE, weak-scatterer detection rates, and error bars over multiple realizations would enable direct verification. We will incorporate these metrics and statistical summaries in the revised §4. revision: yes
Circularity Check
No significant circularity; analytical weight determination is independent of fitted predictions
full rationale
The paper's core innovation is determining the high-dimensional weights analytically via a minimum coherence criterion, reducing the model to three hyperparameters without data-driven fitting of millions of parameters. This is explicitly contrasted with trainable networks in the abstract. No derivation step reduces a claimed prediction or result to its own inputs by construction, no self-citation is load-bearing for the central claim, and no ansatz or uniqueness theorem is smuggled in. Simulations and real-data experiments provide external validation rather than tautological confirmation. The derivation chain remains self-contained against external benchmarks.
Axiom & Free-Parameter Ledger
free parameters (1)
- three hyperparameters
axioms (1)
- domain assumption The minimum coherence criterion yields suitable weights for unfolded networks in the D-TomoSAR regime
Lean theorems connected to this paper
-
IndisputableMonolith/Cost/FunctionalEquation.leanwashburn_uniqueness_aczel unclear?
unclearRelation between the paper passage and the cited Recognition theorem.
weights ... determined in an analytical way according to a minimum coherence criterion, trimming the model down to an ultra-light one with only three hyperparameters
What do these tags mean?
- matches
- The paper's claim is directly supported by a theorem in the formal canon.
- supports
- The theorem supports part of the paper's argument, but the paper may add assumptions or extra steps.
- extends
- The paper goes beyond the formal theorem; the theorem is a base layer rather than the whole result.
- uses
- The paper appears to rely on the theorem as machinery.
- contradicts
- The paper's claim conflicts with a theorem or certificate in the canon.
- unclear
- Pith found a possible connection, but the passage is too broad, indirect, or ambiguous to say the theorem truly supports the claim.
Reference graph
Works this paper leans on
-
[1]
Very high resolution spaceborne SAR tomog- raphy in urban environment,
X. Zhu and R. Bamler, “Very high resolution spaceborne SAR tomog- raphy in urban environment,” IEEE Transactions on Geoscience and Remote Sensing, vol. 48, no. 12, pp. 4296–4308, 2010, 00125
work page 2010
-
[2]
Tomo- graphic imaging and monitoring of buildings with very high resolution SAR data,
D. Reale, G. Fornaro, A. Pauciullo, X. Zhu, and R. Bamler, “Tomo- graphic imaging and monitoring of buildings with very high resolution SAR data,” IEEE Geoscience and Remote Sensing Letters , vol. 8, no. 4, pp. 661–665, 2011
work page 2011
-
[3]
Facade reconstruction using multiview spaceborne tomosar point clouds,
X. X. Zhu and M. Shahzad, “Facade reconstruction using multiview spaceborne tomosar point clouds,” IEEE Transactions on Geoscience and Remote Sensing , vol. 52, no. 6, pp. 3541–3552, 2014. Algorithm 2 Efficient algorithm for analytical weight opti- mization Input: the steering matrix R Init: D = R, G = I, ζ = α = 0.1 for iter= 1, 2, · · · until convergenc...
work page 2014
-
[4]
G. Fornaro, F. Lombardini, A. Pauciullo, D. Reale, and F. Viviani, “Tomographic processing of interferometric SAR data: Developments, applications, and future research perspectives,” IEEE Signal Processing Magazine, vol. 31, no. 4, pp. 41–50, 2014
work page 2014
-
[5]
D. L. Donoho, “Compressed sensing,” IEEE Transactions on Informa- tion Theory, vol. 52, no. 4, pp. 1289–1306, 2006
work page 2006
-
[6]
R. G. Baraniuk, “Compressive sensing,” IEEE Signal Processing Mag- azine, vol. 24, no. 4, pp. 118–121, 2007
work page 2007
-
[7]
Tomographic SAR inversion by l1 -norm regularization—the compressive sensing approach,
X. Zhu and R. Bamler, “Tomographic SAR inversion by l1 -norm regularization—the compressive sensing approach,” IEEE Transactions on Geoscience and Remote Sensing , vol. 48, no. 10, pp. 3839–3846, 2010
work page 2010
-
[8]
Y . Shi, X. X. Zhu, W. Yin, and R. Bamler, “A fast and accurate basis pursuit denoising algorithm with application to super-resolving tomographic SAR,” IEEE Transactions on Geoscience and Remote Sensing, vol. 56, no. 10, pp. 6148–6158, 10 2018
work page 2018
-
[9]
Joint sparsity in SAR tomog- raphy for urban mapping,
X. X. Zhu, N. Ge, and M. Shahzad, “Joint sparsity in SAR tomog- raphy for urban mapping,” IEEE Journal of Selected Topics in Signal Processing, vol. 9, no. 8, pp. 1498–1509, 2015. JOURNAL OF LATEX CLASS FILES, VOL. 14, NO. 8, AUGUST 2015 10 Fig. 7: Color-coded reconstruction results of the test site. (a) Elevation estimates using HyperLISTA-ABT in meters,...
work page 2015
-
[10]
SAR tomography based on deep learning,
A. Budillon, A. C. Johnsy, G. Schirinzi, and S. Vitale, “SAR tomography based on deep learning,” in IGARSS 2019 - 2019 IEEE International Geoscience and Remote Sensing Symposium , 2019, pp. 3625–3628
work page 2019
-
[11]
Deep Unfolding: Model-Based Inspiration of Novel Deep Architectures
J. R. Hershey, J. L. Roux, and F. Weninger, “Deep unfolding: Model-based inspiration of novel deep architectures,” 2014. [Online]. Available: https://arxiv.org/abs/1409.2574
work page internal anchor Pith review Pith/arXiv arXiv 2014
-
[12]
γ-net: Superresolving SAR tomographic inversion via deep learning,
K. Qian, Y . Wang, Y . Shi, and X. X. Zhu, “ γ-net: Superresolving SAR tomographic inversion via deep learning,” IEEE Transactions on Geoscience and Remote Sensing , vol. 60, pp. 1–16, 2022
work page 2022
-
[13]
Basis pursuit denoising via recurrent neural network applied to super-resolving SAR tomography,
K. Qian, Y . Wang, P. Jung, Y . Shi, and X. X. Zhu, “Basis pursuit denoising via recurrent neural network applied to super-resolving SAR tomography,” IEEE Transactions on Geoscience and Remote Sensing , vol. 60, pp. 1–15, 2022
work page 2022
-
[15]
Differential tomography: a new framework for SAR interferometry,
F. Lombardini, “Differential tomography: a new framework for SAR interferometry,”IEEE Transactions on Geoscience and Remote Sensing , vol. 43, no. 1, pp. 37–44, 2005
work page 2005
-
[16]
Let’s do the time warp: Multicomponent nonlinear motion estimation in differential SAR tomography,
X. X. Zhu and R. Bamler, “Let’s do the time warp: Multicomponent nonlinear motion estimation in differential SAR tomography,” IEEE Geoscience and Remote Sensing Letters , vol. 8, no. 4, pp. 735–739, 2011
work page 2011
-
[17]
ALISTA: Analytic weights are as good as learned weights in LISTA,
J. Liu, X. Chen, Z. Wang, and W. Yin, “ALISTA: Analytic weights are as good as learned weights in LISTA,” in International Conference on Learning Representations , 2019. [Online]. Available: https://openreview.net/forum?id=B1lnzn0ctQ
work page 2019
-
[18]
Hyperparameter tuning is all you need for LISTA,
X. Chen, J. Liu, Z. Wang, and W. Yin, “Hyperparameter tuning is all you need for LISTA,” in Advances in Neural Information Processing Systems, 2021
work page 2021
-
[19]
Four-dimensional SAR imaging for height estimation and monitoring of single and double scatterers,
G. Fornaro, D. Reale, and F. Serafino, “Four-dimensional SAR imaging for height estimation and monitoring of single and double scatterers,” IEEE Transactions on Geoscience and Remote Sensing , vol. 47, no. 1, pp. 224–237, 2009
work page 2009
-
[20]
S. S. Chen, D. L. Donoho, and M. A. Saunders, “Atomic decomposition JOURNAL OF LATEX CLASS FILES, VOL. 14, NO. 8, AUGUST 2015 11 Fig. 8: Color-coded elevation estimates of the top and bottom layers of detected double scatterers using HyperLISTA-ABT. (a) Top layer, mostly caused by reflections from the building roof and facade, (b) bottom layer, mostly cau...
work page 2015
-
[21]
Block stochastic gradient iteration for convex and nonconvex optimization,
Y . Xu and W. Yin, “Block stochastic gradient iteration for convex and nonconvex optimization,” SIAM Journal on Optimization, vol. 25, no. 3, pp. 1686–1716, 2015
work page 2015
-
[22]
Coordinate-friendly struc- tures, algorithms and applications,
Z. Peng, T. Wu, Y . Xu, M. Yan, and W. Yin, “Coordinate-friendly struc- tures, algorithms and applications,” Annals of Mathematical Sciences and Applications, vol. 1, no. 1, pp. 57–119, 2016
work page 2016
-
[23]
X. Zhu and R. Bamler, “Super-resolution power and robustness of compressive sensing for spectral estimation with application to space- borne tomographic sar,” IEEE Transactions on Geoscience and Remote Sensing, vol. 50, no. 1, pp. 247–258, 2012
work page 2012
-
[24]
Demonstration of super-resolution for tomographic SAR imaging in urban environment,
X. X. Zhu and R. Bamler, “Demonstration of super-resolution for tomographic SAR imaging in urban environment,” IEEE Transactions on Geoscience and Remote Sensing, vol. 50, no. 8, pp. 3150–3157, 2012. Kun Qian received double B.Sc. degree in Re- mote Sensing and Information Engineering from Wuhan University, Wuhan, China and Aerospace En- gineering and Geo...
work page 2012
-
[25]
He is a Member of the IEEE. JOURNAL OF LATEX CLASS FILES, VOL. 14, NO. 8, AUGUST 2015 12 (a) (b) Fig. 10: Demonstration of the large test area. (a) Optical image from Google Earth, (b) SAR mean intensity map in dB. The red box in (b) indicates the area undergoing subsidence. Fig. 11: Demonstration of color-coded elevation estimates and estimated amplitude...
work page 2015
discussion (0)
Sign in with ORCID, Apple, or X to comment. Anyone can read and Pith papers without signing in.