REVIEW 4 major objections 5 minor 66 references
Analyzing Spatio-Temporal Dynamics of Dissolved Oxygen for the River Thames using Superstatistical Methods and Machine Learning
T0 review · 4 major / 5 minor · reviewed 2026-08-10 · deepseek-v4-flash
Pith's one-line read After detrending, dissolved-oxygen fluctuations in the tidal Thames are heavy-tailed q-Gaussians whose fitted width decreases with distance to the sea.
desk verdict Useful empirical extension to a big tidal river, but the headline comparisons rest on incomparable log-likelihoods and the beta-distance trend lacks uncertainty quantification. read the letter →
The pith
A machine-rendered reading of the paper's core claim, the machinery that carries it, and where it could break.
The reading
What carries the argument
The load-bearing object is the q-Gaussian distribution, a two-parameter density with shape index $q$ and scale parameter $\beta$ that generalizes the Gaussian and reduces to it at $q=1$; it is the exact marginal distribution obtained when a Gaussian with fluctuating inverse variance is integrated over a $\chi^2$ distribution. The paper's other central mechanism is the detrending split: seasonal decomposition with a six-hour filter or empirical mode decomposition with three dropped modes, applied additively or multiplicatively via a log transform, decides what counts as fluctuation and therefore shapes every fitted $q$ and $\beta$. For forecasting, the Informer's ProbSparse self-attention, which selects the most active queries before computing attention, is the mechanism credited with capturing the half-day periodicity of DO and producing the lowest long-horizon errors.
What would settle it
Re-run the detrending and q-Gaussian fitting with $f=3$ hours or $f=12$ hours, or with $m=2$ or $m=4$ dropped modes; if the fitted $\beta$ no longer shows a monotone decrease with distance to the sea, or if another heavy-tailed family fits the same fluctuations as well, the paper's central claims would be refuted.
Extended reading notes
Core claim
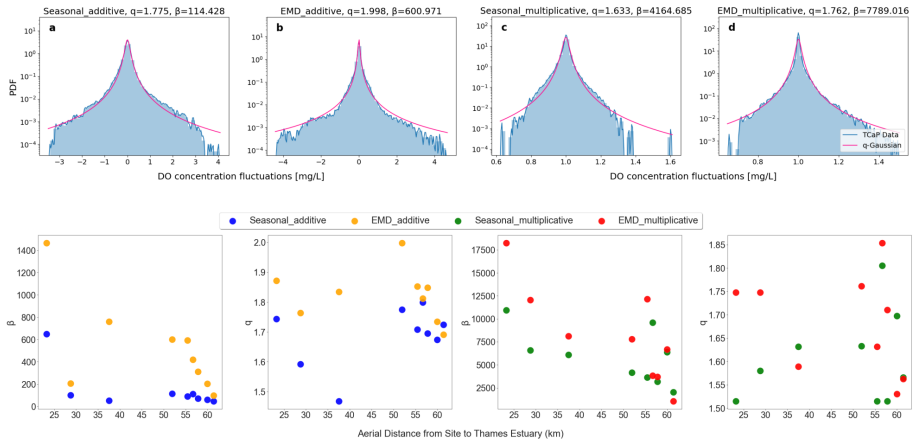
The central discovery is that, once the seasonal and tidal trend is removed, dissolved-oxygen fluctuations at all nine Thames sites are well approximated by q-Gaussian densities with $q>1$, i.e. power-law tails that make extreme deviations more probable than a Gaussian would allow. The paper identifies multiplicative empirical mode decomposition as the detrending method that yields the best q-Gaussian fits, and reports a systematic spatial pattern: the scale parameter $\beta$ decreases roughly linearly with distance to the sea, so sites farther inland show wider DO fluctuations. In addition, the paper presents LightGBM as the best same-time regressor for DO and the Informer model as the best multi-hour forecaster, with attention weights that concentrate on the morning-to-early-afternoon and late-evening-to-early-morning windows of the most recent half-day.
Load-bearing premise
The analysis assumes that a six-hour seasonal filter and three dropped EMD modes correctly separate 'trend' from 'fluctuation'; the paper itself calls this choice somewhat arbitrary, and every fitted q-Gaussian parameter and the beta-distance trend would change if that split were made differently.
Editorial extensions
If this is right
- If the q-Gaussian description is right, the probability of extreme low-oxygen events is higher than a Gaussian model would predict, and the second moment may not exist at sites with $q>5/3$.
- If the $\beta$-versus-distance trend is real, inland sites are where DO variability is largest, so those are the sites where monitoring and intervention would matter most.
- The Informer's attention pattern implies that forecasts can be interpreted: the model relies on morning and late-evening windows and on the 16th to 26th quarter-hour of the previous half-day, which could be used to schedule oxygen injection or treatment releases.
- If LightGBM with SHAP is used in practice, temperature and pH sensors should be prioritized, since they dominate same-time DO prediction across sites.
Reading between the lines
- Because the reported $q$ values often exceed $5/3$, the fitted model has infinite variance at those sites; a practical consequence not spelled out in the paper is that confidence intervals and risk metrics based on the sample standard deviation will systematically understate the chance of extreme DO drops.
- The same multiplicative-EMD plus q-Gaussian pipeline could be tested on other observables, such as electrical conductivity, on the same Thames data; a negative result there would show how far the superstatistical pattern extends beyond DO.
- A direct test of the sea-distance mechanism would use the same analysis on a river without tidal seawater influence, or on the non-tidal Thames upstream, to check whether the $\beta$ gradient is driven by seawater mixing rather than by distance alone.
- A natural follow-up would be to train the Informer on all nine sites and compare attention patterns across sites, testing whether the half-day windows are generic rather than specific to the one site used for the forecasting evaluation.
Editorial analysis
A structured set of objections, weighed in public.
Referee Report
Summary. The paper analyzes five years of 15-minute water-quality data from nine monitoring sites along the tidal River Thames. It detrends dissolved oxygen (DO) time series with seasonal decomposition and empirical mode decomposition, in both additive and multiplicative forms; fits q-Gaussian distributions to the resulting fluctuations; and reports the fitted shape parameter q and scale parameter beta against distance to the sea. It then trains a LightGBM model for same-time DO prediction with SHAP feature attributions, and compares seven forecasting models, including Informer, for multi-hour DO forecasts. The central claims are that DO fluctuations are q-Gaussian with power-law tails, that multiplicative EMD is the most effective detrending method, that beta decreases linearly with distance to the sea, and that LightGBM and Informer are the best-performing machine-learning models for regression and forecasting, respectively.
Significance. If substantiated, the q-Gaussian characterization of DO fluctuations and the beta-distance relation would extend superstatistical water-quality analysis from a small river (the River Chess) to a large tidal estuary, and the forecasting comparison would be practically useful for environmental monitoring. The paper has genuine strengths: it uses real multi-site data over five years, describes a clear data-cleaning protocol, provides a public code repository, and fits the proposed distributions by maximum likelihood. However, the load-bearing statistical issues below—arbitrary detrending choices without sensitivity analysis, an invalid likelihood comparison, and unsupported spatial and forecasting generalizations—currently prevent full confidence in the headline claims.
major comments (4)
- [Detrending (Eqs. 4-5), Superstatistical analysis (Fig. 3)] The detrending parameters f = 6 hours and m = 3 modes are explicitly described as 'somewhat arbitrary and has to be made by the user' in the Detrending section. All subsequent q-Gaussian fits, the beta-distance trend, and even the downstream forecast-feature analysis depend on this split between trend and fluctuations, but the paper provides no sensitivity analysis or uncertainty quantification. A robustness check over a plausible range of f and m values, or a principled data-driven criterion for choosing them, is needed to establish that the reported q, beta, and the beta-distance relation are not artifacts of the chosen detrending parameters.
- [Detrending (Eqs. 1, 2, 6), Fig. 2] The claim that multiplicative EMD is 'the most effective detrending method' is based on comparing q-Gaussian log-likelihoods across methods. For additive decompositions (Eq. 1), the fluctuation F_t is in original DO units; for multiplicative decompositions (Eq. 2), the fit is performed on log F_t after applying Eq. (6). These log-likelihoods are not comparable without a Jacobian correction: the implied density for the original-scale fluctuation is f_F(F) = f_log(log F)/F, so the likelihood on the original scale differs by the site- and method-dependent term -sum(log F_t). Because DO values are O(10) mg/L, this term is large and varies across sites, so the ranking in Fig. 2 could change. The authors should redo the comparison on a common scale or explicitly report likelihoods under a consistent transformation.
- [Superstatistical analysis, Fig. 3 (bottom)] The paper claims a linear decreasing trend in the fitted width parameter beta versus distance to the sea, but this is based on nine sites with no error bars, correlation coefficient, confidence intervals, or significance test. With such a small sample, the apparent trend could be dominated by one or two sites. Please provide regression statistics (e.g., R^2, slope uncertainty, p-value) and ideally bootstrap or permutation-based confidence intervals, and also report how the trend depends on the detrending choices discussed above.
- [Time series forecasting, Table 2] The paper concludes that 'Informer consistently delivers superior performance' for long-term DO forecasting, but the forecasting experiments are reported for only one site (TBGP). The regression experiments use all nine sites, so the forecasting conclusion is not supported at the same breadth. Either additional sites should be included in the forecasting comparison, or the conclusion should be explicitly restricted to the TBGP site. As reported, Table 2 also gives only five-iteration averages without standard deviations, making it difficult to judge whether the differences between Informer and Repeat or LSTM are statistically meaningful.
minor comments (5)
- [Detrending] There is a typo in the prose: 'fluctutions' should be 'fluctuations'. In addition, the site label is inconsistent between 'TCaP' and 'TCap', and 'TChp' in Table 1 appears as 'TChP' elsewhere.
- [References] Reference [22], attributed to a superstatistical wind-statistics application, cites 'Highlights from this issue' in Emergency Medicine Journal; this appears to be a citation error and should be corrected.
- [Data processing] Data-processing items 4 and 6 both describe the removal of the August 2022 oxygen-injection period; these could be consolidated to avoid redundancy.
- [Detrending methods] The Methods section says the number of dropped EMD modes is 'varied based on each site's trajectories, as illustrated in the code,' but the per-site m values are not reported in the manuscript; please state them in the text or a table so the analysis is reproducible without inspecting the code.
- [Time series forecasting] The forecast-error metrics in Table 2 are averaged over five iterations, but no standard deviations or confidence intervals are reported; adding these would help assess whether the reported improvements are robust.
Circularity Check
No significant circularity: the q-Gaussian fits, detrending comparison, beta–distance correlation, and ML forecasts are empirical analyses of independent Thames data; prior self-citations are motivational, not load-bearing.
full rationale
The paper's derivation chain is not circular. The q-Gaussian model is motivated by same-group prior work on the River Chess (refs 29–30) and by the superstatistical literature, but the Thames data are new, and the q and beta parameters are estimated by maximum likelihood from those data; the claim that fluctuations follow q-Gaussians is a fitted description, not a quantity defined in terms of the conclusion. The detrending-method comparison is an internal model selection based on log-likelihood, and the chosen f=6h and m=3 thresholds are explicitly user-defined; this affects robustness but does not make the subsequent fits equivalent to the inputs. The beta-versus-distance trend is a post hoc correlation of fitted parameters with an independent geographic variable, not a prediction validated on the same fit. The LGBM regression and Informer forecasting are evaluated on chronological holdout test sets against baseline models, so the reported SMAPE/MAE comparisons are external to training. The notable caveats—cross-method log-likelihood comparability after log-transformation and the arbitrariness of detrending parameters—are technical correctness or sensitivity issues, not cases where an equation reduces to its own input. Hence score 0.
Assumptions & free parameters
free parameters (4)
- q (entropic index) per site =
between 5/3 and 2 (Fig. 3)
- beta (scale parameter) per site =
not tabulated; plotted against distance to sea
- Detrending filter frequency f =
6 hours
- Number of dropped EMD modes m =
3, with site-specific variation
assumptions (4)
- domain assumption DO fluctuations arise as a superposition of Gaussian processes with slowly varying inverse variance following a chi-square distribution.
- domain assumption The time series can be decomposed into separable trend, fluctuation, and remainder components, additively or multiplicatively, with all multiplicative parts positive.
- ad hoc to paper The chosen detrending parameters f = 6 hours and m = 3 modes define the true trend and preserve the meaningful fluctuations.
- domain assumption Temporal train/test splits imply that future data come from the same distribution as past data.
Cite this review
Pith. "Pith review of Analyzing Spatio-Temporal Dynamics of Dissolved Oxygen for the River Thames using Superstatistical Methods and Machine Learning." pith.science (2026). https://pith.science/paper/2YLH4M5E
@misc{pith2026250107599,
  author       = {Pith},
  title        = {Pith review of: Analyzing Spatio-Temporal Dynamics of Dissolved Oxygen for the River Thames using Superstatistical Methods and Machine Learning},
  year         = {2026},
  howpublished = {\url{https://pith.science/paper/2YLH4M5E}},
  note         = {Machine review of arXiv:2501.07599}
}
abstract
By employing superstatistical methods and machine learning, we analyze time series data of water quality indicators for the River Thames, with a specific focus on the dynamics of dissolved oxygen. After detrending, the probability density functions of dissolved oxygen fluctuations exhibit heavy tails that are effectively modeled using $q$-Gaussian distributions. Our findings indicate that the multiplicative Empirical Mode Decomposition method stands out as the most effective detrending technique, yielding the highest log-likelihood in nearly all fittings. We also observe that the optimally fitted width parameter of the $q$-Gaussian shows a negative correlation with the distance to the sea, highlighting the influence of geographical factors on water quality dynamics. In the context of same-time prediction of dissolved oxygen, regression analysis incorporating various water quality indicators and temporal features identify the Light Gradient Boosting Machine as the best model. SHapley Additive exPlanations reveal that temperature, pH, and time of year play crucial roles in the predictions. Furthermore, we use the Transformer to forecast dissolved oxygen concentrations. For long-term forecasting, the Informer model consistently delivers superior performance, achieving the lowest MAE and SMAPE with the 192 historical time steps that we used. This performance is attributed to the Informer's ProbSparse self-attention mechanism, which allows it to capture long-range dependencies in time-series data more effectively than other machine learning models. It effectively recognizes the half-life cycle of dissolved oxygen, with particular attention to key intervals. Our findings provide valuable insights for policymakers involved in ecological health assessments, aiding in accurate predictions of river water quality and the maintenance of healthy aquatic ecosystems.
Figures


Figures from the paper (5 more)



Reference graph
Works this paper leans on
-
[1]
McCormick, H., Cox, T., Pecorelli, J. & Debney, A. The state of the thames 2021: Environmental trends of the tidal thames (2021)
work page 2021
-
[2]
Statistics of three-dimensional lagrangian turbulence
Beck, C. Statistics of three-dimensional lagrangian turbulence. Physical Review Letters 98, 064502 (2007)
work page 2007
-
[3]
Beck, C., Cohen, E. G. D. & Swinney, H. L. From time series to superstatistics. Phys. Rev. E 72, 056133 (2005). URL https://link.aps.org/doi/10.1103/PhysRevE.72.056133
-
[4]
Beck, C. & Cohen, E. Superstatistics. Physica A: Statistical Mechanics and its Applications 322, 267–275 (2003). URL https://www.sciencedirect.com/science/article/pii/S0378437103000 190
work page 2003
-
[5]
Beck, C. Superstatistics in high-energy physics: application to cosmic ray energy spectra and e+ e-annihilation. The European Physical Journal A 40, 267 (2009)
work page 2009
-
[6]
Sevilla, F. J., Arzola, A. V. & Cital, E. P. Stationary superstatistics distributions of trapped run- and-tumble particles. Physical Review E 99 (2019). URL https://www.scopus.com/inward/reco rd.uri?eid=2-s2.0-85061244491&doi=10.1103%2fPhysRevE.99.012145&partnerID=40&md5=a b12ff85a1b7f937ce5583bd82902f52. 20
work page 2019
-
[7]
Ayala, A., Hern´ andez-Ortiz, S., Hern´ andez, L., Knapp-P´ erez, V. & Zamora, R. Fluctuating tem- perature and baryon chemical potential in heavy-ion collisions and the position of the critical end point in the effective qcd phase diagram. Physical Review D 101 (2020). URL https: //www.scopus.com/inward/record.uri?eid=2-s2.0-85084537884&doi=10.1103%2fPhy...
work page 2020
-
[8]
Cheraghalizadeh, J., Seifi, M., Ebadi, Z., Mohammadzadeh, H. & Najafi, M. Superstatistical two- temperature ising model. Physical Review E 103 (2021). URL https://www.scopus.com/inward/ record.uri?eid=2-s2.0-85102925395&doi=10.1103%2fPhysRevE.103.032104&partnerID=40& md5=70f36509adae22cbb805749fbac2729c
work page 2021
Show all 66 references
-
[9]
Yalcin, G. C. & Beck, C. Generalized statistical mechanics of cosmic rays: Application to positron- electron spectral indices. Scientific Reports 8 (2018). URL https://www.scopus.com/inward/re cord.uri?eid=2-s2.0-85041282876&doi=10.1038%2fs41598-018-20036-6&partnerID=40&md5= 2...
2018
-
[10]
& Beck, C
Smolla, M., Sch¨ afer, B., Lesch, H. & Beck, C. Universal properties of primary and secondary cosmic ray energy spectra. New Journal of Physics 22, 093002 (2020). URL https://dx.doi.org/10.10 88/1367-2630/abaa03
2020
-
[11]
Kappa distributions: Theory and applications in plasmas (Elsevier, 2017)
Livadiotis, G. Kappa distributions: Theory and applications in plasmas (Elsevier, 2017)
2017
-
[12]
Davis, S. et al. Single-particle velocity distributions of collisionless, steady-state plasmas must follow superstatistics. Physical Review E 100 (2019). URL https://www.scopus.com/inward/record.u ri?eid=2-s2.0-85072119582&doi=10.1103%2fPhysRevE.100.023205&partnerID=40&md5=50a...
2019
-
[13]
& Willitsch, S
Rouse, I. & Willitsch, S. Superstatistical energy distributions of an ion in an ultracold buffer gas. Phys. Rev. Lett. 118, 143401 (2017). URL https://link.aps.org/doi/10.1103/PhysRevLett.1 18.143401
2017 doi
-
[14]
V., Seno, F., Metzler, R
Chechkin, A. V., Seno, F., Metzler, R. & Sokolov, I. M. Brownian yet non-gaussian diffusion: From superstatistics to subordination of diffusing diffusivities. Phys. Rev. X 7, 021002 (2017). URL https://link.aps.org/doi/10.1103/PhysRevX.7.021002
2017 doi
-
[15]
& Beck, C
Itto, Y. & Beck, C. Superstatistical modelling of protein diffusion dynamics in bacteria. Journal of the Royal Society Interface 18 (2021). URL https://www.scopus.com/inward/record.uri?eid =2-s2.0-85102331224&doi=10.1098%2frsif.2020.0927&partnerID=40&md5=5253497da8c4ffb 25592c...
2021
-
[16]
& Timme, M
Sch¨ afer, B., Beck, C., Aihara, K., Witthaut, D. & Timme, M. Non-gaussian power grid frequency fluctuations characterized by l´ evy-stable laws and superstatistics.Nature Energy 3, 119–126 (2018)
2018
-
[17]
& Smolyanov, O
Bogachev, V. & Smolyanov, O. Introduction to the theory of topological vector spaces. Springer Monographs in Mathematics 1 – 100 (2017). URL https://www.scopus.com/inward/record.uri ?eid=2-s2.0-85020414563&doi=10.1007%2f978-3-319-57117-1_1&partnerID=40&md5=6ed9ab 90b3ebf18f247...
2017
-
[18]
& Katz, Y
Gidea, M. & Katz, Y. Topological data analysis of financial time series: Landscapes of crashes. Physica A: Statistical Mechanics and its Applications 491, 820–834 (2018). URL https://www.sc iencedirect.com/science/article/pii/S0378437117309202
2018
-
[19]
& Kadoya, T
Uchiyama, Y. & Kadoya, T. Superstatistics with cut-off tails for financial time series. Physica A: Statistical Mechanics and its Applications 526, 120930 (2019). URL https://www.sciencedirec t.com/science/article/pii/S0378437119305345. 21
2019
-
[20]
& Beck, C
Briggs, K. & Beck, C. Modelling train delays with q-exponential functions. Physica A: Statistical Mechanics and its Applications 378, 498–504 (2007). URL https://www.sciencedirect.com/sc ience/article/pii/S0378437106013227
2007
-
[21]
Mitsokapas, E., Sch¨ afer, B., Harris, R. J. & Beck, C. Statistical characterization of airplane delays. Scientific Reports 11, 7855 (2021)
2021
-
[22]
Weber, E. J. Highlights from this issue. Emergency Medicine Journal 36, 1 (2019). URL https: //www.scopus.com/inward/record.uri?eid=2-s2.0-85059878468&doi=10.1136%2femermed-2 018-208324&partnerID=40&md5=b9fa02bf967d36548437590ab4302b1c
2019
-
[23]
& Beck, C
Williams, G., Sch¨ afer, B. & Beck, C. Superstatistical approach to air pollution statistics. Physical Review Research 2 (2020). URL https://www.scopus.com/inward/record.uri?eid=2-s2.0-850 90293965&doi=10.1103%2fPhysRevResearch.2.013019&partnerID=40&md5=232925cecda24a3d0 d067b...
2020
-
[24]
& Beck, C
He, H., Sch¨ afer, B. & Beck, C. Spatial heterogeneity of air pollution statistics in europe. Scientific Reports 12, 12215 (2022)
2022
-
[25]
& Avanzi, F
De Michele, C. & Avanzi, F. Superstatistical distribution of daily precipitation extremes: a worldwide assessment. sci. rep. 8 (1), 1–11 (2018)
2018
-
[26]
& Wirth, A
Flora, S., Ursella, L. & Wirth, A. Superstatistical analysis of sea surface currents in the gulf of trieste, measured by high-frequency radar, and its relation to wind regimes using the maximum- entropy principle. Nonlinear Processes in Geophysics 30, 515–525 (2023). URL https...
2023
-
[27]
Sardeli, E. et al. Complexity of recent earthquake swarms in greece in terms of non-extensive statistical physics. Entropy 25, 667 (2023). URL http://dx.doi.org/10.3390/e25040667
2023 doi
-
[28]
Agarap, A. F. Deep learning using rectified linear units (relu). arXiv preprint arXiv:1803.08375 (2018)
2018 arXiv
-
[29]
M., Rhys, H
Sch¨ afer, B., Heppell, C. M., Rhys, H. & Beck, C. Fluctuations of water quality time series in rivers follow superstatistics. iScience 24, 102881 (2021). URL https://www.sciencedirect.com/scie nce/article/pii/S258900422100849X
2021
-
[30]
Sch¨ afer, B. et al. Machine learning approach towards explaining water quality dynamics in an urbanised river. Scientific Reports 12, 12346 (2022)
2022
-
[31]
& Gemici, B
Citakoglu, H., Ozeren, Y. & Gemici, B. T. Prediction machine learning methods for dissolved oxygen value of the sakarya basin in turkey. In Chenchouni, H.et al. (eds.) Recent Research on Hydrogeology, Geoecology and Atmospheric Sciences, 95–98 (Springer Nature Switzerland, Cham, 2023)
2023
-
[32]
& Shah, I
Mohamed, I. & Shah, I. Suspended sediment concentration modeling using conventional and machine learning approaches in the thames river, london ontario. Journal of Water Management Modeling (2018)
2018
-
[33]
Asadollah, S. B. H. S., Sharafati, A., Motta, D. & Yaseen, Z. M. River water quality index prediction and uncertainty analysis: A comparative study of machine learning models. Journal of Environmen- tal Chemical Engineering 9, 104599 (2021). URL https://www.sciencedirect.com/s...
2021
-
[34]
Zhi, W. et al. From hydrometeorology to river water quality: Can a deep learning model predict dissolved oxygen at the continental scale? Environmental Science & Technology 55, 2357–2368 (2021). URL https://doi.org/10.1021/acs.est.0c06783. PMID: 33533608, https://doi.org/ 10.1...
2021 doi
-
[35]
& Garc ´ ıa, ´A
Castrillo, M. & Garc ´ ıa, ´A. L. Estimation of high frequency nutrient concentrations from water quality surrogates using machine learning methods. Water research 172, 115490 (2020)
2020
-
[36]
&´Alvaro L´ opez Garc ´ ıa
S´ ainz-Pardo D ´ ıaz, J., Castrillo, M. &´Alvaro L´ opez Garc ´ ıa. Deep learning based soft-sensor for continuous chlorophyll estimation on decentralized data. Water Research 246, 120726 (2023). URL https://www.sciencedirect.com/science/article/pii/S0043135423011661
2023
-
[37]
J., Dominato, K
Maguire, T. J., Dominato, K. R., Weidman, R. P. & Mundle, S. O. C. Ultraviolet-visual spec- troscopy estimation of nitrate concentrations in surface waters via machine learning. Limnology and Oceanography: Methods 20, 26–33 (2022). URL https://aslopubs.onlinelibrary.wiley.com/...
2022 doi
-
[38]
& Hinkelmann, R
Zounemat-Kermani, M., Mahdavi-Meymand, A. & Hinkelmann, R. A comprehensive survey on conventional and modern neural networks: application to river flow forecasting. Earth Science Informatics 14, 893–911 (2021)
2021
-
[39]
Vaswani, A. et al. Attention is all you need. Advances in neural information processing systems 30 (2017)
2017
-
[40]
Nair, J. P. & Vijaya, M. Temporal fusion transformer: A deep learning approach for modeling and forecasting river water quality index. International Journal of Intelligent Systems and Applications in Engineering 11, 277–293 (2023)
2023
-
[41]
Superstatistics in hydrodynamic turbulence
Beck, C. Superstatistics in hydrodynamic turbulence. Physica D: Nonlinear Phenomena 193, 195– 207 (2004)
2004
-
[42]
Water quality monitoring systems & services
Meteor Communications. Water quality monitoring systems & services. https://meteorcommunic ations.co.uk/water-quality-monitoring/. Accessed: [2022]
2022
-
[43]
Folium: Python data, leaflet.js maps
Contributors, F. Folium: Python data, leaflet.js maps. https://github.com/python-visualiza tion/folium
-
[44]
Openstreetmap
Contributors, O. Openstreetmap. https://www.openstreetmap.org (2023)
2023
-
[45]
Possible generalization of boltzmann-gibbs statistics
Tsallis, C. Possible generalization of boltzmann-gibbs statistics. Journal of Statistical Physics 52, 479–487 (1988)
1988
-
[46]
Dynamical foundations of nonextensive statistical mechanics
Beck, C. Dynamical foundations of nonextensive statistical mechanics. Physical Review Letters 87, 180601 (2001)
2001
-
[47]
Ke, G. et al. Lightgbm: A highly efficient gradient boosting decision tree. Advances in neural information processing systems 30 (2017)
2017
-
[48]
Lundberg, S. M. & Lee, S.-I. A unified approach to interpreting model predictions. Advances in neural information processing systems 30 (2017)
2017
-
[49]
Interpretable Machine Learning (Lulu
Molnar, C. Interpretable Machine Learning (Lulu. com, 2020)
2020
-
[50]
Zhou, H. et al. Informer: Beyond efficient transformer for long sequence time-series forecasting. In Proceedings of the AAAI conference on artificial intelligence , vol. 35, 11106–11115 (2021)
2021
-
[51]
& Weinberger, K
Huang, G., Liu, Z., Van Der Maaten, L. & Weinberger, K. Q. Densely connected convolutional networks. In Proceedings of the IEEE conference on computer vision and pattern recognition , 4700– 4708 (2017)
2017
-
[52]
& Nash, R
O’Shea, K. & Nash, R. An introduction to convolutional neural networks. arXiv preprint arXiv:1511.08458 (2015). 23
2015 arXiv
-
[53]
& Schmidhuber, J
Hochreiter, S. & Schmidhuber, J. Long short-term memory. Neural computation 9, 1735–1780 (1997)
1997
-
[54]
¨O., Loeff, N
Lim, B., Arık, S. ¨O., Loeff, N. & Pfister, T. Temporal fusion transformers for interpretable multi- horizon time series forecasting. International Journal of Forecasting 37, 1748–1764 (2021)
2021
-
[55]
Challu, C. et al. Nhits: Neural hierarchical interpolation for time series forecasting. Proceedings of the AAAI Conference on Artificial Intelligence 37, 6989–6997 (2023). URL https://ojs.aaai.o rg/index.php/AAAI/article/view/25854
2023
-
[56]
& Matteson, D
Tang, B. & Matteson, D. S. Probabilistic transformer for time series analysis. In Ranzato, M., Beygelzimer, A., Dauphin, Y., Liang, P. & Vaughan, J. W. (eds.) Advances in Neural Information Processing Systems, vol. 34, 23592–23608 (Curran Associates, Inc., 2021). URL https://p...
2021
-
[57]
Duan, T. et al. NGBoost: Natural gradient boosting for probabilistic prediction. In III, H. D. & Singh, A. (eds.) Proceedings of the 37th International Conference on Machine Learning , vol. 119 of Proceedings of Machine Learning Research, 2690–2700 (PMLR, 2020). URL https://pr...
2020
-
[58]
Midas: Uk daily rainfall data
Met Office. Midas: Uk daily rainfall data. NCAS British Atmospheric Data Centre (2006). URL https://catalogue.ceda.ac.uk/uuid/c732716511d3442f05cdeccbe99b8f90. [Date of citation]
2006
-
[59]
Midas uk hourly rainfall data
Met Office. Midas uk hourly rainfall data. NCAS British Atmospheric Data Centre (2006). URL https://catalogue.ceda.ac.uk/uuid/bbd6916225e7475514e17fdbf11141c1. [Date of citation]
2006
-
[60]
Wetzel, R. G. Limnology: Lake and River Ecosystems (Gulf Professional Publishing, 2001). Chapter 9, p.152
2001
-
[61]
Murugesu, J. A. River thames was pumped full of oxygen in 2022 to prevent fish deaths. New Scientist (2023). URL https://www.newscientist.com/article/2379513-river-thames-was-p umped-full-of-oxygen-in-2022-to-prevent-fish-deaths/
2023
-
[62]
https://www.statsmodels.org/stable/generated/statsmodels.tsa .seasonal.seasonal_decompose.html (2023)
statsmodels.tsa.seasonal. https://www.statsmodels.org/stable/generated/statsmodels.tsa .seasonal.seasonal_decompose.html (2023). Accessed: 2023
2023
-
[63]
Python implementation of empirical mode decomposition algorithm
Laszuk, D. Python implementation of empirical mode decomposition algorithm. https://github .com/laszukdawid/PyEMD (2017). Accessed: [2023]
2017
-
[64]
& Koyama, M
Akiba, T., Sano, S., Yanase, T., Ohta, T. & Koyama, M. Optuna: A next-generation hyperparameter optimization framework. In Proceedings of the 25th ACM SIGKDD international conference on knowledge discovery & data mining , 2623–2631 (2019)
2019
-
[65]
& Haffner, P
Lecun, Y., Bottou, L., Bengio, Y. & Haffner, P. Gradient-based learning applied to document recognition. Proceedings of the IEEE 86, 2278–2324 (1998)
1998
-
[66]
Machine Learning Algorithm for Water Quality Prediction
Kingma, D. P. & Ba, J. Adam: A method for stochastic optimization. arXiv preprint arXiv:1412.6980 (2014). Acknowledgments We thank Sebastian P¨ utz for helpful discussions on the machine learning aspects. Moreover, we thank Pippa Tucker from the Environmental Agency for provid...
2014 arXiv
Reviewed August 10, 2026 · model on record in the stance chip above.
Discussion (0). Continue with ORCID to comment.