REVIEW 3 major objections 5 minor 1 cited by
The life and times of dark matter haloes: what will I be when I grow up?
T0 review · 3 major / 5 minor · reviewed 2026-08-05 · deepseek-v4-flash
Pith's one-line read The most massive dark matter haloes do not stay the most massive: only 40% of today's top 100 clusters were still in the top 100 at z=1.
desk verdict Direct measurement of rank churn in MDPL2's top 100 haloes; the 40% survival at z=1 is a useful number but the mass-definition dependence and lack of error bars need attention. read the letter →
The pith
A machine-rendered reading of the paper's core claim, the machinery that carries it, and where it could break.
The reading
What carries the argument
The central device is the 'froth region': the top 100 haloes by virial mass in the simulation volume, where one major merger can change an object's rank dramatically. Haloes are ranked using a redshift-dependent virial mass definition, linked across 50 snapshots by merger trees built from particle membership, and followed along the most massive progenitor branch. The churn rate measured on this ranked sample carries the whole argument.
What would settle it
Recompute the top-100 membership at every snapshot using a fixed overdensity mass definition, such as 200 times the critical density, with the same merger trees; if the fraction surviving from z=1 to z=0 stays near 40%, the churn claim is insensitive to mass definition. Alternatively, compare two observed cluster samples ranked by independent mass proxies, such as X-ray hydrostatic mass versus Sunyaev-Zel'dovich mass, at z~1 and z~0, and ask what fraction of the z~1 top set remains top-ranked at z=0.
Extended reading notes
Core claim
The paper establishes that rank-order stability of the most massive haloes fails: fewer than half of the 100 most massive haloes at z=1 remain in that set at z=0, and only 40% of the z=0 top 100 were in the top 100 at z=1. The apparent tension with hierarchical growth is resolved by merger-driven 'churn': a major merger can roughly double a halo's mass in a short interval, promoting it into the top set, while later quiescent accretion lets rivals overtake it. The authors quantify the effect by building a mass-complete superset of 268 clusters that includes every halo that was ever among the top 100 between z=0 and z=1, and show that a fixed sample's mean mass evolves differently from a truly
Load-bearing premise
The result depends on how a halo's mass is defined: rankings use a virial mass that changes its overdensity contrast with redshift, and a different standard definition could shift some haloes across the top-100 boundary and change the survival fractions.
Editorial extensions
If this is right
- Cluster samples selected at a single redshift are biased toward late-forming systems with recent major mergers, not random draws from the mass function.
- Comparisons between simulations and surveys at high redshift need mass-complete samples, not fixed z=0 selections, or they will miss a large fraction of the most massive progenitors.
- Mass-growth studies of a fixed set of extreme clusters will overestimate growth before the selection epoch and underestimate it afterward, by roughly (1+z)^-0.5.
- A rare, very massive cluster is likely dynamically unrelaxed, so mass estimates from equilibrium assumptions can be biased, and its existence is not a strong challenge to standard cosmology.
- Extending a resimulated cluster sample to be mass-complete back to z=1 requires only modest additions beyond the existing top-324 set.
Reading between the lines
- If churn is as strong in other cosmologies and volumes, high-redshift protocluster surveys selected by galaxy overdensities may trace a different population than z=0 cluster samples; the overlap could be measured by applying the same rank-tracking to mock light cones.
- The dropout rate likely depends on the chosen mass definition; re-ranking with a fixed overdensity mass (for example, 200 times the critical density) would show whether the 40% figure is a property of the mass hierarchy or of the particular virial-mass boundary chosen.
- The churn rate may correlate with environment, because early-forming objects in underdense regions are probably underrepresented in z=0 mass-limited samples; the paper notes but does not test this.
- A similar rank-churn analysis applied to lower mass thresholds or to the galaxy stellar-mass function could show whether the effect is limited to the extreme top of the hierarchy or is general.
Editorial analysis
A structured set of objections, weighed in public.
Referee Report
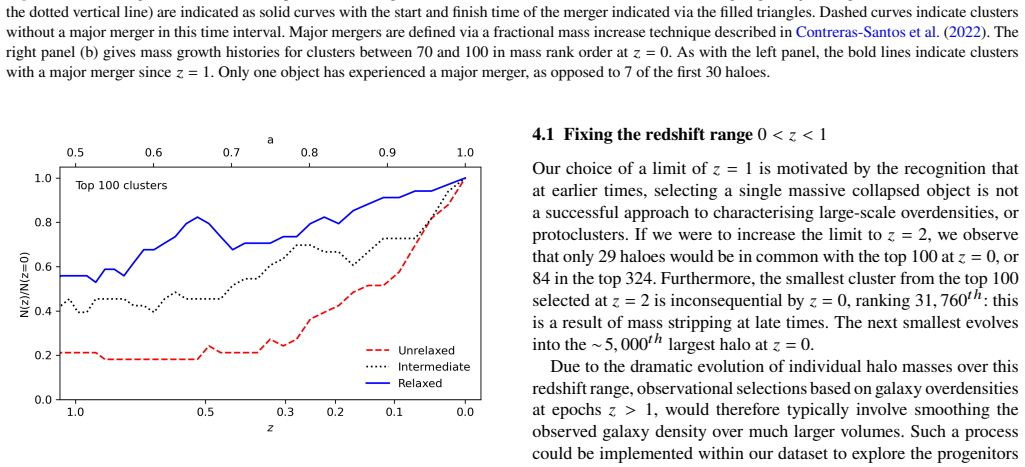
Summary. This paper uses the MultiDark Planck 2 (MDPL2) dark-matter-only simulation to track the 100 most massive haloes at z=0 backwards and forwards in time and asks whether the most massive objects at one redshift remain the most massive at another. Using Rockstar halo catalogues and ConsistentTrees merger trees, the authors measure a large degree of 'churn': only ~40% of the top-100 haloes at z=0 are still in the top 100 at z=1. They report that the most massive haloes have experienced more major mergers and are more likely to be dynamically unrelaxed, and they use these results to motivate an extended, mass-complete cluster sample of 268 regions for the Three Hundred Project. They conclude that fixed-epoch mass-selected samples are biased and that the common assumption of a one-to-one correspondence between the most massive clusters across redshifts is incorrect.
Significance. The qualitative conclusion—that rank-order stability of the most massive haloes is poor, especially across z ~ 1—is likely robust and practically relevant for cluster cosmology and for the design of resimulation projects such as The Three Hundred. The paper makes good use of a large public simulation and provides a direct, falsifiable measurement. However, the quantitative headline (the 40% survival fraction) and the proposed 268-cluster superset depend on the adopted halo mass definition (Rockstar Mvir with the Bryan & Norman 1998 overdensity), which itself evolves with redshift. The paper also quotes no uncertainties on the survival fractions, and the (1+z)^-0.5 growth scaling is presented without a derivation or scatter. These are load-bearing issues for the paper's central quantitative claims, though they should be addressable with additional analysis.
major comments (3)
- [§2.2, Fig. 1 footnote, §4.3] The headline survival fraction (Fig. 2: only ~40% of the top-100 at z=0 remain in the top 100 at z=1) is computed from ranks based on the Rockstar virial mass Mvir, which uses the redshift-dependent Bryan & Norman (1998) overdensity. As the Fig. 1 footnote itself notes, 'the mass definition evolves with redshift.' Near the steep top-100 boundary, rank membership can therefore change simply because the halo aperture changes with redshift, and §4.3 notes that halo masses can be overestimated by ~50% at merger peaks. The paper provides no test using a fixed-overdensity definition such as M200c or M200m. Please re-run the survival analysis with such a definition and report the effect on the 40% value and on the 268-cluster superset in §4.2.
- [§3, Fig. 2] The survival fractions are quoted without any error estimate. The analysis uses a single simulation volume, and the top-100 sample is small; the z=1 survival fraction of ~40% is a single number with no uncertainty. Please provide at least a jackknife or bootstrap over simulation octants, or a Poisson/order-statistics estimate, and state whether the differences between N=100 and N=324 are significant. The claim that 'there is little difference in the dropout rate' (p.5) is currently a visual impression.
- [§3, Fig. 3] The text states that the mean mass of a fixed top-100 sample grows faster than the evolving sample by a factor of (1+z)^-0.5 prior to selection, and compares this with the Kaiser (1986) scaling in Eq. (1). No derivation, fit procedure, uncertainty, or redshift range of validity is given; this appears to be an empirical fit to the simulation. Please specify how the exponent was obtained, show its scatter, and avoid implying that it follows from the Kaiser model unless a derivation is provided.
minor comments (5)
- [Fig. 4 caption / §3 text] The caption and the text describe the green curves inconsistently. The caption defines 'green dashed line: the minimum mass of the top 100 haloes at each time' while the text says 'green dashed lines show the mass evolution of the smallest of any of the objects that form the original sample.' Please align the descriptions and mark the curves consistently.
- [§3.1, Fig. 6] The text in §3.1 says 'those without are shown as dotted lines,' while the Fig. 6 caption says 'Dashed curves indicate clusters without a major merger.' Please standardize the line-style terminology.
- [§3.1] The dynamical state is referenced as 'equation one taken from Haggar et al. (2024)' without reproducing the definition. Since the binning into relaxed/unrelaxed sets in Fig. 7 depends on this quantity, please give the equation or a precise description.
- [§2.2] The term 'froth' region is used without a definition. Clarify that it refers to the mass range near the top-100 boundary where a single major merger can change rank order.
- [§4.2, footnote 2] The construction of the 268-cluster supersets relies on merger-tree identifications and a 2 h^-1 Mpc separation cut. A sentence noting the sensitivity of the final count to these choices would be useful for reproducibility.
Circularity Check
No significant circularity: the central churn measurement is a direct simulation rank-order statistic, with self-citations limited to auxiliary tools.
full rationale
The paper's central claim—that only ~40% of the top-100 haloes at z=0 are still in the top 100 at z=1—is a direct rank-order measurement from the MDPL2 simulation, not a derivation from a model. The top-100 sample is defined by sorting Rockstar virial masses at each snapshot, and the survival fraction is read off from merger-tree progenitor links. No fitted parameter is renamed as a prediction. The only fitted-looking curve, the (1+z)^-0.5 growth scaling in Fig. 3, is presented as an empirical characterization of the measured fixed-sample mass evolution ('For mean mass, the rates of growth of the fixed samples are more rapid ... by a factor of (1+z)^-0.5'), not as a first-principles prediction. Self-citations appear for auxiliary tools: Onions et al. (2012) and Srisawat et al. (2013) for reliability of Rockstar/ConsistentTrees, Contreras-Santos et al. (2022) for the major-merger identification used in Fig. 6, and Haggar et al. (2024) for the dynamical-state measure used in Fig. 7. None of these is used to construct the central churn statistic; they support secondary interpretation. The Fig. 1 footnote acknowledges that the Rockstar/Bryan & Norman mass definition evolves with redshift. This is an important robustness caveat—top-100 membership could shift under a fixed-overdensity definition—but it is a sensitivity limitation, not circularity: the paper does not define the churn result in terms of that mass definition, and the measurement remains a legitimate simulation-based statistic under the stated definition. No step in the paper reduces by construction to its own input, so no circularity is found.
Assumptions & free parameters
free parameters (2)
- Sample size N=100
- (1+z)^-0.5 growth exponent =
-0.5
assumptions (4)
- domain assumption MDPL2 simulation and its halo catalogues accurately represent halo growth and masses
- domain assumption Most massive progenitor defines the main branch
- domain assumption Bryan & Norman (1998) virial mass is the appropriate ranking mass
- domain assumption The major merger definition from Contreras-Santos et al. (2022) is adopted
Cite this review
Pith. "Pith review of The life and times of dark matter haloes: what will I be when I grow up?." pith.science (2026). https://pith.science/paper/XGTTFOZD
@misc{pith2026250818778,
  author       = {Pith},
  title        = {Pith review of: The life and times of dark matter haloes: what will I be when I grow up?},
  year         = {2026},
  howpublished = {\url{https://pith.science/paper/XGTTFOZD}},
  note         = {Machine review of arXiv:2508.18778}
}
abstract
Are the most massive objects in the Universe today the direct descendants of the most massive objects at higher redshift? We address this question by tracing the evolutionary histories of haloes in the MultiDark Planck2 simulation. By following the 100 most massive halos at $z = 0$ across cosmic time, we find that only 40\% of them were among the largest 100 halos at $z = 1$. This suggests that many of today's most massive clusters were not the most dominant structures at earlier times, while some of the most massive objects at high redshift do not remain in the top mass ranks at later epochs. The hierarchical nature of structure formation predicts that, on average, massive haloes grow over time, with their abundance in comoving space decreasing rapidly at higher redshifts. However, individual clusters exhibit diverse evolutionary paths: some undergo early rapid growth, while others experience steady accretion or significant merger-driven mass changes. A key assumption in self-similar models of cluster evolution is that the most massive objects maintain their rank in the mass hierarchy across cosmic time. In this work, we test this assumption by constructing a mass-complete sample of haloes within the $(1 h^{-1}{\rm Gpc})^3$ volume of MultiDark and analysing when clusters enter and exit a high-mass-selected sample. Our results demonstrate that cluster selections must be carefully constructed, as significant numbers of objects can enter and leave the sample over time. These findings have important implications for observational cluster selection and comparisons between simulations and surveys, especially at high redshift.
Figures


Figures from the paper (3 more)


Forward citations
Cited by 1 Pith paper
-
The youth of the intracluster medium. I. A non-parametric characterisation of the gas and electron number density profiles of $z \simeq 2$ protoclusters
At z≈2, Magneticum protoclusters show moderate self-similarity deviations, double-β density profiles, and hot ionised gas dominant only beyond ~0.1–0.5 R500c, with clear mass, merger and AGN trends.
Reference graph
Works this paper leans on
-
[1]
write newline
" write newline "" before.all 'output.state := FUNCTION fin.entry write newline FUNCTION new.block output.state before.all = 'skip after.block 'output.state := if FUNCTION new.sentence output.state after.block = 'skip output.state before.all = 'skip after.sentence 'output.state := if if FUNCTION not #0 #1 if FUNCTION and 'skip pop #0 if FUNCTION or pop #1...
-
[2]
Almeida A., et al., 2023, @doi [The Astrophysical Journal Supplement Series] 10.3847/1538-4365/acda98 , 267, 44
-
[3]
Ascasibar Y., Yepes G., Gottlöber S., Müller V., 2004, @doi [Monthly Notices of the Royal Astronomical Society] 10.1111/j.1365-2966.2004.08002.x , 352, 1109
arXiv 2004
-
[4]
Behroozi P. S., Wechsler R. H., Wu H.-Y., 2012a, @doi [The Astrophysical Journal] 10.1088/0004-637X/762/2/109 , 762, 109
-
[5]
Behroozi P. S., Wechsler R. H., Wu H.-Y., Busha M. T., Klypin A. A., Primack J. R., 2012b, @doi [The Astrophysical Journal] 10.1088/0004-637X/763/1/18 , 763, 18
-
[6]
Bleem L. E., et al., 2015, @doi [ApJS] 10.1088/0067-0049/216/2/27 , https://ui.adsabs.harvard.edu/abs/2015ApJS..216...27B 216, 27
-
[7]
Bryan G. L., Norman M. L., 1998, @doi [ApJ] 10.1086/305262 , https://ui.adsabs.harvard.edu/abs/1998ApJ...495...80B 495, 80
doi:10.1086/305262 1998
-
[8]
Chiang Y.-K., Overzier R., Gebhardt K., 2014, @doi [The Astrophysical Journal] 10.1088/2041-8205/782/1/l3 , 782, L3
Show all 51 references
-
[9]
Collaboration: D. E. S., et al., 2016, @doi [Monthly Notices of the Royal Astronomical Society] 10.1093/mnras/stw641 , 460, 1270
2016 doi
-
[10]
Contreras-Santos A., et al., 2022, @doi [MNRAS] 10.1093/mnras/stac275 , 511, 2897–2913
2022 doi
-
[11]
Cui W., et al., 2018, @doi [MNRAS] 10.1093/mnras/sty2111 , 480, 2898
2018 doi
-
[12]
A., Angl \'e s-Alc \'a zar D., Yang X., 2021, @doi [Nature Astronomy] 10.1038/s41550-021-01404-1 , https://ui.adsabs.harvard.edu/abs/2021NatAs...5.1069C 5, 1069
Cui W., Dav \'e R., Peacock J. A., Angl \'e s-Alc \'a zar D., Yang X., 2021, @doi [Nature Astronomy] 10.1038/s41550-021-01404-1 , https://ui.adsabs.harvard.edu/abs/2021NatAs...5.1069C 5, 1069
2021 doi
-
[13]
Cui W., Jennings F., Dave R., Babul A., Gozaliasl G., 2024, @doi [Monthly Notices of the Royal Astronomical Society] 10.1093/mnras/stae2115 , https://ui.adsabs.harvard.edu/abs/2024MNRAS.534.1247C 534, 1247
2024 doi
-
[14]
V., 2014, @doi [Astrophysical Journal] 10.1088/0004-637X/789/1/1 , 789, 1
Diemer B., Kravtsov A. V., 2014, @doi [Astrophysical Journal] 10.1088/0004-637X/789/1/1 , 789, 1
2014 doi
-
[15]
Ferragamo A., et al., 2023, @doi [Monthly Notices of the Royal Astronomical Society] 10.1093/mnras/stad377 , https://ui.adsabs.harvard.edu/abs/2023MNRAS.520.4000F 520, 4000
2023 doi
-
[16]
Gao L., Springel V., White S. D. M., 2005, @doi [Monthly Notices of the Royal Astronomical Society] 10.1111/j.1745-3933.2005.00084.x , https://ui.adsabs.harvard.edu/abs/2005MNRAS.363L..66G 363, L66
2005
-
[17]
E., Gott J
Gunn J. E., Gott J. R., 1972, @doi [Astrophysical Journal] 10.1086/151605 , 176, 1
1972 doi
-
[18]
Haggar R., et al., 2024, @doi [MNRAS] 10.1093/mnras/stae1566 , 532, 1031
2024 doi
-
[19]
A., Muldrew S
Hatch N. A., Muldrew S. I., Cooke E. A., Hartley W. G., Almaini O., Simpson C. J., Conselice C. J., 2016, @doi [Monthly Notices of the Royal Astronomical Society] 10.1093/mnras/stw602 , 459, 387–401
2016 doi
-
[20]
S., White S
Jenkins A., Frenk C. S., White S. D. M., Colberg J. M., Cole S., Evrard A. E., Couchman H. M. P., Yoshida N., 2001, @doi [Monthly Notices of the Royal Astronomical Society] 10.1046/j.1365-8711.2001.04029.x , 321, 372
2001
-
[21]
Kaiser N., 1986, @doi [Monthly Notices of the Royal Astronomical Society] 10.1093/mnras/222.2.323 , 222, 323
1986 doi
-
[22]
Kilbinger M., et al., 2013, @doi [MNRAS] 10.1093/mnras/stt041 , 430, 2200–2220
2013 doi
-
[23]
Kim D.-W., et al., 2006, @doi [ApJ] 10.1086/503828 , 644, 829
2006 doi
-
[24]
et al., 2025, @doi [A&A] 10.1051/0004-6361/202554777 , 700, A95
Kimmig, Lucas C. et al., 2025, @doi [A&A] 10.1051/0004-6361/202554777 , 700, A95
2025 doi
-
[25]
Klypin A., Yepes G., Gottlöber S., Prada F., Heß S., 2016, @doi [MNRAS] 10.1093/mnras/stw248 , 457, 4340
2016 doi
-
[26]
J., Gao L., 2008, @doi [Monthly Notices of the Royal Astronomical Society] 10.1111/j.1365-2966.2008.13667.x , https://ui.adsabs.harvard.edu/abs/2008MNRAS.389.1419L 389, 1419
Li Y., Mo H. J., Gao L., 2008, @doi [Monthly Notices of the Royal Astronomical Society] 10.1111/j.1365-2966.2008.13667.x , https://ui.adsabs.harvard.edu/abs/2008MNRAS.389.1419L 389, 1419
2008
-
[27]
A., Biviano A., Boué G., 2013, @doi [Monthly Notices of the Royal Astronomical Society] 10.1093/mnras/sts562 , 429, 3079
Mamon G. A., Biviano A., Boué G., 2013, @doi [Monthly Notices of the Royal Astronomical Society] 10.1093/mnras/sts562 , 429, 3079
2013 doi
-
[28]
M., Brinkmann J., 2006, @doi [Monthly Notices of the Royal Astronomical Society] 10.1111/j.1365-2966.2006.10156.x , 368, 715
Mandelbaum R., Seljak U., Kauffmann G., Hirata C. M., Brinkmann J., 2006, @doi [Monthly Notices of the Royal Astronomical Society] 10.1111/j.1365-2966.2006.10156.x , 368, 715
2006
-
[29]
Matthee J., Schaye J., Crain R. A., Schaller M., Bower R., Theuns T., 2017, @doi [Monthly Notices of the Royal Astronomical Society] 10.1093/mnras/stw2884 , https://ui.adsabs.harvard.edu/abs/2017MNRAS.465.2381M 465, 2381
2017 doi
-
[31]
Menanteau F., et al., 2010, @doi [ ] 10.1088/0004-637X/723/2/1523 , https://ui.adsabs.harvard.edu/abs/2010ApJ...723.1523M 723, 1523
2010 doi
-
[32]
V., Dutton A
Mostoghiu R., Macci \`o A. V., Dutton A. A., Kang X., Obreja A., 2019, @doi [Monthly Notices of the Royal Astronomical Society] 10.1093/mnras/sty3310 , 483, 3390
2019 doi
-
[33]
V., Vikhlinin A., 2007, @doi [Astrophysical Journal] 10.1086/521328 , 668, 1
Nagai D., Kravtsov A. V., Vikhlinin A., 2007, @doi [Astrophysical Journal] 10.1086/521328 , 668, 1
2007 doi
-
[34]
Ntampaka M., et al., 2019, @doi [The Astrophysical Journal] 10.3847/1538-4357/ab14eb , https://ui.adsabs.harvard.edu/abs/2019ApJ...876...82N 876, 82
2019 doi
-
[35]
Old L., et al., 2014, @doi [Monthly Notices of the Royal Astronomical Society] 10.1093/mnras/stu684 , 441, 1513
2014 doi
-
[36]
Onions J., et al., 2012, @doi [MNRAS] 10.1111/j.1365-2966.2012.20947.x , 423, 1200
2012
-
[37]
Planck Collaboration et al., 2016, @doi [A&A] 10.1051/0004-6361/201525830 , 594, A13
2016 doi
-
[38]
H., Schechter P., 1974, @doi [Astrophysical Journal] 10.1086/152650 , 187, 425
Press W. H., Schechter P., 1974, @doi [Astrophysical Journal] 10.1086/152650 , 187, 425
1974 doi
-
[39]
K., Tormen G., 1999, @doi [Monthly Notices of the Royal Astronomical Society] 10.1046/j.1365-8711.1999.02692.x , 308, 119
Sheth R. K., Tormen G., 1999, @doi [Monthly Notices of the Royal Astronomical Society] 10.1046/j.1365-8711.1999.02692.x , 308, 119
1999
-
[40]
Shirasaki M., Yoshida N., 2014, @doi [The Astrophysical Journal] 10.1088/0004-637X/786/1/43 , 786, 43
2014 doi
-
[41]
Srisawat C., et al., 2013, @doi [Monthly Notices of the Royal Astronomical Society] 10.1093/mnras/stt1545 , 436, 150–162
2013 doi
-
[42]
Tojeiro R., et al., 2017, @doi [Monthly Notices of the Royal Astronomical Society] 10.1093/mnras/stx1466 , https://ui.adsabs.harvard.edu/abs/2017MNRAS.470.3720T 470, 3720
2017 doi
-
[43]
Toshikawa J., et al., 2014, @doi [The Astrophysical Journal] 10.1088/0004-637x/792/1/15 , 792, 15
2014 doi
-
[44]
Vikhlinin A., et al., 2009, @doi [ApJ] 10.1088/0004-637X/692/2/1060 , https://ui.adsabs.harvard.edu/abs/2009ApJ...692.1060V 692, 1060
2009 doi
-
[45]
Wang L., et al., 2014, @doi [MNRAS] 10.1093/mnras/stt2481 , https://ui.adsabs.harvard.edu/abs/2014MNRAS.439..611W 439, 611
2014 doi
-
[47]
H., Bullock J
Wechsler R. H., Bullock J. S., Primack J. R., Kravtsov A. V., Dekel A., 2002b, @doi [The Astrophysical Journal] 10.1086/338765 , https://ui.adsabs.harvard.edu/abs/2002ApJ...568...52W 568, 52
-
[48]
L., Mamon G
Wojtak R., Łokas E. L., Mamon G. A., Gottlöber S., Klypin A., Hoffman Y., 2007, @doi [Astronomy & Astrophysics] 10.1051/0004-6361:20066832 , 466, 437
2007 doi
-
[49]
J., Van Waerbeke L., Hinshaw G., McCarthy I
Yan Z., Mead A. J., Van Waerbeke L., Hinshaw G., McCarthy I. G., 2020, @doi [Monthly Notices of the Royal Astronomical Society] 10.1093/mnras/staa3030 , https://ui.adsabs.harvard.edu/abs/2020MNRAS.499.3445Y 499, 3445
2020 doi
-
[50]
Yuan T., et al., 2014, @doi [The Astrophysical Journal] 10.1088/2041-8205/795/1/l20 , 795, L20
2014 doi
-
[51]
J., Baugh C
Zehavi I., Contreras S., Padilla N., Smith N. J., Baugh C. M., Norberg P., 2018, @doi [The Astrophysical Journal] 10.3847/1538-4357/aaa54a , https://ui.adsabs.harvard.edu/abs/2018ApJ...853...84Z 853, 84
2018 doi
-
[52]
H., Mo H
Zhao D. H., Mo H. J., Jing Y. P., Börner G., 2003, @doi [Monthly Notices of the Royal Astronomical Society] 10.1046/j.1365-8711.2003.06149.x , 339, 12
2003
-
[53]
de Andres D., et al., 2022, @doi [Nature Astronomy] 10.1038/s41550-022-01784-y , https://ui.adsabs.harvard.edu/abs/2022NatAs...6.1325D 6, 1325
2022 doi
Reviewed August 5, 2026 · model on record in the stance chip above.
Discussion (0). Continue with ORCID to comment.