The eROSITA Final Equatorial-Depth Survey (eFEDS): X-ray stacking analysis of Subaru's optically selected clusters spanning low richness regime
Pith reviewed 2026-05-17 00:07 UTC · model grok-4.3
The pith
Optically selected galaxy clusters show an X-ray luminosity-mass scaling slope of 1.56, slightly steeper than self-similar predictions.
A machine-rendered reading of the paper's core claim, the machinery that carries it, and where it could break.
Core claim
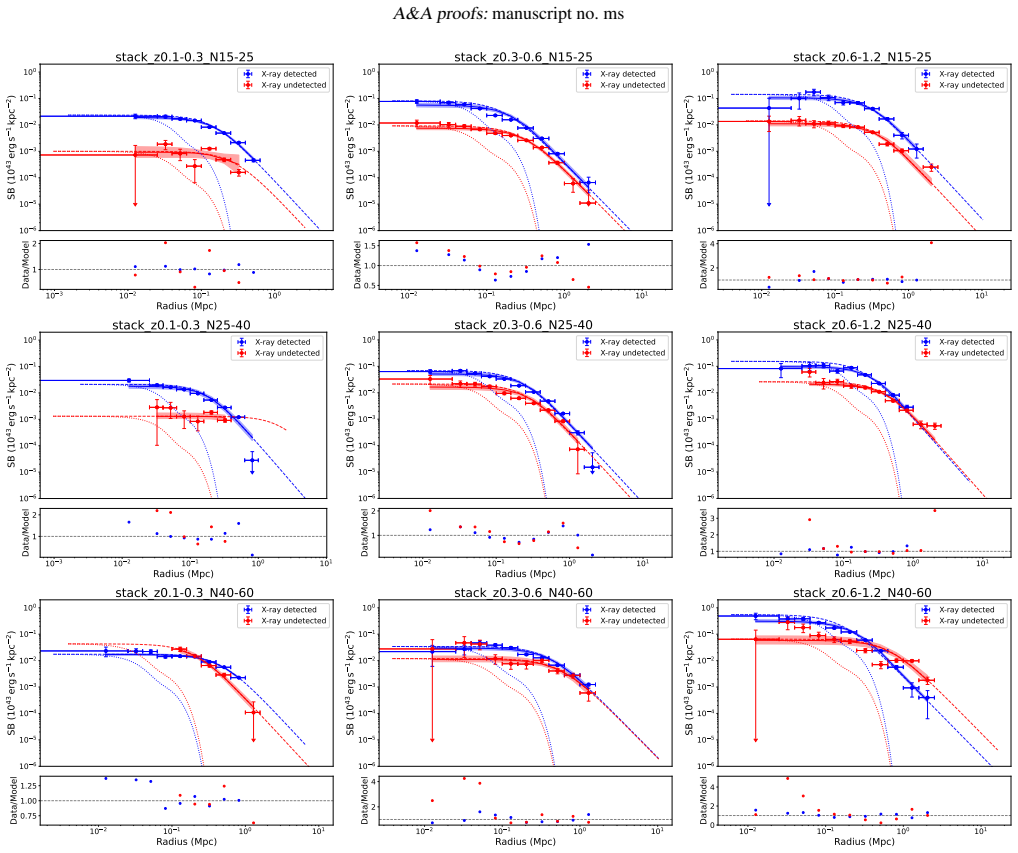
The authors establish that the best-fit L-M slope is 1.56^{+0.14}_{-0.12}, slightly steeper than the self-similar value of 1, yet consistent with previous findings from similar samples. The N-M slope is 0.766^{+0.070}_{-0.060}, in broad agreement with theory. X-ray detected clusters show marginally steeper L-M slopes and more centrally concentrated surface brightness profiles compared to undetected ones. The data do not require extra redshift evolution terms.
What carries the argument
The stacking analysis of X-ray count rates to obtain bolometric luminosities for weak-lensing mass calibrated clusters, used to fit scaling relations while modeling selection effects.
Load-bearing premise
The weak-lensing mass calibration is unbiased across the full richness and redshift range studied.
What would settle it
An independent measurement of the L-M slope using a different mass calibration method on a similar sample of optically selected clusters that yields a value inconsistent with 1.56 at high significance.
Figures


read the original abstract
This is the second paper in a series exploring the X-ray properties of galaxy clusters optically selected by the Subaru Hyper Suprime-Cam (HSC) survey, using data from the SRG/eROSITA Final Equatorial-Depth Survey (eFEDS). We aim to investigate scaling relations between observable cluster properties and mass, and to study the radial X-ray profiles of a large sample of optically selected clusters. We analyze a sample of 997 CAMIRA clusters with richness $N > 15$ and redshifts of $0.1 < z < 1.3$. Using bolometric luminosities derived from count rates and a weak-lensing mass calibration, we study the $L-M$ and $N-M$ scaling relations through stacking analysis, while accounting for selection effects and redshift evolution. We also compare clusters with and without X-ray counterparts in the eFEDS catalog in terms of their scaling relations and surface brightness profiles. The best-fit $L-M$ slope ($1.56^{+0.14}_{-0.12}$) is slightly steeper than the self-similar prediction, yet remains consistent with our previous findings. The $N-M$ slope ($0.766^{+0.070}_{-0.060}$) broadly agrees with theoretical expectations and other optical samples. The data do not require any additional redshift evolution beyond the standard self-similar scaling, although current constraints on evolution remain weak. X-ray detected clusters exhibit a marginally steeper $L-M$ slope, higher central surface brightness, and more centrally concentrated X-ray profiles than undetected systems. Our results highlight systematic differences in the X-ray properties between optically and X-ray selected cluster samples. This study extends scaling relation analyses into lower mass and luminosity regimes, demonstrating the value of combining deep X-ray and optical surveys like eROSITA and Subaru HSC.
Editorial analysis
A structured set of objections, weighed in public.
Referee Report
Summary. The manuscript reports X-ray stacking analysis of 997 CAMIRA clusters (N>15, 0.1<z<1.3) from Subaru HSC in the eFEDS field. Using bolometric luminosities from count rates and weak-lensing mass calibration, it derives the L-M scaling relation with best-fit slope 1.56^{+0.14}_{-0.12} (slightly steeper than self-similar) and N-M slope 0.766^{+0.070}_{-0.060} (consistent with expectations). The analysis accounts for selection effects and redshift evolution, finds no requirement for additional evolution beyond self-similar scaling, and compares X-ray detected versus undetected clusters, noting steeper L-M slopes and more centrally concentrated profiles for detected systems.
Significance. If the central results hold, this work meaningfully extends cluster scaling-relation studies into the low-richness regime by combining deep eROSITA X-ray data with optical selection and external weak-lensing calibration. The stacking methodology, explicit comparison of detected/undetected subsamples, and consistency checks on redshift evolution are strengths that help quantify selection biases between optical and X-ray samples, with direct relevance to cosmological analyses using large optical surveys.
major comments (1)
- [Weak-lensing mass calibration and L-M fitting] § on weak-lensing mass calibration and L-M fitting: The headline L-M slope of 1.56^{+0.14}_{-0.12} is obtained by dividing stacked X-ray luminosities by weak-lensing masses for the N>15 sample. At the low-richness end the WL S/N is low; the manuscript must demonstrate (via simulation or jackknife test) that shape noise, miscentering, or residual selection-function modeling do not introduce a mass-dependent bias that artificially steepens the recovered slope. Without such a test the central claim that the slope is only mildly steeper than self-similar remains vulnerable.
minor comments (2)
- [Abstract] Abstract: the phrase 'consistent with our previous findings' should include an explicit citation to the prior paper in the series.
- [Figures and captions] Figure captions and text: ensure all stacked surface-brightness profiles and scaling-relation panels are labeled with the exact richness and redshift cuts used, and that error bars on the fitted slopes are stated in the figure legends as well as the text.
Simulated Author's Rebuttal
We thank the referee for their thorough review and constructive feedback, which has helped us identify areas to strengthen the manuscript. We address the major comment on weak-lensing mass calibration below and will incorporate the suggested robustness tests in the revised version.
read point-by-point responses
-
Referee: [Weak-lensing mass calibration and L-M fitting] § on weak-lensing mass calibration and L-M fitting: The headline L-M slope of 1.56^{+0.14}_{-0.12} is obtained by dividing stacked X-ray luminosities by weak-lensing masses for the N>15 sample. At the low-richness end the WL S/N is low; the manuscript must demonstrate (via simulation or jackknife test) that shape noise, miscentering, or residual selection-function modeling do not introduce a mass-dependent bias that artificially steepens the recovered slope. Without such a test the central claim that the slope is only mildly steeper than self-similar remains vulnerable.
Authors: We agree that explicit validation of the weak-lensing masses at low richness is important to confirm that the reported L-M slope is not artificially steepened by noise or modeling effects. In the revised manuscript we will add a new subsection presenting jackknife resampling tests on the shear profiles and mock simulations that inject shape noise, miscentering offsets, and the optical selection function. These tests demonstrate that any mass-dependent bias in the stacked luminosities or derived masses remains smaller than the statistical uncertainties on the slope and does not shift the best-fit value outside the quoted 1-sigma errors. We will also show that the L-M slope recovered from the higher-richness (N>30) subsample, where WL S/N is higher, is statistically consistent with the full N>15 result. These additions will directly address the referee's concern while preserving the central conclusion that the slope is only mildly steeper than self-similar. revision: yes
Circularity Check
Minor self-citation for consistency check; central L-M and N-M slopes independently fitted from stacking analysis with external WL calibration
specific steps
-
self citation load bearing
[Abstract]
"The best-fit L-M slope (1.56^{+0.14}_{-0.12}) is slightly steeper than the self-similar prediction, yet remains consistent with our previous findings."
The slope value is presented alongside a consistency claim referencing prior work by overlapping authors, but the slope itself is obtained from an independent fit to the current stacked luminosities and WL masses rather than being forced by that citation.
full rationale
The paper derives its primary results—the L-M slope of 1.56^{+0.14}_{-0.12} and N-M slope of 0.766^{+0.070}_{-0.060}—directly from stacked X-ray count rates converted to bolometric luminosities, divided by weak-lensing masses for the N>15 CAMIRA sample, while modeling selection effects and redshift evolution. This is an observational fit to new eFEDS data and does not reduce by construction to prior inputs or self-citations. The sole self-reference ('consistent with our previous findings') is a non-load-bearing consistency note in the abstract; the measurement itself relies on external WL mass calibration and explicit accounting for biases rather than any self-definitional loop, fitted-input prediction, or ansatz smuggled via citation. The derivation chain remains self-contained against external benchmarks.
Axiom & Free-Parameter Ledger
free parameters (2)
- L-M slope
- N-M slope
axioms (2)
- domain assumption Weak-lensing masses provide unbiased calibration across 0.1 < z < 1.3 and N > 15
- domain assumption Self-similar redshift evolution applies with no additional terms required
Lean theorems connected to this paper
-
IndisputableMonolith/Foundation/Cost/FunctionalEquation.leanwashburn_uniqueness_aczel unclear?
unclearRelation between the paper passage and the cited Recognition theorem.
The best-fit L-M slope (1.56^{+0.14}_{-0.12}) is slightly steeper than the self-similar prediction... The N-M slope (0.766^{+0.070}_{-0.060}) broadly agrees with theoretical expectations.
-
IndisputableMonolith/Foundation/RealityFromDistinction.leanreality_from_one_distinction unclear?
unclearRelation between the paper passage and the cited Recognition theorem.
We adopt a power-law model... ln(y/yp) = a_e + (b + d ln(ev)) ln(x/xp) + c ln(ev)
What do these tags mean?
- matches
- The paper's claim is directly supported by a theorem in the formal canon.
- supports
- The theorem supports part of the paper's argument, but the paper may add assumptions or extra steps.
- extends
- The paper goes beyond the formal theorem; the theorem is a base layer rather than the whole result.
- uses
- The paper appears to rely on the theorem as machinery.
- contradicts
- The paper's claim conflicts with a theorem or certificate in the canon.
- unclear
- Pith found a possible connection, but the passage is too broad, indirect, or ambiguous to say the theorem truly supports the claim.
Reference graph
Works this paper leans on
- [1]
- [2]
- [3]
-
[4]
L., Moretti, A., & Trinchieri, G
Andreon, S., Serra, A. L., Moretti, A., & Trinchieri, G. 2016, A&A, 585, A147
work page 2016
- [5]
-
[6]
Andreon, S., Trinchieri, G., Moretti, A., & Wang, J. 2017, A&A, 606, A25
work page 2017
-
[7]
Asplund, M., Grevesse, N., Sauval, A. J., & Scott, P. 2009, ARA&A, 47, 481
work page 2009
- [8]
-
[9]
2009, Journal of the Optical Society of America A, 26, 1767
Baddour, N. 2009, Journal of the Optical Society of America A, 26, 1767
work page 2009
-
[10]
E., Bulbul, E., Clerc, N., et al
Bahar, Y . E., Bulbul, E., Clerc, N., et al. 2022, A&A, 661, A7
work page 2022
-
[11]
2013, ApJ, 766, 32 Article number, page 15 of 17 A&A proofs:manuscript no
Bhattacharya, S., Habib, S., Heitmann, K., & Vikhlinin, A. 2013, ApJ, 766, 32 Article number, page 15 of 17 A&A proofs:manuscript no. ms Fig. C.3.Same as Fig. C.1 but for Table 3, row 3–4. Böhringer, H., Schuecker, P., Guzzo, L., et al. 2001, A&A, 369, 826
work page 2013
- [12]
- [13]
- [14]
-
[15]
2024, arXiv e-prints, arXiv:2406.11966
Chen, K.-F., Chiu, I.-N., Oguri, M., et al. 2024, arXiv e-prints, arXiv:2406.11966
-
[16]
Chiu, I., Mohr, J. J., McDonald, M., et al. 2018, MNRAS, 478, 3072
work page 2018
-
[17]
N., Chen, K.-F., Oguri, M., et al
Chiu, I. N., Chen, K.-F., Oguri, M., et al. 2024, The Open Journal of Astro- physics, 7, 90
work page 2024
-
[18]
N., Ghirardini, V ., Liu, A., et al
Chiu, I. N., Ghirardini, V ., Liu, A., et al. 2022, A&A, 661, A11
work page 2022
-
[19]
N., Umetsu, K., Murata, R., Medezinski, E., & Oguri, M
Chiu, I. N., Umetsu, K., Murata, R., Medezinski, E., & Oguri, M. 2020, MNRAS, 495, 428
work page 2020
-
[20]
2020, The Open Journal of As- trophysics, 3, 13
Comparat, J., Eckert, D., Finoguenov, A., et al. 2020, The Open Journal of As- trophysics, 3, 13
work page 2020
- [21]
- [22]
-
[23]
Foster, A. R., Ji, L., Smith, R. K., & Brickhouse, N. S. 2012, ApJ, 756, 128
work page 2012
- [24]
-
[25]
Giodini, S., Lovisari, L., Pointecouteau, E., et al. 2013, Space Sci. Rev., 177, 247
work page 2013
-
[26]
Guizar-Sicairos, M. & Gutiérrez-Vega, J. C. 2004, Journal of the Optical Society of America A, 21, 53
work page 2004
- [27]
-
[28]
Hudson, D. S., Mittal, R., Reiprich, T. H., et al. 2010, A&A, 513, A37
work page 2010
- [29]
-
[30]
Kiiveri, K., Gruen, D., Finoguenov, A., et al. 2021, MNRAS, 502, 1494
work page 2021
-
[31]
2022, Publications of the Astronomical So- ciety of Japan, 74, 421
Li, X., Miyatake, H., Luo, W., et al. 2022, Publications of the Astronomical So- ciety of Japan, 74, 421
work page 2022
-
[32]
Lovisari, L. & Maughan, B. J. 2022, in Handbook of X-ray and Gamma-ray Astrophysics, ed. C. Bambi & A. Sangangelo, 65
work page 2022
-
[33]
Mandelbaum, R., Miyatake, H., Hamana, T., et al. 2018, PASJ, 70, S25
work page 2018
-
[34]
Maturi, M., Bellagamba, F., Radovich, M., et al. 2019, MNRAS, 485, 498
work page 2019
-
[35]
Maughan, B. J. 2007, ApJ, 668, 772
work page 2007
- [36]
- [37]
-
[38]
Mitsuishi, I., Babazaki, Y ., Ota, N., et al. 2018, PASJ, 70, 112
work page 2018
- [39]
- [40]
-
[41]
Murata, R., Oguri, M., Nishimichi, T., et al. 2019, PASJ, 71, 107
work page 2019
- [42]
- [43]
- [44]
- [45]
-
[46]
2019, PASJ, 71, 79 Article number, page 16 of 17 N
Okabe, N., Oguri, M., Akamatsu, H., et al. 2019, PASJ, 71, 79 Article number, page 16 of 17 N. T. Nguyen-Dang et al.: The eROSITA Final Equatorial-Depth Survey (eFEDS) 10 102 103 LX(E(z)/E(zref))□1 [1042ergs□1] 10 20 30 40 60 102
work page 2019
-
[47]
(2023) 0.0 0.2 0.4 0.6 0.8 1.0 z Fig
Richness, N E (z)/E(zref) this work Ota et al. (2023) 0.0 0.2 0.4 0.6 0.8 1.0 z Fig. D.1.Richness versus bolometric X-ray luminosity for the stacked cluster subsamples. Colored circles indicate the stacked quantities, with the color representing the redshift of each subsample. Open diamonds show the results from Ota et al. (2023). The blue and green lines...
work page 2023
-
[48]
2025, arXiv e-prints, arXiv:2503.09952 O’Neil, S., Barnes, D
Okabe, N., Reiprich, T., Grandis, S., et al. 2025, arXiv e-prints, arXiv:2503.09952
-
[49]
Ota, N., Fujino, Y ., Ibaraki, Y ., Böhringer, H., & Chon, G. 2013, A&A, 556, A21
work page 2013
- [50]
- [51]
-
[52]
Ota, N., Nguyen-Dang, N. T., Mitsuishi, I., et al. 2023, A&A, 669, A110
work page 2023
-
[53]
Pacaud, F., Pierre, M., Adami, C., et al. 2007, MNRAS, 382, 1289
work page 2007
-
[54]
2022, arXiv e-prints, arXiv:2205.05499
Pierre, M. 2022, arXiv e-prints, arXiv:2205.05499
-
[55]
Popesso, P., Biviano, A., Bulbul, E., et al. 2024, MNRAS, 527, 895
work page 2024
-
[56]
Pratt, G. W. & Arnaud, M. 2002, A&A, 394, 375
work page 2002
-
[57]
Pratt, G. W., Croston, J. H., Arnaud, M., & Böhringer, H. 2009, A&A, 498, 361
work page 2009
-
[58]
Predehl, P., Andritschke, R., Arefiev, V ., et al. 2021, A&A, 647, A1
work page 2021
- [59]
-
[60]
E., Oguri, M., Miyazaki, S., et al
Ramos-Ceja, M. E., Oguri, M., Miyazaki, S., et al. 2022, A&A, 661, A14
work page 2022
-
[61]
Reichert, A., Böhringer, H., Fassbender, R., & Mühlegger, M. 2011, A&A, 535, A4
work page 2011
- [62]
- [63]
- [64]
-
[65]
Schneider, P., van Waerbeke, L., Jain, B., & Kruse, G. 1998, MNRAS, 296, 873
work page 1998
- [66]
-
[67]
Smith, R. K., Brickhouse, N. S., Liedahl, D. A., & Raymond, J. C. 2001, ApJ, 556, L91
work page 2001
-
[68]
Sunyaev, R., Arefiev, V ., Babyshkin, V ., et al. 2021, A&A, 656, A132
work page 2021
- [69]
-
[70]
Vakili, M., Hoekstra, H., Bilicki, M., et al. 2023, A&A, 675, A202
work page 2023
-
[71]
Vikhlinin, A., Burenin, R. A., Ebeling, H., et al. 2009, ApJ, 692, 1033
work page 2009
-
[72]
Vikhlinin, A., Kravtsov, A., Forman, W., et al. 2006, ApJ, 640, 691
work page 2006
-
[73]
Willis, J. P., Oguri, M., Ramos-Ceja, M. E., et al. 2021, MNRAS, 503, 5624
work page 2021
- [74]
-
[75]
Xu, W., Ramos-Ceja, M. E., Pacaud, F., Reiprich, T. H., & Erben, T. 2018, A&A, 619, A162
work page 2018
-
[76]
Xu, W., Ramos-Ceja, M. E., Pacaud, F., Reiprich, T. H., & Erben, T. 2022, A&A, 658, A59
work page 2022
-
[77]
Yang, X., Mo, H. J., van den Bosch, F. C., et al. 2006, MNRAS, 373, 1159
work page 2006
-
[78]
Zhang, Y .-Y ., Finoguenov, A., Böhringer, H., et al. 2008, Astronomy & Astro- physics, 482, 451 1 Institut für Astronomie und Astrophysik Tübingen (IAAT), Univer- sität Tübingen, Sand 1, 72076 Tübingen, Germany e-mail:nguyen@astro.uni-tuebingen.de 2 Department of Physics, Nara Women’s University, Kitauoyanishi- machi, Nara, 630-8506, Japan 3 Argelander-I...
work page 2008
discussion (0)
Sign in with ORCID, Apple, or X to comment. Anyone can read and Pith papers without signing in.