REVIEW 4 major objections 5 minor 1 cited by
PAC in DESI. II. Galaxy-halo connection into the $10^{6}{\rm M}_{\odot}$ frontier
T0 review · 4 major / 5 minor · reviewed 2026-08-04 · deepseek-v4-flash
Pith's one-line read The stellar–halo mass relation turns upward at about 10^10 solar masses, implying that star formation is more efficient in small dark-matter haloes than previously thought.
desk verdict A careful, honest push of SHAM to M_h~1e8, but the claimed SHMR upturn is hinge on an unvalidated scatter prior — worth refereeing, not yet established. read the letter →
The pith
A machine-rendered reading of the paper's core claim, the machinery that carries it, and where it could break.
The reading
What carries the argument
The central machinery is the combination of the PAC measurement and a SHMR-based subhalo abundance matching (SHAM) framework. PAC converts angular cross-correlations between a spectroscopic sample and a deep photometric sample into n_bar2 w_p(r_p), the excess surface density of photometric objects around spectroscopic tracers, which encodes both abundance and clustering information. SHAM then maps observed stellar masses to (sub)halo masses in two high-resolution N-body simulations via log-normal conditional distributions P(M_*|M_h), with constant or mass-dependent scatter. The argument is carried by tabulated halo–halo, halo–subhalo, and subhalo–subhalo projected correlation functions in fi
What would settle it
A direct measurement of the bias of 10^8–10^9 solar-mass haloes — for instance, from the clustering of a spectroscopically complete dwarf sample or from gravitational lensing magnification by dwarf hosts — would show whether the bias is actually flat. If it rises or falls by more than ~10% toward lower masses, the extrapolation that underlies the upturn and the mass bound is wrong.
Extended reading notes
Core claim
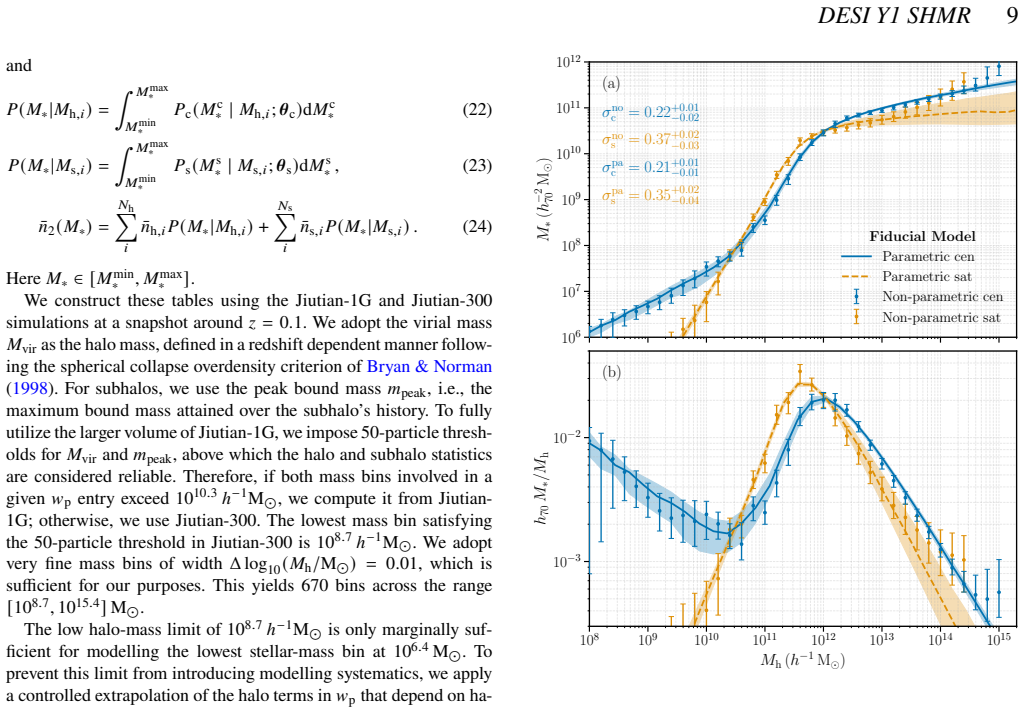
Using the PAC method — angular cross-correlations that recover the three-dimensional excess surface density n_bar2 w_p(r_p) of photometric galaxies around spectroscopic ones — the authors constrain the central galaxy–halo connection down to halo masses of order 10^8 h^-1 M_sun and stellar masses of 10^6.4 M_sun. They find that the mean stellar mass at fixed halo mass, and hence the star-formation efficiency, exhibits a clear upturn at M_h ~ 10^10 h^-1 M_sun: toward lower masses the SHMR becomes shallower and the stellar-to-halo mass ratio rises. This feature persists when the model is extended to allow mass-dependent scatter, reionization-induced suppression of the halo occupation fraction,
Load-bearing premise
The load-bearing assumption is that below the simulation resolution of about 10^8.7 solar masses, the halo abundance follows the extrapolated mass function and the halo bias stays roughly constant; if either deviates by more than about ten percent at 10^8 solar masses, the inferred upturn and the minimum-halo-mass bounds could shift substantially.
Editorial extensions
If this is right
- If the upturn is real, star-formation efficiency in haloes below 10^10 M_sun is higher than standard SHMRs predict, and a second characteristic mass scale around 10^10 M_sun needs to be explained.
- The dominance of central red dwarfs at the faint end supports a scenario of efficient pre-reionization star formation in small haloes followed by UV quenching; this predicts old, metal-poor red dwarfs and may explain the discrepancy between void-affected local surveys and average-universe stellar mass functions.
- The 5-sigma upper bound on the minimum halo mass (10^8.71 h^-1 M_sun) directly constrains dark-matter models that suppress small-scale structure, such as warm dark matter.
- The apparent ~15% internal tension between the derived galaxy stellar mass function and the model-independent PAC I result can be resolved either by a cosmology with lower matter density and sigma_8, or by an error in the assumed effective redshift; this points to a concrete test using BGS clustering.
Reading between the lines
- An implication the authors leave implicit: the upturn's shape is degenerate with the scatter in the SHMR at low masses, so confirming it will require measurements at smaller radii or lensing signals that are more sensitive to halo mass than abundance alone.
- The minimum-halo-mass bound rests on the assumption of flat low-mass bias. A testable extension is to measure dwarf-galaxy clustering around isolated low-mass hosts; if the bias changes by more than ~10% below 10^9 M_sun, the inferred upturn and the lower bound would shift.
- The pre-reionization hypothesis has a direct, observationally accessible signature: the central red dwarfs should be very metal-poor and ancient. Spectroscopy of those specific galaxies, which the authors say they are pursuing, would test the picture independently of the clustering model.
- The cosmology test suggests a way to pin down the effective redshift: splitting the PAC measurements into finer redshift bins, or combining them with galaxy-galaxy lensing, would determine whether the low-Omega_m solution is real or an artefact of the z_eff assumption.
Editorial analysis
A structured set of objections, weighed in public.
Referee Report
Summary. This paper applies the PAC method to DESI Y1 BGS and DECaLS data, measuring 349 nbar2 w_p(r_p) cross-correlation measurements across stellar-mass bins down to M_* = 10^6.4 M_sun. The measurements are modeled with a tabulated SHAM framework built from the Jiutian N-body simulations, and the authors infer separate central and satellite SHMRs down to M_h ~ 10^8 h^-1 M_sun. The headline result is an upturn in the central SHMR below ~10^10 h^-1 M_sun, interpreted as rising star-formation efficiency in dwarf-scale haloes. The paper tests robustness to mass-dependent scatter, reionization-suppressed halo occupation, galaxy assembly bias, and alternative cosmologies, and derives 3-sigma and 5-sigma upper bounds on the minimum halo mass.
Significance. If the upturn is real, it would be a new empirical feature in the z=0 SHMR and would motivate a picture in which pre-reionization star formation is efficient in low-mass haloes, with subsequent UV quenching producing the red central dwarf population. The paper is methodologically ambitious: it makes the PAC measurements public, uses both non-parametric and parametric SHMR models, and explicitly tests several extensions. However, the central interpretation is currently entangled with the constant-scatter prior (Sec. 4.4), the sub-resolution HMF/bias extrapolation (Sec. 4.1 and Appendix A), and an internal nbar2-w_p tension (Sec. 4.6). These are load-bearing for the paper's main claims, so the result is not yet established at the level the abstract asserts, although the measurement itself is a valuable contribution.
major comments (4)
- [Sec. 4.4, Fig. 11] The central claim of a clear upturn below M_h ~ 10^10 h^-1 M_sun is not decoupled from the assumed constant scatter. In the varying-scatter run, the posterior is explicitly bimodal: one branch has smaller scatter, steeper low-mass slope, and larger M_2; the other has larger scatter, shallower slope, and smaller M_2. The text states that this degeneracy is difficult to break with only the nbar2 w_p measurements and that additional observables are required. The fiducial constant-scatter prior selects the first branch, which is precisely the branch exhibiting the pronounced upturn. Since the headline claim concerns the low-mass slope, please provide a quantitative assessment of the evidence for an upturn under the varying-scatter model — for example, the posterior probability of S_low >= 1, or a Bayes factor between the upturn and no-upturn branches — and/or a mock-recovery test showing tha
- [Sec. 4.1, Appendix A] The inference below M_vir ~ 10^8.7 h^-1 M_sun relies on an analytic HMF extrapolation and an assumed approximately constant halo bias. Appendix A validates the constancy of w_p within the resolved mass range, but a 10% normalization offset in the HMF or a 10% monotonic bias trend below the resolution limit would translate directly into the inferred SHMR near M_h ~ 10^8 h^-1 M_sun and into the minimum-halo-mass bounds in Sec. 5.4. Because the paper claims to constrain the SHMR down to ~10^8 h^-1 M_sun and presents 3-sigma/5-sigma lower-mass bounds, please add explicit sensitivity tests: vary the HMF normalization by +/-10% and allow a +/-10% monotonic bias variation over the extrapolated range, and report the resulting shifts in the central SHMR and in M_lim.
- [Secs. 4.6, 5 and Fig. 22] The manuscript states in Sec. 4.6 that within Planck18 cosmology no SHAM model can simultaneously fit both nbar2 and w_p, indicating a degree of internal tension; the derived GSMF is ~15% above DESI PAC I. The paper explores assembly bias and cosmology as possible sources, but does not show whether the low-mass SHMR upturn is robust under the cosmology/redshift that actually removes the tension. Because the SHMR is fitted to nbar2 w_p, a mismatch in the separate components could allow compensating errors that bias the fitted relation. Please quantify how the central SHMR and the upturn change under the WMAP9-at-z=0 model that resolves the tension, or otherwise demonstrate explicitly that the tension is confined to high stellar/halo masses and cannot affect the low-mass slope.
- [Sec. 5.4, Fig. 32] The minimum-halo-mass bounds are derived by fixing the SHMR to the MAP of the no-cutoff model and scanning M_lim, then interpreting Delta chi^2 = 9 and 25 as 3-sigma and 5-sigma for a single degree of freedom. Since imposing a cutoff is a nested modification of an otherwise refittable model, the SHMR should be re-optimized at each M_lim, or the paper should explicitly justify why fixing the SHMR gives a conservative upper bound. As written, the Delta chi^2 values are not profile-likelihood statements and the bounds may be overstated.
minor comments (5)
- [Abstract (first paragraph) vs Sec. 6/Fig. 32] The initial abstract gives minimum-halo-mass upper bounds of 10^8.80 h^-1 M_sun and 10^10.24 h^-1 M_sun, while the full-text abstract, Sec. 6, and Fig. 32 give 10^8.38 h^-1 M_sun and 10^8.71 h^-1 M_sun. Please reconcile this discrepancy; the latter set is the one supported by the figure.
- [Sec. 4.3] The text says the reduced chi^2 values lie in the range 0.5-2, but Appendix B lists many values below 0.5 (e.g., 0.08, 0.12). Please clarify whether the Appendix values are computed differently, e.g., with the full covariance rather than the PCA-truncated covariance, or correct the summary statement.
- [Sec. 4.4, Eq. (29)] The asymptotic low-mass slope is quoted as alpha - beta/(2 ln 10). Expanding f_low in Eq. (29) for x -> -infinity gives f_low ~ -beta x / ln 10, so the f_low contribution to the slope is -beta/ln 10, not -beta/(2 ln 10). Please check the derivation or clarify the definition of beta.
- [Fig. 6] The y-axis label appears garbled ('1 2 chi^2/N'). It should presumably read chi^2/N or similar. Please clean up the label.
- [Sec. 4.2] The specification '43 anchor points in M_* for M_vir in [10^7,10^15.4]' is ambiguous about whether the anchors are defined in linear or logarithmic stellar mass and whether they are in log M_* or log M_h. Please make the anchor-space convention explicit.
Circularity Check
No significant circularity; central SHMR is a fit with an acknowledged scatter–slope degeneracy, not an equation-level reduction.
full rationale
The derivation chain is self-contained: the 349 nbar2 w_p measurements are forward-modelled from an SHMR-based SHAM framework using tabulated correlation functions from the Jiutian simulations, and the SHMR is constrained by fitting, not predicted from an input. The upturn at M_h ~ 10^10 h^-1 M_sun is a property of the best-fit SHMR, and the paper explicitly acknowledges the degeneracy between the low-mass SHMR slope and the scatter (Sec. 4.4, Fig. 11), stating that it is difficult to break using only the nbar2 w_p measurements. This is a stated limitation, not a circular reduction. The HMF and bias extrapolations below the resolved mass limit (Sec. 4.1, Appendix A) are explicit assumptions with validation inside the resolved range; they are inputs to the forward model, not outputs derived from the claimed result. The minimum-halo-mass bounds are nested Delta-chi^2 comparisons with the SHMR held fixed, which is a standard model-comparison procedure rather than renaming a fitted parameter as a prediction. Self-citations (SDSS PAC IV, DESI PAC I, Xu 2025) provide the PAC method, measurements, and orphan treatment, but the present analysis uses new DESI/DECaLS data and independent model variants, so these citations are not load-bearing in the sense of forcing the central conclusion. No equation reduces to itself, and no fitted quantity is relabelled as a prediction. Overall the paper is not circular, though the robustness of the upturn is weaker than the abstract suggests because of the acknowledged scatter degeneracy.
Assumptions & free parameters
free parameters (8)
- Non-parametric central SHMR anchor points (43) =
posterior distributions shown in figures, not tabulated
- Non-parametric satellite SHMR anchor points (34) =
posterior distributions shown in figures, not tabulated
- Scatter σ_c (fiducial) =
0.22^{+0.01}_{-0.02}
- Scatter σ_s (fiducial) =
0.37^{+0.02}_{-0.03}
- Parametric central SHMR parameters =
e.g. log10(M2,c)=9.96^{+0.21}_{-0.32}; see Figure 7
- Parametric satellite SHMR parameters =
see Figure 7
- Covariance shrinkage factor α =
largest value giving a positive-definite covariance (not reported numerically)
- PCA/SVD thresholds and rank =
τ=0.97, τ_gh=0.9, k_max=8
assumptions (7)
- domain assumption Flat ΛCDM with Planck18 parameters (Ω_m=0.3111, σ_8=0.8102, h=0.6766)
- domain assumption SHAM: one-to-one monotonic relation between stellar mass and (sub)halo mass with log-normal scatter (Eq. 25)
- domain assumption Halo bias depends only on halo mass for the tabulated correlation functions (no assembly bias in fiducial tables)
- domain assumption Low-mass halo bias is approximately constant below M_vir=10^8.7 h^-1 M_sun, allowing extrapolation of w_p tables to 10^7 h^-1 M_sun
- domain assumption Jiang et al. (2008) merger timescale model for orphan subhalo treatment
- standard math Flat-sky approximation and Eq. (4) relating the angular cross-correlation to \bar n_2 w_p hold at percent level
- domain assumption Fiducial model assumes every (sub)halo hosts a galaxy (halo occupation fraction = 1)
Cite this review
Pith. "Pith review of PAC in DESI. II. Galaxy-halo connection into the $10^{6}{\rm M}_{\odot}$ frontier." pith.science (2026). https://pith.science/paper/D4ARYF26
@misc{pith2026260329331,
  author       = {Pith},
  title        = {Pith review of: PAC in DESI. II. Galaxy-halo connection into the $10^6\rm M_\odot$ frontier},
  year         = {2026},
  howpublished = {\url{https://pith.science/paper/D4ARYF26}},
  note         = {Machine review of arXiv:2603.29331}
}
abstract
Understanding dwarf galaxy formation is crucial for testing dark matter models and reionization physics. However, constructing stellar-mass complete spectroscopic samples at low masses is increasingly difficult, and the potential existence of a local void complicates studies in an average environment. The Photometric object Around Cosmic webs (PAC) method, which combines deep photometric and spectroscopic data to measure the excess surface density $\bar{n}_2w_{{\rm{p}}}(r_{\rm{p}})$ of photometric objects around spectroscopic tracers, offers a promising path forward. We model 349 $\bar{n}_2w_{{\rm{p}}}(r_{\rm{p}})$ measurements from DESI Y1 BGS and DECaLS, reaching $M_*=10^{6.4}\,{\rm M}_{\odot}$, using a stellar mass-halo mass relation (SHMR)-based subhalo abundance matching framework applied to two high-resolution $N$-body simulations from the Jiutian suite. The resulting SHMR is constrained down to $M_{\rm h}\simeq10^{8.0}\,h^{-1}{\rm M}_{\odot}$, revealing a clear upturn at $\sim10^{10.0}\,h^{-1}{\rm M}_{\odot}$ toward lower masses, indicating rising star-formation efficiency (SFE) in small haloes. This feature persists under extensions of the model that allow mass-dependent scatter, reionization-induced suppression of the halo occupation fraction, galaxy assembly bias, and alternative cosmologies. Combining with the results from Paper I, we find that central red galaxies dominate the low-mass regime. Our results motivate a hypothesis in which SFE is significantly higher than previously thought prior to reionization, enabling relatively massive galaxies to form in small haloes. These systems are subsequently quenched by the UV background, producing the central red dwarf galaxies observed. Finally, we obtain $3\sigma$ and $5\sigma$ upper mass bounds of $10^{8.80}\,h^{-1}{\rm M}_{\odot}$ and $10^{10.24}\,h^{-1}{\rm M}_{\odot}$ on the smallest haloes required to exist.
Figures


Figures from the paper (26 more)



Forward citations
Cited by 1 Pith paper
-
Resolving galaxy formation in the early Universe with BonFIRE and CampFIRE
BonFIRE and CampFIRE simulations show bursty clustered star formation in early galaxies and predict UV luminosity functions matching observations at faint magnitudes with a turnover at M_UV approx -14 but overpredicti...
Reference graph
Works this paper leans on
-
[1]
Abbott T. M. C., et al., 2022, Phys. Rev. D, 105, 023520 Abdul Karim M., et al., 2025, Phys. Rev. D, 112, 083515 Adame A. G., et al., 2025, J. Cosmology Astropart. Phys., 2025, 028 Amon A., Efstathiou G., 2022, MNRAS, 516, 5355 Angulo R. E., White S. D. M., 2010, MNRAS, 405, 143 Angulo R. E., Springel V., White S. D. M., Jenkins A., Baugh C. M., Frenk C. ...
arXiv 2022
-
[3]
AldoPontremoli
D16 × 0.9 Jiutian 300 Jiutian 1G Figure A1.Comparison of the HMFs from Jiutian-1G and Jiutian-300 with thosefromamodifiedDespalietal.(2016)model,rescaledbyafactorof0.9 to achieve the best match to the Jiutian results. Yang X., et al., 2021, ApJ, 909, 143 York D. G., et al., 2000, AJ, 120, 1579 Yuan S., Hadzhiyska B., Bose S., Eisenstein D. J., Guo H., 202...
2016
Reviewed August 4, 2026 · model on record in the stance chip above.
Discussion (0). Sign in to comment.