A GPU-Accelerated JAX Framework for Robust Parametric Component Separation and Clustering Optimization for CMB Polarization Satellites
Pith reviewed 2026-05-10 17:01 UTC · model grok-4.3
The pith
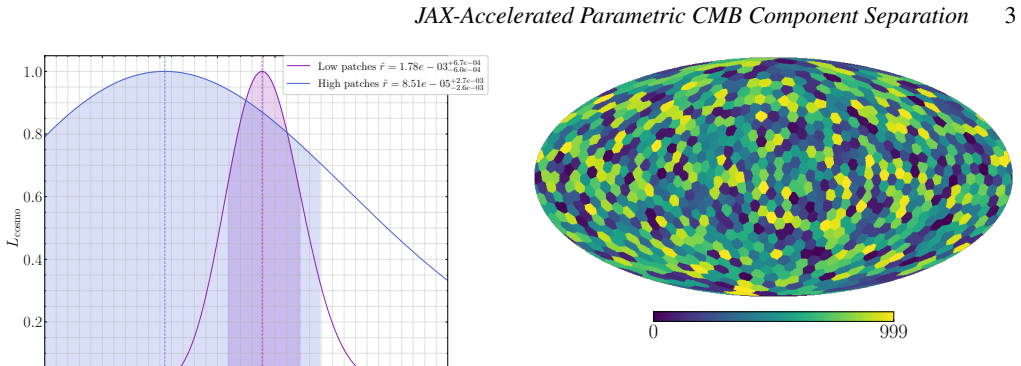
An optimized K-means clustering configuration in a JAX pipeline reduces the 68% upper limit on the tensor-to-scalar ratio by about 30% in LiteBIRD-like CMB simulations.
A machine-rendered reading of the paper's core claim, the machinery that carries it, and where it could break.
Core claim
The central claim is that a JAX-powered pipeline extending parametric component separation methods can efficiently optimize K-means clustering of pixels by shared foreground SEDs, leading to better separation performance and a 30 percent reduction in the 68 percent upper limit on r for LiteBIRD simulations while preserving competitive error bars.
What carries the argument
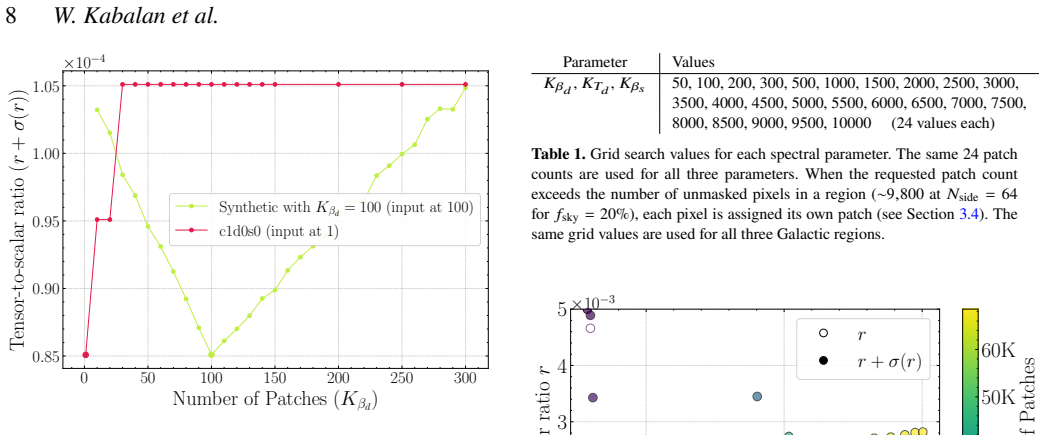
The vectorized, GPU-accelerated evaluation of the spectral likelihood across thousands of K-means pixel subset configurations within the parametric foreground model.
Load-bearing premise
The K-means algorithm on pixel subsets reliably identifies areas with comparable foreground spectral energy distributions without introducing biases or overfitting to the specific noise in the test simulations.
What would settle it
Applying the optimized clustering to an independent suite of LiteBIRD-like simulations generated with different foreground realizations and noise seeds, and checking whether the 30% improvement in the r upper limit is reproduced.
Figures


read the original abstract
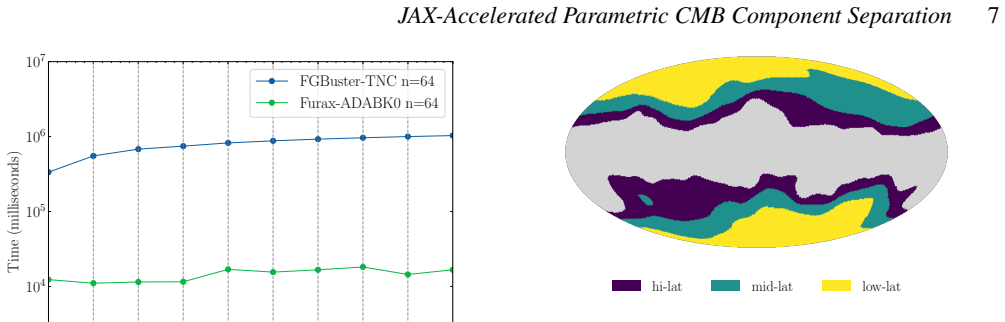
We present a novel, JAX-powered implementation of a parametric component-separation method for CMB polarization data, explicitly designed to handle spatially varying foreground Spectral Energy Distributions (SEDs). The approach models this variation across the sky by grouping sets of pixels that share common foreground spectral parameters, scanning over thousands of such configurations to evaluate the trade-off between model complexity and residual systematic contamination. Built within the FURAX framework -- a JAX-powered environment for CMB data analysis -- our pipeline extends the fgbuster parametric formalism. It enables fully vectorized, GPU-accelerated evaluation of the spectral likelihood, map reconstruction, and diagnostic metrics across tens of thousands of pixel subset configurations, noise realizations, and sky regions. Our implementation achieves up to $\sim 100\times$ speed-up over the scipy TNC optimizer used in fgbuster when running on GPUs, as well as giving more robust results. When applied to LiteBIRD-like simulations with spatially varying foreground SEDs, our optimized K-means configuration reduces the 68% upper limit on the tensor-to-scalar ratio $r$ by $\approx 30\%$ relative to a fixed, previously derived multi-resolution configuration, while maintaining competitive statistical uncertainties.
Editorial analysis
A structured set of objections, weighed in public.
Referee Report
Summary. The manuscript presents a JAX-based, GPU-accelerated extension of the fgbuster parametric component-separation formalism for CMB polarization data. It groups pixels via K-means clustering to model spatially varying foreground SEDs, scans thousands of such groupings to balance model complexity against residuals, and reports up to 100x speed-up relative to scipy TNC. On LiteBIRD-like simulations the optimized configuration yields an approximately 30% tighter 68% upper limit on the tensor-to-scalar ratio r while preserving competitive statistical uncertainties.
Significance. If the reported improvement is robust, the framework would provide a practical, scalable tool for foreground cleaning in next-generation CMB experiments. The vectorized JAX implementation and explicit handling of spatially varying SEDs address a recognized limitation of fixed-resolution parametric methods; the claimed speed-up is a concrete engineering advance that could enable larger parameter scans or Monte-Carlo suites.
major comments (2)
- [abstract and results section describing LiteBIRD simulations] The central result (abstract and §4) selects the K-means configuration by minimizing the r upper limit on the identical LiteBIRD-like simulation suite used for final evaluation. No held-out noise realizations, cross-validation, or independent simulation set is described for the configuration choice; this leaves open the possibility that the 30% gain partly reflects noise-specific alignments rather than improved modeling of SED spatial variation.
- [methods section on K-means clustering] The weakest-assumption paragraph notes that K-means on pixel subsets is assumed to capture regions of similar foreground SEDs without introducing new biases. The manuscript provides no quantitative test (e.g., comparison of recovered SED parameters against input maps or residual power spectra binned by cluster) that would demonstrate the clustering step itself is unbiased at the level required for the r constraint.
minor comments (2)
- [abstract] The abstract states 'more robust results' without defining the metric; a brief clarification in the text would help readers interpret the comparison to fgbuster.
- [methods] Notation for the spectral likelihood and the precise definition of the 'multi-resolution configuration' baseline should be stated explicitly once in the methods to avoid ambiguity when comparing figures.
Simulated Author's Rebuttal
We thank the referee for their positive evaluation of the significance of our work and for the constructive major comments. We address each point below and describe the revisions we will implement to strengthen the manuscript.
read point-by-point responses
-
Referee: [abstract and results section describing LiteBIRD simulations] The central result (abstract and §4) selects the K-means configuration by minimizing the r upper limit on the identical LiteBIRD-like simulation suite used for final evaluation. No held-out noise realizations, cross-validation, or independent simulation set is described for the configuration choice; this leaves open the possibility that the 30% gain partly reflects noise-specific alignments rather than improved modeling of SED spatial variation.
Authors: We acknowledge that the configuration optimization was performed by selecting the K-means grouping that minimizes the r upper limit on the same LiteBIRD-like simulation suite used for the final reported results. While this is a standard approach in simulation studies aimed at identifying the best-performing model within a given framework, we agree that it does not fully exclude the possibility of alignment with specific noise realizations. In the revised manuscript we will add a cross-validation procedure: the available noise realizations will be partitioned into independent training and validation sets; the K-means configuration scan will be performed on the training set, and the selected configuration will then be evaluated on the held-out validation set. We will report the r constraints obtained on both sets to demonstrate that the reported improvement is robust and arises from improved modeling of spatially varying SEDs. revision: yes
-
Referee: [methods section on K-means clustering] The weakest-assumption paragraph notes that K-means on pixel subsets is assumed to capture regions of similar foreground SEDs without introducing new biases. The manuscript provides no quantitative test (e.g., comparison of recovered SED parameters against input maps or residual power spectra binned by cluster) that would demonstrate the clustering step itself is unbiased at the level required for the r constraint.
Authors: We agree that a direct quantitative validation of the clustering assumption would strengthen the paper. The current manuscript states the assumption in the weakest-assumption paragraph but does not include an explicit test against the input maps. In the revised version we will add, in the methods section, a dedicated validation subsection that (i) compares the recovered spectral parameters within each K-means cluster to the known input foreground SED maps and (ii) presents residual power spectra computed separately for pixels belonging to each cluster. These diagnostics will quantify any residual bias introduced by the clustering step at the angular scales relevant to the r constraint. revision: yes
Circularity Check
K-means config optimization on same LiteBIRD simulations forces the reported 30% r-limit improvement by selecting the minimum on evaluation data
specific steps
-
fitted input called prediction
[Abstract]
"When applied to LiteBIRD-like simulations with spatially varying foreground SEDs, our optimized K-means configuration reduces the 68% upper limit on the tensor-to-scalar ratio r by ≈30% relative to a fixed, previously derived multi-resolution configuration, while maintaining competitive statistical uncertainties."
The pipeline scans thousands of K-means configurations on the same LiteBIRD-like simulations (including their specific noise realizations) to evaluate trade-offs and selects the 'optimized' grouping. The 30% reduction is therefore the minimum achieved on the evaluation data itself rather than a prediction on independent data, making the improvement statistically forced by the selection procedure.
full rationale
The central scientific claim is the 30% reduction in the 68% upper limit on r achieved by the 'optimized K-means configuration'. This configuration is obtained by scanning thousands of pixel groupings on the identical LiteBIRD-like simulation suite used to compute the r upper limits. The reported improvement is therefore the minimized value on the data used for selection, with no indication of held-out noise realizations or cross-validation. This matches the fitted-input-called-prediction pattern: the headline result is statistically forced by the optimization procedure rather than representing an independent prediction. The comparison baseline is a fixed prior configuration, but the gain itself reduces to the selection step on the same inputs. No other circular steps (self-citations, ansatzes, or renamings) are present in the provided text; the JAX implementation and speed-up claims are independent engineering results.
Axiom & Free-Parameter Ledger
axioms (1)
- domain assumption Foreground spectral energy distributions can be adequately described by a small number of spatially varying parameters within each clustered pixel group
Reference graph
Works this paper leans on
-
[1]
Alonso D., Sanchez J., Slosar A., 2019, Monthly Notices of the Royal Astro- nomical Society, 484, 4127 BinghamE.,ChenJ.P.,JankowiakM.,ObermeyerF.,PradhanN.,Karaletsos T., Kingma D. P., Tran D., 2019, NumPyro: A Lightweight Library for ProbabilisticProgramminginJAX,https://github.com/pyro-ppl/ numpyro Bradbury J., et al., 2018, JAX: composable transformati...
-
[2]
−gwith the feasible direction into the valid parameter space. For a parameter𝑖currently at a bound: score𝑖 =𝑝 𝑖 × (−𝑔int,𝑖 ),(A2) whereg int is the gradient in the internal parameter space, and𝑝𝑖 ∈ {−1,0,1}is the pivot vector.𝑝 𝑖 =−1indicates the parameter is at the lower bound,𝑝𝑖 =1at the upper bound, and𝑝𝑖 =0indicates it is free. WethenuseJAX’shardware-...
work page 2026
-
[3]
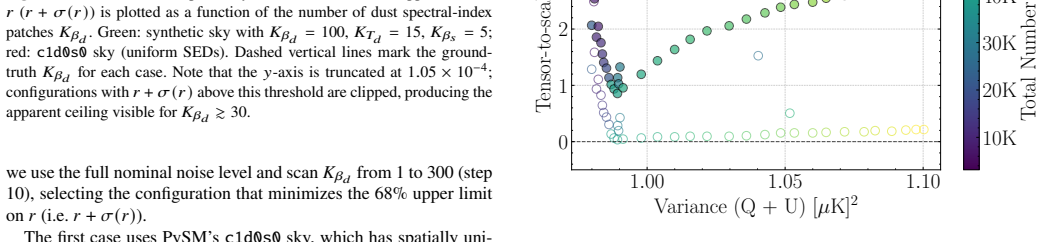
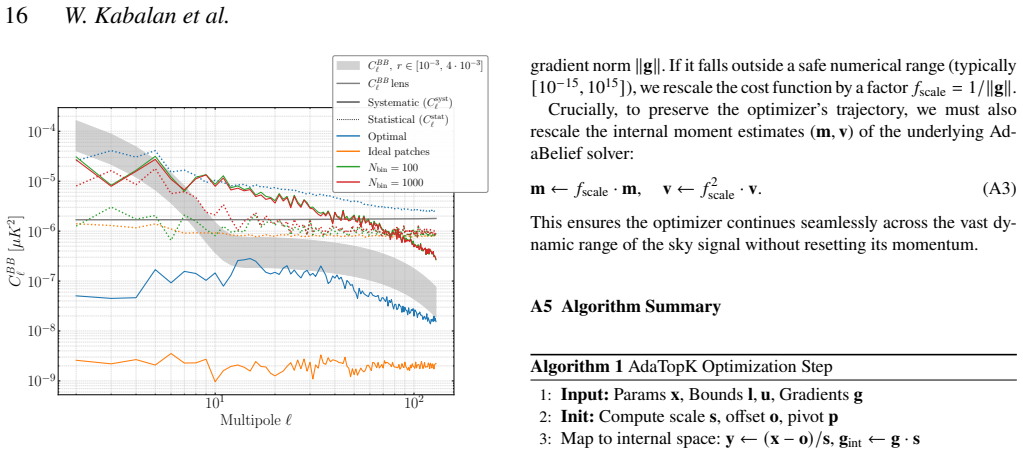
As disconnected clusters are merged, statistical residuals decrease while systematic residuals increase. The gray band shows the pri- mordial𝐶 𝐵𝐵 ℓ for𝑟∈ [10 −3 ,4×10 −3 ]; the solid gray line is the lensing contribution. most strongly pushed towards the feasible region by the gradient) and release them simultaneously (p𝑖 ←0). A3 Impact of the Top-K Fract...
work page 1999
discussion (0)
Sign in with ORCID, Apple, or X to comment. Anyone can read and Pith papers without signing in.