Quantifying Thermal, Photovoltage, and Defect Contributions to Transient Absorption of Ta₃N₅ Photoanodes
Pith reviewed 2026-05-07 04:53 UTC · model grok-4.3
The pith
Independent thermal and photovoltage measurements allow fitting to separate their effects from defect signals in Ta3N5 transient absorption spectra.
A machine-rendered reading of the paper's core claim, the machinery that carries it, and where it could break.
Core claim
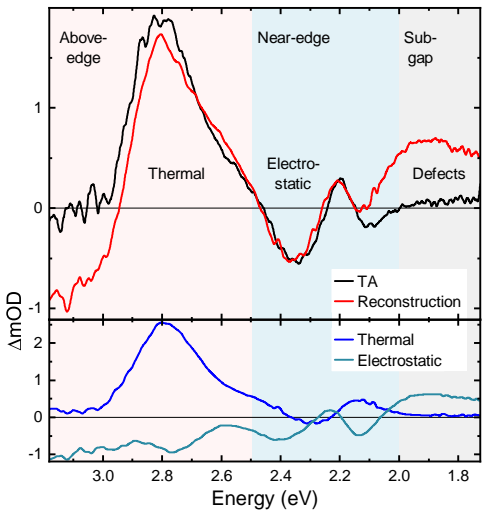
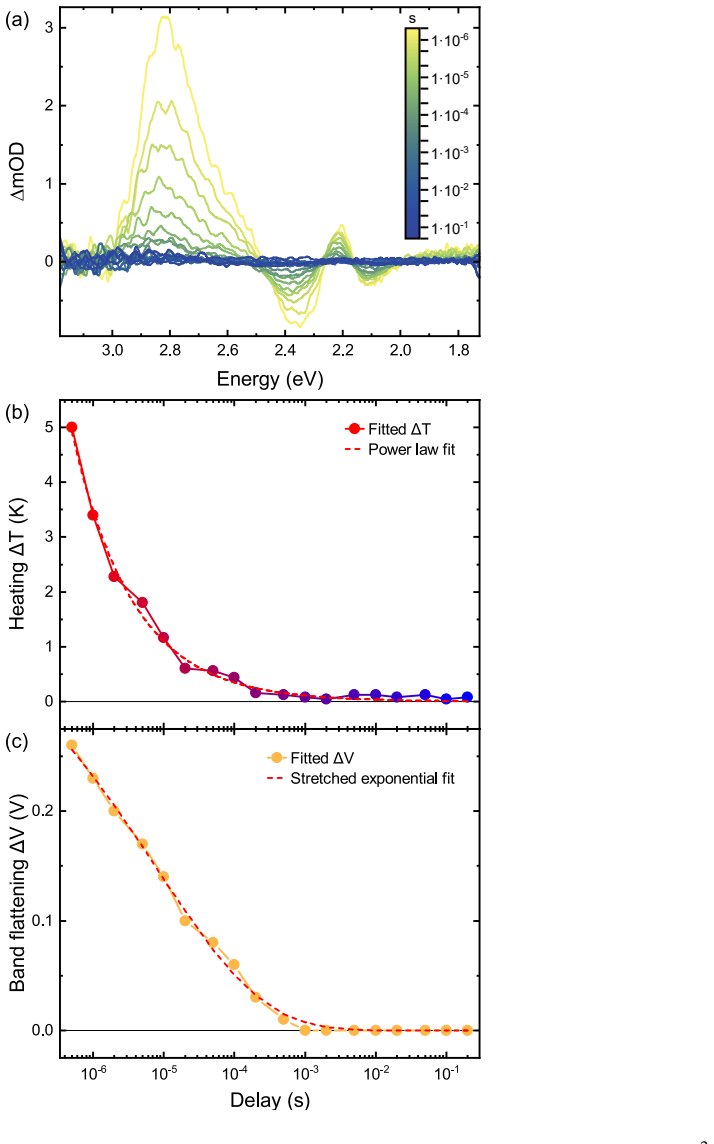
The paper establishes that pump-induced lattice heating produces a photo-induced absorption at 2.80 eV, that near-edge bleach signals result from photovoltage-induced band flattening and relaxation, and that fitting the full spectra with these independent components quantifies the thermal and photovoltage dynamics while the sub-bandgap region indicates redistribution of defect charge states in Ta3N5 photoanodes.
What carries the argument
Fitting of transient absorption spectra using reference spectra for thermal (lattice heating) and electrostatic (band flattening from photovoltage) contributions, with alignment to photoreflectance critical points.
Load-bearing premise
That the critical points from photoreflectance spectroscopy match the main transient absorption features without major contributions from unaccounted processes or variations between samples.
What would settle it
If the linear combination of the independently measured thermal and photovoltage spectra does not reproduce the shape and time evolution of the transient absorption data, leaving systematic residuals, the quantification would be invalid.
Figures
read the original abstract
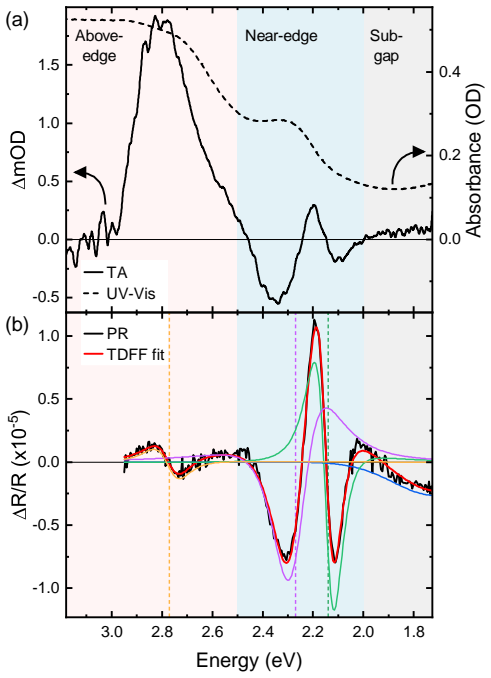
Ta$_{3}$N$_{5}$ is among the most intensively studied photoanode materials for solar-driven water oxidation, yet its performance often remains limited by short carrier lifetimes and defect mediated recombination. Although transient absorption spectroscopy is widely used to probe carrier dynamics in photoelectrodes, spectral assignments are frequently ambiguous due to overlapping contributions. Here, microsecond-to-second transient absorption of Ta$_{3}$N$_{5}$ thin films is combined with complementary optical spectroscopies to disentangle contributions from lattice heating, electrostatics, and defect states. Photoreflectance reveals three critical points in the Ta$_{3}$N$_{5}$ band structure, including two anisotropic near-edge transitions at 2.14 eV and 2.27 eV and a higher-lying transition near 2.80 eV, all closely aligned with dominant transient absorption features. A previously unreported photo-induced absorption at 2.80 eV is attributed to pump-induced lattice heating, while potential-dependent measurements reveal that near-edge bleach features arise from pump-induced band flattening and subsequent surface photovoltage relaxation. Fitting transient absorption spectra with independently measured thermal and electrostatic components enables quantification of both thermal and photovoltage dynamics, while the sub-bandgap response provides insight into the redistribution of defect charge states. Thus, this approach to quantifying thermal, electrostatic, and defect-mediated contributions to microsecond-to-second transient absorption provides broadly applicable insights into photoexcitation and relaxation mechanisms in functional semiconductor photoelectrodes.
Editorial analysis
A structured set of objections, weighed in public.
Referee Report
Summary. The manuscript presents an experimental strategy to disentangle lattice heating, surface photovoltage (electrostatic band flattening), and defect-state contributions in the microsecond-to-second transient absorption (TA) spectra of Ta₃N₅ photoanode thin films. Photoreflectance (PR) identifies three critical points (2.14 eV, 2.27 eV, 2.80 eV) that align with dominant TA features; the 2.80 eV photo-induced absorption is assigned to pump-induced heating, near-edge bleaches to photovoltage relaxation, and sub-bandgap signals to defect charge redistribution. TA spectra at each delay are fitted as linear combinations of an independently measured thermal difference spectrum and an electrostatic spectrum derived from potential-dependent measurements, enabling quantification of thermal and photovoltage dynamics.
Significance. If the spectral decomposition is validated, the work supplies a practical, low-circularity protocol for interpreting overlapping TA signals in photoelectrodes, which is broadly relevant to carrier-dynamics studies in solar-fuel materials. The use of independent PR and potential-dependent data to constrain the fit is a clear methodological strength that reduces parameter ambiguity compared with purely empirical TA modeling. Successful application to Ta₃N₅ could guide defect engineering and thermal-management strategies for water-oxidation photoanodes.
major comments (3)
- [Results (spectral decomposition and fitting)] The central quantification claim rests on the assumption that the TA spectrum at each delay is a linear combination of the independently measured thermal difference spectrum (tied to the 2.80 eV PR feature) and the electrostatic spectrum (from static potential-dependent band flattening) plus a sub-bandgap residual. No quantitative residuals, χ² values, or goodness-of-fit metrics after subtraction are reported in the spectral-fitting section, leaving the additivity assumption untested against possible cross-coupling or unmodeled contributions near the critical points.
- [Experimental methods and results (PR-TA comparison)] The alignment of PR critical points (2.14, 2.27, 2.80 eV) with TA features is presented, yet the manuscript contains no control experiment (e.g., bias conditions that suppress photovoltage while retaining lattice heating) to verify that the near-edge bleach is exclusively electrostatic and that heating does not shift or broaden the 2.14/2.27 eV transitions. Such a test is load-bearing for the attribution of dynamics.
- [Methods (data analysis)] Error propagation, sample-to-sample reproducibility, and fitting uncertainties are not described in the data-analysis or methods sections. Given the low signal levels typical of long-delay TA, these details are required to support the reported thermal and photovoltage time constants.
minor comments (2)
- [Figure captions] Figure captions should explicitly state the scaling procedure and any constraints applied when constructing the linear combination of thermal and electrostatic reference spectra.
- [Results (fitting procedure)] Clarify in the text how the thermal difference spectrum is normalized before fitting and whether any wavelength-dependent weighting is used.
Simulated Author's Rebuttal
We thank the referee for their constructive and detailed review, which highlights both the potential impact of our approach to spectral disentanglement in Ta₃N₅ and areas where additional validation would strengthen the manuscript. We have revised the manuscript to address the concerns on fit metrics, control validation, and uncertainty quantification. Our point-by-point responses follow.
read point-by-point responses
-
Referee: [Results (spectral decomposition and fitting)] The central quantification claim rests on the assumption that the TA spectrum at each delay is a linear combination of the independently measured thermal difference spectrum (tied to the 2.80 eV PR feature) and the electrostatic spectrum (from static potential-dependent band flattening) plus a sub-bandgap residual. No quantitative residuals, χ² values, or goodness-of-fit metrics after subtraction are reported in the spectral-fitting section, leaving the additivity assumption untested against possible cross-coupling or unmodeled contributions near the critical points.
Authors: We agree that explicit goodness-of-fit metrics are needed to rigorously test the linear-combination model. In the revised manuscript we have added χ² values for representative delay times (e.g., 1 µs, 10 µs, 100 µs, 1 ms) together with residual spectra plotted on the same scale as the data. These residuals are unstructured and lie within the experimental noise envelope, with no systematic deviations at the 2.14, 2.27 or 2.80 eV critical points. This quantitative evidence supports the additivity assumption under the conditions of our experiment. revision: yes
-
Referee: [Experimental methods and results (PR-TA comparison)] The alignment of PR critical points (2.14, 2.27, 2.80 eV) with TA features is presented, yet the manuscript contains no control experiment (e.g., bias conditions that suppress photovoltage while retaining lattice heating) to verify that the near-edge bleach is exclusively electrostatic and that heating does not shift or broaden the 2.14/2.27 eV transitions. Such a test is load-bearing for the attribution of dynamics.
Authors: We acknowledge that a bias-dependent TA control isolating heating would be desirable. However, the photoreflectance spectra were acquired without any pump-induced heating or photovoltage and independently locate the three critical points at precisely the energies where the TA features appear. In addition, the potential-dependent reflectance and transmission measurements map the electrostatic band-flattening response in the absence of photoexcitation, reproducing the near-edge bleach line shapes and amplitudes observed in the TA data. We have added a clarifying paragraph in the revised text explaining why these two orthogonal, pump-free datasets already constrain the assignments and why a heating-only bias control would be experimentally challenging without introducing new variables (e.g., altered carrier injection or interface states). We therefore maintain that the existing evidence is sufficient to support the reported attributions. revision: partial
-
Referee: [Methods (data analysis)] Error propagation, sample-to-sample reproducibility, and fitting uncertainties are not described in the data-analysis or methods sections. Given the low signal levels typical of long-delay TA, these details are required to support the reported thermal and photovoltage time constants.
Authors: We agree that these details are essential. The revised Methods section now contains a new subsection on data analysis that (i) describes the linear least-squares fitting procedure and the propagation of uncertainties via the covariance matrix, (ii) reports that all time constants were obtained from at least three independently prepared films with standard deviations quoted, and (iii) gives the typical fitting uncertainties on the thermal and photovoltage amplitudes (typically 5–8 %). These additions directly address the low-signal regime of the long-delay data. revision: yes
Circularity Check
No significant circularity; derivation uses independent external measurements
full rationale
The paper's core quantification proceeds by subtracting independently measured thermal difference spectra (obtained via photoreflectance) and electrostatic spectra (obtained via static potential-dependent band flattening) from the transient absorption data, then attributing the residual to defect states. These input spectra are not fitted to the TA dataset itself, nor are they defined in terms of the TA features or derived via self-citation of prior author work that would close a loop. Critical-point alignment is presented as empirical correspondence rather than a mathematical identity or uniqueness theorem. No self-definitional, fitted-input-renamed-as-prediction, or ansatz-smuggled steps appear in the described chain; the approach remains falsifiable against the separate PR and potentiostatic controls.
Axiom & Free-Parameter Ledger
axioms (1)
- domain assumption Photoreflectance critical points at 2.14 eV, 2.27 eV, and 2.80 eV correspond directly to the dominant transient absorption features.
Reference graph
Works this paper leans on
- [1]
discussion (0)
Sign in with ORCID, Apple, or X to comment. Anyone can read and Pith papers without signing in.