Unsupervised Machine Learning for Detecting Structural Anomalies in European Regional Statistics
Pith reviewed 2026-05-08 19:20 UTC · model grok-4.3
The pith
Unsupervised machine learning identifies a consistent set of European regions with atypical socio-economic profiles.
A machine-rendered reading of the paper's core claim, the machinery that carries it, and where it could break.
Core claim
The paper establishes that a consensus of five unsupervised anomaly detection techniques applied to four key indicators—GDP per capita in PPS, unemployment rate, tertiary educational attainment, and population density—identifies a stable set of NUTS2 regions whose profiles diverge substantially from the European average. These include Brussels, Vienna, Berlin, Prague, Central and Western Slovakia, Northern Hungary, Castilla-La Mancha, Extremadura, and Istanbul. The anomalies reflect genuine structural divergence warranting attention rather than data errors, providing a reproducible and scalable framework for statistical validation.
What carries the argument
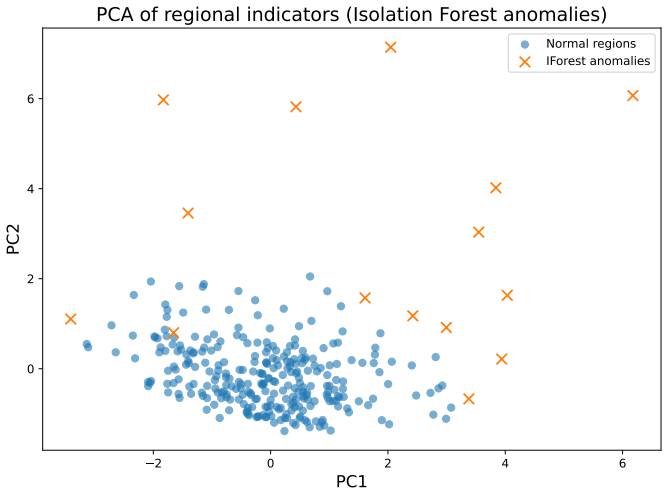
A multi-method consensus anomaly detector requiring agreement from at least three of five techniques (univariate z-scores, Mahalanobis distance, Isolation Forest, Local Outlier Factor, One-Class SVM) on four-dimensional regional indicator vectors.
If this is right
- The method complements traditional univariate checks by capturing unusual multivariate combinations.
- Flagged regions include both highly developed capitals and socio-economically disadvantaged areas.
- The framework is fully reproducible and can integrate into existing European Statistical System workflows.
- It enables early detection of unusual regional configurations for analytical or policy focus.
- Istanbul stands out as differing from typical EU capital profiles.
Where Pith is reading between the lines
- This consensus approach could be tested on time-series data to monitor changes in regional structures over years.
- Similar techniques might assist other statistical agencies in validating cross-national datasets.
- Policy applications could involve prioritizing the flagged regions for cohesion fund allocations.
- Adding more indicators like environmental or health metrics might provide a fuller picture of structural atypicality.
Load-bearing premise
That the four selected indicators adequately represent the structural dimensions of regional profiles and that consensus from three detection methods indicates meaningful divergence rather than sensitivity to choices.
What would settle it
If reapplying the analysis with a new set of indicators produces an entirely non-overlapping list of anomalous regions, this would challenge the robustness of the identified structural anomalies.
Figures
read the original abstract
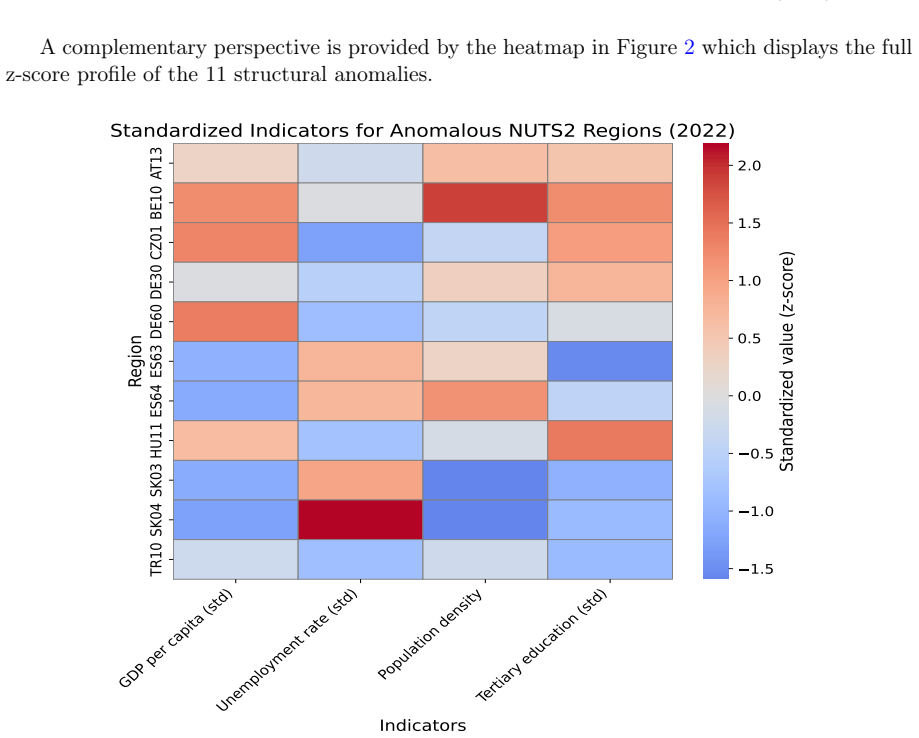
Ensuring the coherence of regional socio-economic statistics is a central task for national statistical institutes. Traditional validation tools, such as range edits, ratio checks, or univariate outlier detection, are effective for identifying extreme values in individual series but are less suited for detecting unusual combinations of indicators in high-dimensional settings. This paper proposes an unsupervised machine learning framework for identifying structurally atypical regional profiles within Europe using publicly available Eurostat data. We construct a cross-sectional dataset of NUTS2 regions (2022) covering four key indicators: GDP per capita in PPS, unemployment rate, tertiary educational attainment, and population density. We apply and compare five anomaly detection techniques, univariate z-scores, Mahalanobis distance, Isolation Forest, Local Outlier Factor, and One-Class SVM, and classify a region as a structural anomaly if it is flagged by at least three of the five methods. The findings show that machine learning methods identify a consistent set of regions whose multivariate profiles diverge substantially from the EU-wide pattern. These include both highly developed metropolitan economies (Brussels, Vienna, Berlin, Prague) and regions with persistent socio-economic disadvantages (Central and Western Slovakia, Northern Hungary, Castilla-La Mancha, Extremadura), as well as Istanbul, whose profile differs markedly from EU capital regions. Importantly, these anomalies do not necessarily signal data quality issues; rather, they reflect meaningful structural divergence that warrants analytical or policy attention. The proposed framework is fully reproducible, scalable, and compatible with existing validation workflows, offering a flexible tool for early detection of unusual regional configurations within the European Statistical System.
Editorial analysis
A structured set of objections, weighed in public.
Referee Report
Summary. The paper proposes an unsupervised machine learning framework to detect structural anomalies in NUTS2 regional socio-economic statistics from Eurostat 2022 data. Using four indicators (GDP per capita in PPS, unemployment rate, tertiary educational attainment, and population density), it applies five anomaly detection methods—univariate z-scores, Mahalanobis distance, Isolation Forest, Local Outlier Factor, and One-Class SVM—and flags a region as anomalous if at least three methods agree. The central claim is that this ensemble identifies a consistent set of regions with multivariate profiles diverging from the EU-wide pattern, including highly developed metropolitan areas (e.g., Brussels, Vienna, Berlin, Prague), socio-economically disadvantaged regions (e.g., Central and Western Slovakia, Northern Hungary, Castilla-La Mancha, Extremadura), and Istanbul; these are interpreted as meaningful structural divergences warranting attention rather than data quality issues. The framework is presented as reproducible, scalable, and integrable with existing validation workflows.
Significance. If the central claim holds, the work supplies a practical, fully reproducible tool for national statistical institutes to flag unusual multivariate regional configurations beyond traditional univariate checks. The explicit enumeration of detected regions, their dual interpretation as both high-development and disadvantaged outliers, and the emphasis on compatibility with the European Statistical System represent concrete strengths. The use of public data and a multi-method consensus approach enhances transparency and reduces reliance on any single detector.
major comments (1)
- [Methods (anomaly detection framework and consensus classification)] The claim that the methods 'identify a consistent set' of regions whose profiles 'diverge substantially' rests on two untested modeling choices: the specific four-indicator set and the ≥3/5 consensus rule. No ablation on alternative indicator combinations, no variation of the consensus threshold, and no external validation against known regional typologies are reported. Because the ensemble mixes a univariate z-score detector (which ignores correlations) with multivariate methods, agreement can be driven by marginal extremes in one or two variables rather than joint structure; this directly undermines the robustness of the 'consistent set' finding.
minor comments (2)
- [Abstract] The abstract states that the framework is 'fully reproducible' yet provides no information on preprocessing (e.g., scaling, missing-value handling), hyperparameter settings for Isolation Forest/LOF/One-Class SVM, or the exact distance metric for Mahalanobis distance; these details are needed to support the reproducibility claim.
- [Results] The paper would benefit from a table or figure explicitly listing the regions flagged by each individual method versus the consensus set, to allow readers to assess the degree of overlap driving the 'consistent set' result.
Simulated Author's Rebuttal
We thank the referee for the constructive feedback on the robustness of our anomaly detection framework. We address the major comment point by point below, acknowledging limitations in the original submission and outlining revisions to strengthen the analysis.
read point-by-point responses
-
Referee: The claim that the methods 'identify a consistent set' of regions whose profiles 'diverge substantially' rests on two untested modeling choices: the specific four-indicator set and the ≥3/5 consensus rule.
Authors: The four indicators were selected because they align with core Eurostat structural indicators for regional socio-economic analysis, covering economic output, labor market, human capital, and spatial concentration. The ≥3/5 consensus threshold was adopted as a standard ensemble majority rule to promote reliability across heterogeneous detectors. We acknowledge that these choices were not subjected to ablation in the submitted manuscript. In revision, we will add sensitivity analyses varying both the indicator combinations and the consensus threshold (e.g., 2/5 and 4/5) to assess stability of the detected set. revision: yes
-
Referee: No ablation on alternative indicator combinations, no variation of the consensus threshold, and no external validation against known regional typologies are reported.
Authors: We will include the ablation studies on indicator sets and threshold variation in the revised version. Regarding external validation, the unsupervised setting precludes labeled ground truth; however, we will add a qualitative mapping of flagged regions against established EU typologies (e.g., urban-rural classification and cohesion policy target regions) to evaluate alignment with known structural categories. revision: partial
-
Referee: Because the ensemble mixes a univariate z-score detector (which ignores correlations) with multivariate methods, agreement can be driven by marginal extremes in one or two variables rather than joint structure; this directly undermines the robustness of the 'consistent set' finding.
Authors: We agree that the univariate z-score component does not capture correlations. Nevertheless, the consensus requirement means a region must be flagged by at least three methods, typically including multiple multivariate detectors. The revision will add a per-region breakdown of contributing methods and variables, plus results from an alternative ensemble that excludes the z-score detector, to demonstrate that the core anomalous set is not driven solely by marginal univariate extremes. revision: yes
Circularity Check
No circularity: standard anomaly detectors applied to external Eurostat data with explicit consensus rule
full rationale
The paper constructs a dataset from public Eurostat NUTS2 observations on four indicators and applies five pre-existing anomaly detection algorithms (z-scores, Mahalanobis distance, Isolation Forest, LOF, One-Class SVM). A region is labeled anomalous by the explicit, non-derived rule of agreement by at least three methods. No equations, fitted parameters, or self-citations reduce the output labels to the inputs by construction; the methods are independent of the target result and the data are external. This is a direct application of established techniques rather than a self-referential derivation.
Axiom & Free-Parameter Ledger
free parameters (1)
- Consensus threshold =
3 out of 5
axioms (2)
- domain assumption The four chosen indicators (GDP per capita in PPS, unemployment rate, tertiary educational attainment, population density) sufficiently represent the structural socio-economic profile of NUTS2 regions.
- domain assumption Eurostat 2022 NUTS2 data are accurate, comparable across regions, and free of systematic measurement artifacts that would produce spurious multivariate outliers.
Reference graph
Works this paper leans on
-
[1]
Alessandro Balducci and Fabio Gervasoni. Detecting structural breaks and spatial anomalies in regional development: A clustering perspective.Regional Science Policy and Practice, 10(4):377–394, 2018
work page 2018
-
[2]
Breunig, Hans-Peter Kriegel, Raymond T
Markus M. Breunig, Hans-Peter Kriegel, Raymond T. Ng, and Jörg Sander. Lof: Identi- fying density-based local outliers. InProceedings of the 2000 ACM SIGMOD International Conference on Management of Data, pages 93–104, 2000
work page 2000
-
[3]
ESS handbook on statistical data editing, 2022
European Statistical System. ESS handbook on statistical data editing, 2022
work page 2022
-
[4]
Fosca Giannotti, Gianni Barlacchi, and Luca Pappalardo. Uncovering hidden patterns in regional development using unsupervised learning.Environment and Planning B: Urban Analytics and City Science, 49(7):1970–1988, 2022
work page 1970
-
[5]
George James, Kate McLaren, and Tan Yigitcanlar. Spatial anomaly detection for labour market dynamics: A machine learning approach.Regional Studies, 55(9):1583–1597, 2021
work page 2021
-
[6]
Peter Kemper, Steven Brakman, and Harry Garretsen. Identifying resilient and vulnerable regionsthroughunsupervisedanomalydetection.Papers in Regional Science, 102(1):89–113, 2023
work page 2023
-
[7]
Fei Tony Liu, Kai Ming Ting, and Zhi-Hua Zhou. Isolation forest. In2008 Eighth IEEE International Conference on Data Mining, pages 413–422. IEEE, 2008
work page 2008
-
[8]
Prasanta Chandra Mahalanobis. On the generalised distance in statistics.Proceedings of the National Institute of Sciences of India, 2:49–55, 1936
work page 1936
-
[9]
Ramaswamy, Rajeev Rastogi, and Kyuseok Shim
S. Ramaswamy, Rajeev Rastogi, and Kyuseok Shim. Efficient algorithms for mining outliers from large data sets. InProceedings of the 2000 ACM SIGMOD International Conference on Management of Data, pages 427–438, 2000. 13
work page 2000
-
[10]
Katharina Reiss and Annegret Haase. Regional differentiation in europe: A multivariate analysis of socio-economic structures.European Planning Studies, 28(10):1983–2005, 2020
work page 1983
-
[11]
Rousseeuw and Katrien Van Driessen
Peter J. Rousseeuw and Katrien Van Driessen. A fast algorithm for the minimum covariance determinant estimator.Technometrics, 41(3):212–223, 1999
work page 1999
-
[12]
Bernhard Schölkopf, John Platt, John Shawe-Taylor, Alex J. Smola, and Robert C. Williamson. Estimating the support of a high-dimensional distribution.Neural Compu- tation, 13(7):1443–1471, 2001
work page 2001
-
[13]
Tukey.Exploratory Data Analysis
John W. Tukey.Exploratory Data Analysis. Addison–Wesley, Reading, MA, 1977
work page 1977
-
[14]
Machine learning for official statistics, 2021
UNECE. Machine learning for official statistics, 2021. Appendix A. Supplementary analyses and additional results A1. Indicator values for structural anomalies Table 3 reports the four Eurostat indicators used in the study— GDP per capita in PPS (EU27=100), unemployment rate (15–74), tertiary educational attainment (25–64), and pop- ulation density—for all...
work page 2021
discussion (0)
Sign in with ORCID, Apple, or X to comment. Anyone can read and Pith papers without signing in.