Multifractal Complexity of the Chandler Wobble and Its Anomalous Disappearance (2015--2020): A MFDFA Study
Pith reviewed 2026-06-29 09:28 UTC · model grok-4.3
The pith
Sliding-window multifractal analysis shows the Chandler wobble entered a new dynamical regime years before its 2015-2020 near-disappearance.
A machine-rendered reading of the paper's core claim, the machinery that carries it, and where it could break.
Core claim
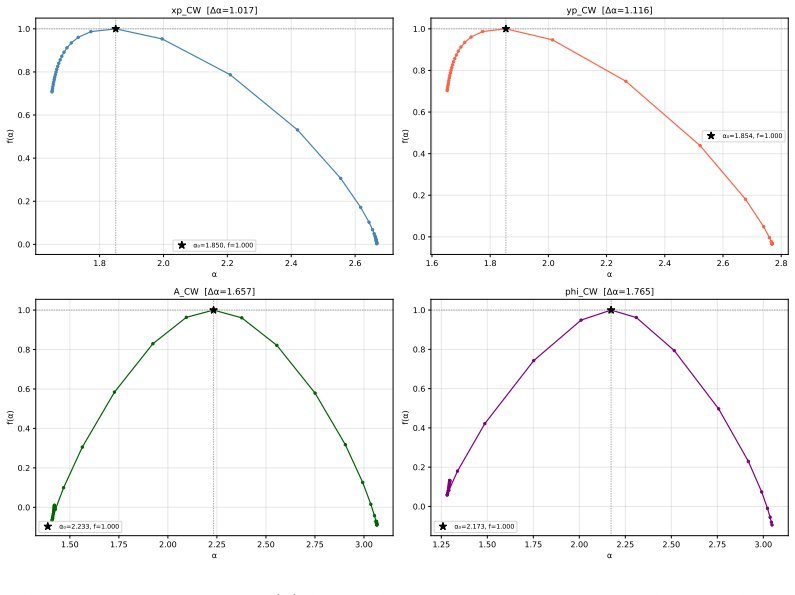
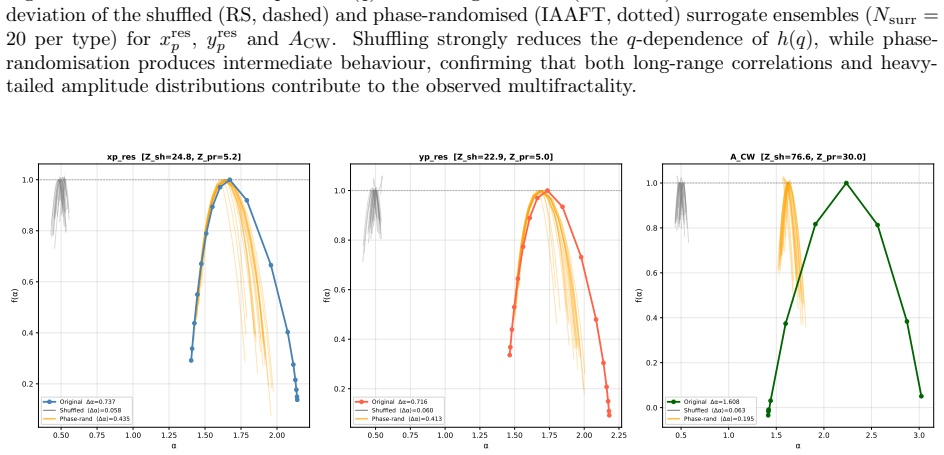
Global application of MFDFA to the IERS EOP C04 series reveals strongly q-dependent Hurst exponents and wide singularity spectra for both residual polar motion and CW amplitude, with surrogate tests confirming the roles of long-range correlations and non-Gaussian statistics. Sliding-window MFDFA uncovers a collapse in persistence and spectral width in the geometric polar motion signal well before and during the 2015--2020 minimum, while amplitude and phase series retain stable multifractal properties, evidencing a dynamical decoupling.
What carries the argument
Sliding-window Multifractal Detrended Fluctuation Analysis (MFDFA) on polar motion time series, which tracks temporal evolution of scaling properties and singularity spectra to identify regime shifts.
Load-bearing premise
The observed collapse in long-range persistence and multifractal spectral width during the sliding windows reflects an actual change in Earth rotation dynamics and is not an artifact of the chosen analysis parameters such as window length or detrending order.
What would settle it
Applying the identical sliding-window MFDFA procedure to the same data but with substantially different window lengths or polynomial orders and obtaining no corresponding collapse would falsify the interpretation of a dynamical regime change.
Figures


read the original abstract
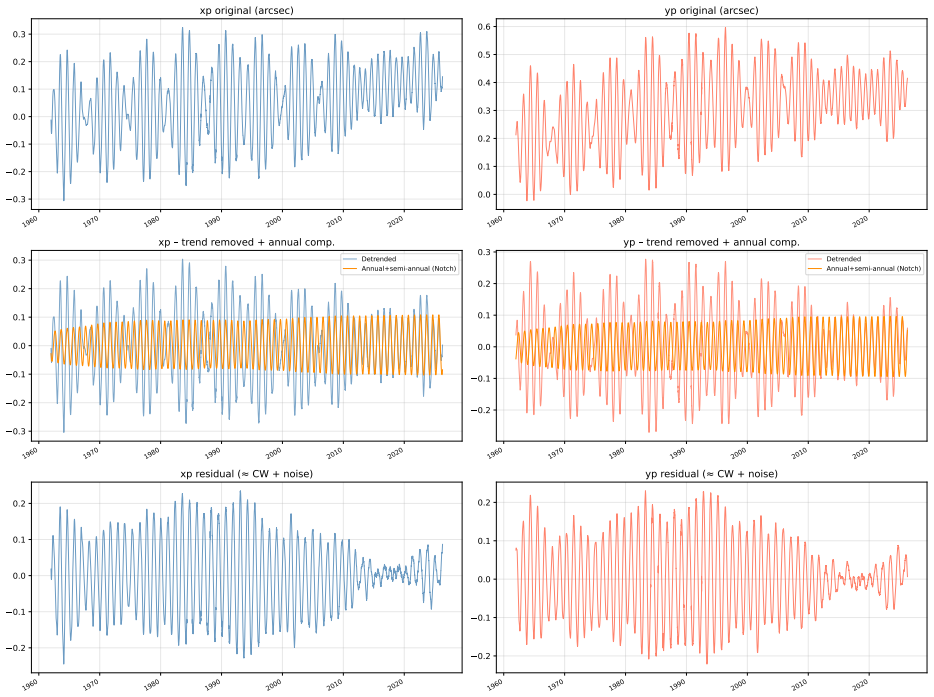
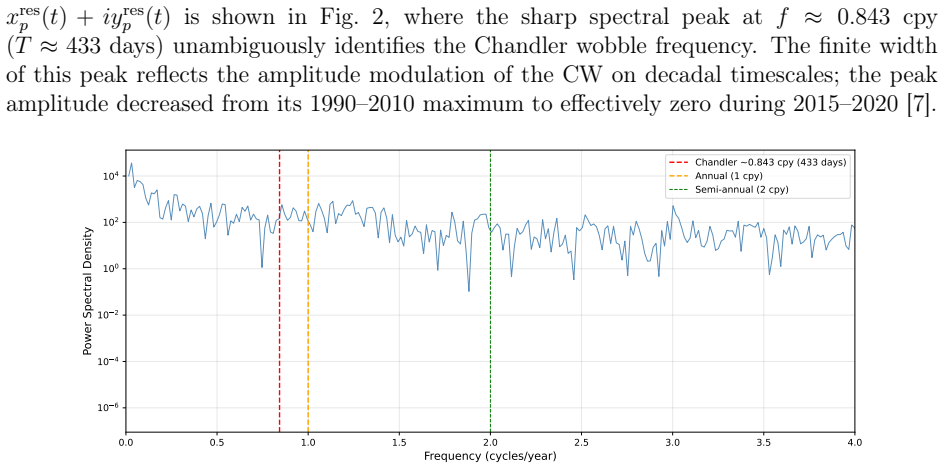
The Chandler wobble (CW) -- the $\sim$433-day free nutation of Earth's rotation pole -- experienced an anomalous near-disappearance between 2015 and 2020, followed by a re-excitation with an approximately $180^{\circ}$ phase reversal. Using Multifractal Detrended Fluctuation Analysis (MFDFA) applied to more than six decades (1962--2024) of daily IERS EOP C04 polar motion data, this study provides the first multifractal characterisation of the CW and its recent anomaly. Global MFDFA shows that the residual polar motion components and the CW amplitude are genuine multifractal processes with strongly $q$-dependent generalised Hurst exponents and broad singularity spectra. Surrogate-data tests with shuffled and phase-randomised ensembles demonstrate that this multifractality originates from the combined action of long-range temporal correlations and heavy-tailed excitation statistics. A sliding-window analysis reveals a pronounced collapse in long-range persistence and multifractal spectral width of the geometric polar motion signal several years before and during the 2015--2020 amplitude minimum, indicating a genuine dynamical regime change rather than a simple suppression of oscillation amplitude. In contrast, the amplitude- and phase-related variables retain broad multifractal spectra and stable scaling exponents across all epochs, revealing a dynamical decoupling between the geometry of the CW and the multiscale structure of its amplitude and phase fluctuations. These findings highlight the CW amplitude as an exceptionally multifractal integrator of geophysical excitation and suggest that multifractal metrics may provide early-warning indicators of major transitions in Earth rotation dynamics.
Editorial analysis
A structured set of objections, weighed in public.
Referee Report
Summary. The paper applies multifractal detrended fluctuation analysis (MFDFA) to daily IERS EOP C04 polar motion data (1962–2024) to characterize the Chandler wobble (CW). Global MFDFA on residual components and CW amplitude shows genuine multifractality arising from long-range correlations and heavy-tailed statistics, confirmed by shuffled and phase-randomized surrogates. A sliding-window analysis reports a collapse in generalized Hurst exponents and singularity spectrum width several years before and during the 2015–2020 amplitude minimum, interpreted as a dynamical regime change decoupled from amplitude/phase fluctuations, which retain stable multifractal properties.
Significance. If the reported collapse is robust to parameter variation, the work supplies the first multifractal description of the CW anomaly and proposes multifractal metrics as potential early-warning indicators for Earth-rotation transitions. The surrogate-based attribution of multifractality sources and the geometric decoupling finding are concrete strengths that could influence statistical-mechanics approaches to geophysical time series.
major comments (2)
- [sliding-window MFDFA analysis (Results)] The central claim of a genuine dynamical regime change (abstract and sliding-window results) rests on the observed collapse in long-range persistence and Δα. However, the manuscript provides no quantitative details on MFDFA parameter choices (q-range, segment-size range, polynomial order m) or on whether these were held fixed across windows; the skeptic concern that the collapse is an artifact of specific window length/overlap or detrending order is therefore unaddressed and directly load-bearing for the regime-change interpretation.
- [Methods and Results (surrogate tests)] Surrogate-data tests are described globally but the abstract and methods give no indication that the same surrogate ensembles were regenerated inside each sliding window or that error bars on H(q) and Δα were obtained from intra-window variability. Without these, the statistical significance of the reported collapse relative to the 2015–2020 minimum cannot be evaluated.
minor comments (2)
- [Results] Notation for the singularity spectrum width (Δα) and the precise definition of the geometric polar-motion signal should be stated explicitly in the first paragraph of the Results section.
- [Methods] The IERS C04 preprocessing steps (gap handling, removal of annual/semiannual terms) are mentioned only in passing; a short dedicated paragraph or table listing the exact steps would improve reproducibility.
Simulated Author's Rebuttal
We thank the referee for the thorough review and valuable comments on our manuscript. We address each major comment below and will revise the manuscript to incorporate the suggested clarifications and additional analyses.
read point-by-point responses
-
Referee: [sliding-window MFDFA analysis (Results)] The central claim of a genuine dynamical regime change (abstract and sliding-window results) rests on the observed collapse in long-range persistence and Δα. However, the manuscript provides no quantitative details on MFDFA parameter choices (q-range, segment-size range, polynomial order m) or on whether these were held fixed across windows; the skeptic concern that the collapse is an artifact of specific window length/overlap or detrending order is therefore unaddressed and directly load-bearing for the regime-change interpretation.
Authors: We agree that the lack of explicit MFDFA parameter details is a shortcoming that needs addressing. The manuscript did not include these specifics. In the revised manuscript, we will add detailed information on the parameter choices: q ranging from -5 to 5, segment sizes between 20 and 200 points, and polynomial order m=2, all held fixed across windows. We will also perform and report sensitivity analyses for different window lengths (e.g., 4, 6, and 8 years) and overlaps to demonstrate that the collapse in persistence and spectral width is robust and not an artifact. revision: yes
-
Referee: [Methods and Results (surrogate tests)] Surrogate-data tests are described globally but the abstract and methods give no indication that the same surrogate ensembles were regenerated inside each sliding window or that error bars on H(q) and Δα were obtained from intra-window variability. Without these, the statistical significance of the reported collapse relative to the 2015–2020 minimum cannot be evaluated.
Authors: The surrogate tests were performed globally to identify the sources of multifractality. We did not regenerate them within sliding windows or provide intra-window error bars. This is a valid point regarding the evaluation of significance for the temporal evolution. We will revise the manuscript to include surrogate analysis within selected windows and report variability measures, allowing assessment of the collapse's statistical significance. revision: yes
Circularity Check
No circularity: empirical MFDFA on external data with standard surrogates
full rationale
The paper applies the established MFDFA algorithm and sliding-window analysis to public IERS EOP C04 time series, supplemented by shuffled and phase-randomised surrogate ensembles. No equations, parameters, or predictions are defined in terms of the target regime-change metrics; the reported collapse in H(q) and Δα is an observed data feature, not a quantity forced by construction or by self-citation chains. The method is externally validated in the literature and the analysis remains falsifiable against alternative window/segment choices.
Axiom & Free-Parameter Ledger
free parameters (1)
- MFDFA parameters (q-range, segment sizes, polynomial order)
axioms (2)
- domain assumption Surrogate tests (shuffled and phase-randomised) correctly isolate the sources of multifractality in the polar motion series
- domain assumption Sliding-window MFDFA metrics detect genuine dynamical regime changes rather than windowing or parameter artifacts
Reference graph
Works this paper leans on
-
[1]
S. Adhikari, E. R. Ivins, Climate-driven polar motion: 2003–2015, Science Advances 2 (4 2016).doi:10.1126/sciadv.1501693
-
[2]
Lambeck, The Earth’s Variable Rotation: Geophysical Causes and Consequences, Cambridge Monographs on Mechanics, Cambridge University Press, 1980
K. Lambeck, The Earth’s Variable Rotation: Geophysical Causes and Consequences, Cambridge Monographs on Mechanics, Cambridge University Press, 1980. 26
1980
-
[3]
R. S. Gross, The excitation of the chandler wobble, Geophysical Research Letters 27 (2000) 2329–2332.doi:10.1029/2000GL011450
-
[4]
R. S. Gross, I. Fukumori, D. Menemenlis, Atmospheric and oceanic excitation of the earth’s wobbles during 1980–2000, Journal of Geophysical Research: Solid Earth 108 (8 2003).doi:10.1029/2002jb002143
-
[5]
Aoyama, I
Y. Aoyama, I. Naito, Atmospheric excitation of the chandler wobble, 1983–1998, Journal of Geophysical Research: Solid Earth 106 (2001) 8941–8954.doi:10.1029/ 2000JB900460
1983
-
[6]
Q. Shi, Y. Zhou, J. Chen, X. Xu, Recent disappearing and re-excited earth’s chan- dler wobble: contributions from grace/gfo hydrological and cryospheric mass changes, Journal of Geodesy 99 (12 2025).doi:10.1007/s00190-025-02021-w
-
[7]
Zotov, C
L. Zotov, C. Bizouard, N. Sidorenkov, Chandler wobble and lod anomalies in 2010-2020s, World Scientific Pub Co Pte Ltd, 2023, pp. 153–155.doi:10.1142/ 9789811275449_0052
2010
-
[8]
T. Jeon, K. W. Seo, K. Youm, J. Eom, D. Lee, J. Chen, C. R. Wilson, Diminished chandler wobble after 2015: Link to mass anomalies in 2011, Geophysical Research Letters 52 (9 2025).doi:10.1029/2025GL116191
-
[9]
PROBLEMS OF GEOCOSMOS
L. Zotov, N. Sidorenkov, C. Bizouard, Chandler wobble changes in 2020s, in: 15th International Conference and School “PROBLEMS OF GEOCOSMOS”, St. Petersburg, 2024, iD: GC2024-SG010
2024
-
[10]
R. S. Gross, Earth rotation variations — long period, in: G. Schubert (Ed.), Treatise on Geophysics, 2nd Edition, Vol. 3 of Geodesy, Elsevier, Oxford, 2015, pp. 215–261. doi:10.1016/B978-0-444-53802-4.00017-1
-
[11]
C.-K. Peng, S. V. Buldyrev, S. Havlin, M. Simons, H. E. Stanley, A. L. Goldberger, Mosaic organization of dna nucleotides, Physical Review E 49 (1994) 1685–1689.doi: 10.1103/PhysRevE.49.1685
-
[12]
J. W. Kantelhardt, S. A. Zschiegner, E. Koscielny-Bunde, S. Havlin, A. Bunde, H. E. Stanley, Multifractal detrended ductuation analysis of nonstationary time series, Tech. rep. (2002). URLwww.elsevier.com/locate/physa
2002
-
[13]
L. Telesca, V. Lapenna, M. Macchiato, Mono- and multi-fractal investigation of scaling properties in temporal patterns of seismic sequences, Chaos, Solitons and Fractals 19 (2004) 1–15.doi:10.1016/S0960-0779(03)00188-7
-
[14]
Schreiber, A
T. Schreiber, A. Schmitz, Surrogate time series, Tech. rep. (2000). 27
2000
-
[15]
J. W. Kantelhardt, E. Koscielny-Bunde, H. A. Rego, S. Havlin, A. Bunde, Detecting long-range correlations with detrended ductuation analysis, Tech. rep. (2001). URLwww.elsevier.com/locate/physa
2001
-
[16]
N. Mendez, M. C. M. M. P. Beccar-Varela, O. Tweneboah, S. Jaroszewicz, Mf-toolkit: A high-performance python library for multifractal analysis with automated crossover detection, source identification and application to gravitational waves data (2026). arXiv:2604.16257. URLhttps://arxiv.org/abs/2604.16257
work page internal anchor Pith review Pith/arXiv arXiv 2026
-
[17]
N. Mendez, S. Jaroszewicz, O. K. Tweneboah, M. P. Beccar-Varela, M. C. Mariani, Characterising the interplay of dynamics and artefacts: a multifractal analysis of histor- ical humpback whale recordings, Bioacoustics 35 (2) (2026) 220–239.arXiv:https:// doi.org/10.1080/09524622.2026.2629322,doi:10.1080/09524622.2026.2629322. URLhttps://doi.org/10.1080/0952...
-
[18]
S. Jaroszewicz, N. Mendez, M. P. Beccar-Varela, M. C. Mariani, Resolving spurious multifractality in discrete systems: A finite-size scaling protocol for mfdfa in the 2d ising model (2026).arXiv:2603.04609. URLhttps://arxiv.org/abs/2603.04609 28
discussion (0)
Sign in with ORCID, Apple, or X to comment. Anyone can read and Pith papers without signing in.