Spaceborne SAR Change Detection and Coherence Analysis for Maritime Port Monitoring
Pith reviewed 2026-06-26 19:29 UTC · model grok-4.3
The pith
SAR amplitude differences and coherence maps can detect structural and surface variations in dense maritime ports.
A machine-rendered reading of the paper's core claim, the machinery that carries it, and where it could break.
Core claim
The paper shows that amplitude-based change mapping and multitemporal coherence estimation, after radiometric scaling, speckle reduction, and resolution assessment via Fourier analysis, produce interpretable indicators of structural and surface-condition variations across vessels, storage tanks, quay structures, industrial yards, and water-land transitions at Tianjin Port.
What carries the argument
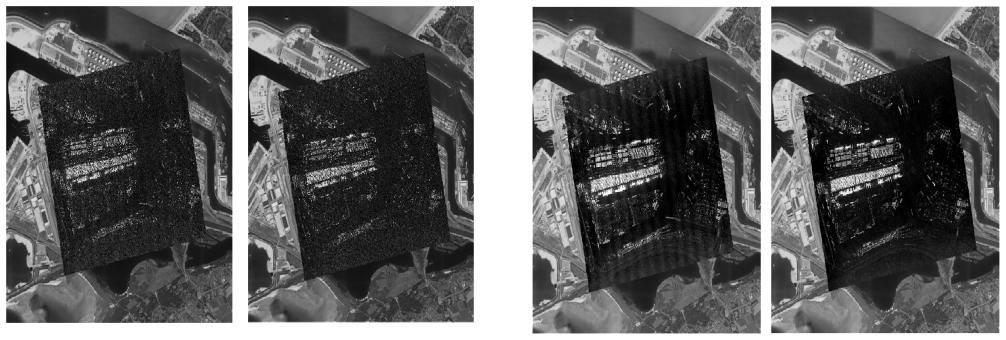
Multitemporal amplitude difference filtering combined with coherence maps computed over several spatial averaging windows, following histogram-guided display and 2D Fourier resolution estimation.
If this is right
- Port monitoring can proceed without dependence on daylight or clear weather using repeated SAR passes.
- Coherence computed at multiple window sizes trades spatial detail against noise reduction in cluttered scenes.
- Geocoded amplitude and coherence products can be overlaid on maps for direct inspection of specific port features.
- Histogram scaling and layover-shadow inspection aid qualitative reading of complex SAR magnitude data.
Where Pith is reading between the lines
- The same products could be tested on other high-traffic ports or shipyards to check transferability.
- Pairing the maps with automatic vessel detection algorithms might link observed changes to specific ship movements.
- Longer time series could turn the method toward tracking gradual infrastructure wear rather than abrupt events.
Load-bearing premise
That visual inspection of the processed amplitude and coherence images alone is enough to establish their practical utility for operational port monitoring.
What would settle it
A direct comparison of the SAR-derived change locations against independent port logs or ground photographs recorded on the same dates would show whether the highlighted features correspond to real modifications.
Figures


read the original abstract
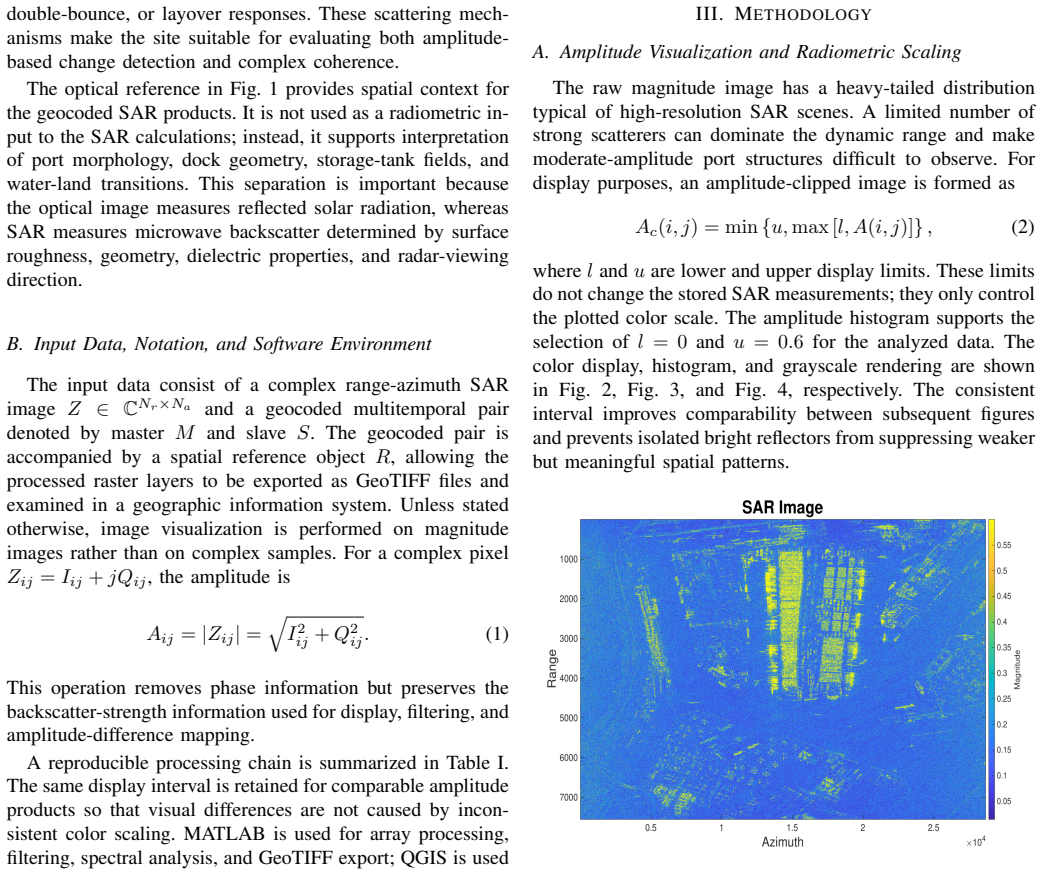
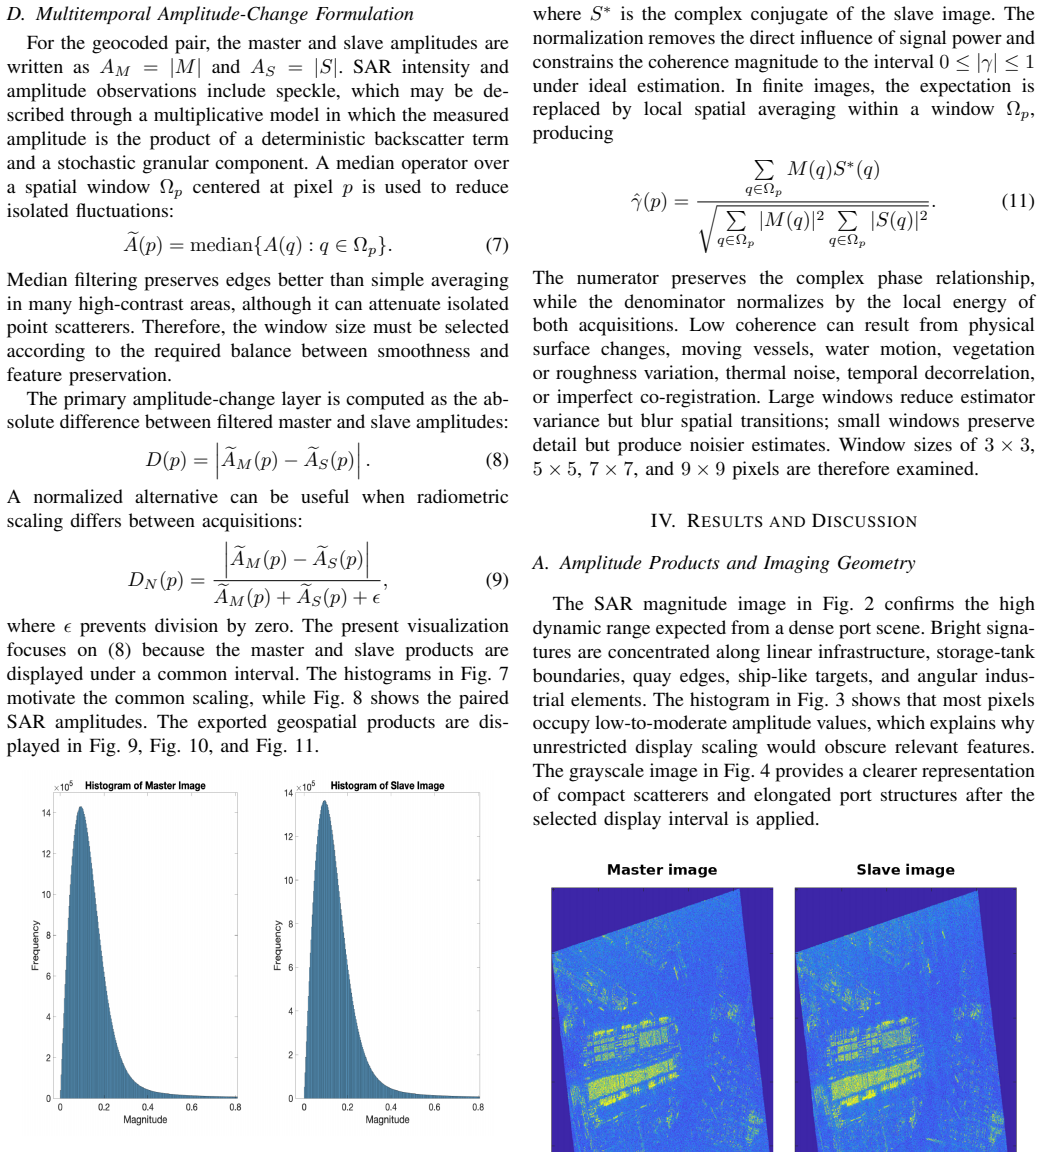
Spaceborne synthetic aperture radar (SAR) provides coherent microwave imagery suitable for maritime infrastructure monitoring under illumination-independent and weather-independent acquisition conditions. An academic conference-style analysis is presented for SAR amplitude and geocoded multitemporal data over Tianjin Port, China. The processing chain includes amplitude visualization, radiometric scaling, view-direction interpretation, range and azimuth resolution assessment, speckle reduction, amplitude-based change mapping, GeoTIFF export for geographic inspection, and interferometric coherence estimation. Histogram-guided display limits improve the interpretability of the complex SAR magnitude images, while zoomed inspection of shadows and bright layover responses supports qualitative interpretation of illumination geometry. A two-dimensional Fourier analysis is used to characterize dominant spectral content and to estimate an approximate range resolution of 0.42 m and an azimuth angular separation of 0.19 degrees under the available image-coordinate calibration. Multitemporal master and slave images are subsequently compared through filtered amplitude differences and coherence maps computed with multiple spatial averaging windows. The results highlight the relevance of SAR amplitude and coherence products for detecting structural and surface-condition variations in dense port environments characterized by vessels, storage tanks, quay structures, industrial yards, and water-land transitions.
Editorial analysis
A structured set of objections, weighed in public.
Referee Report
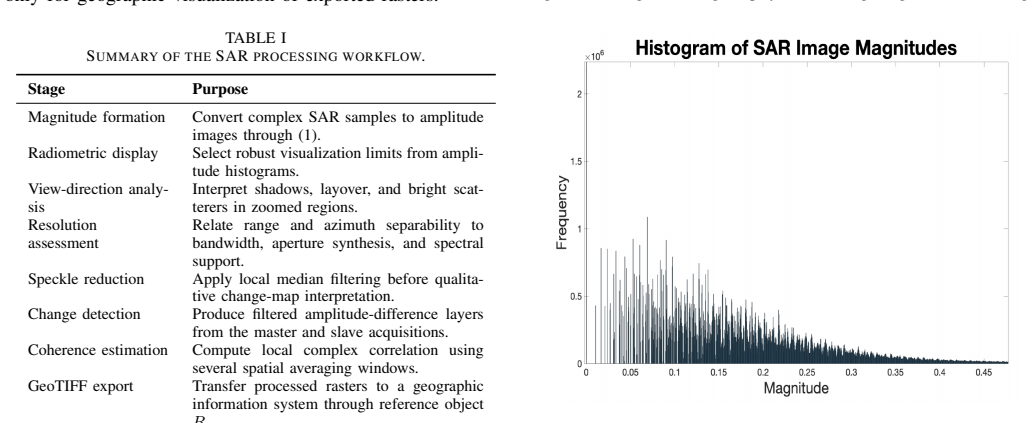
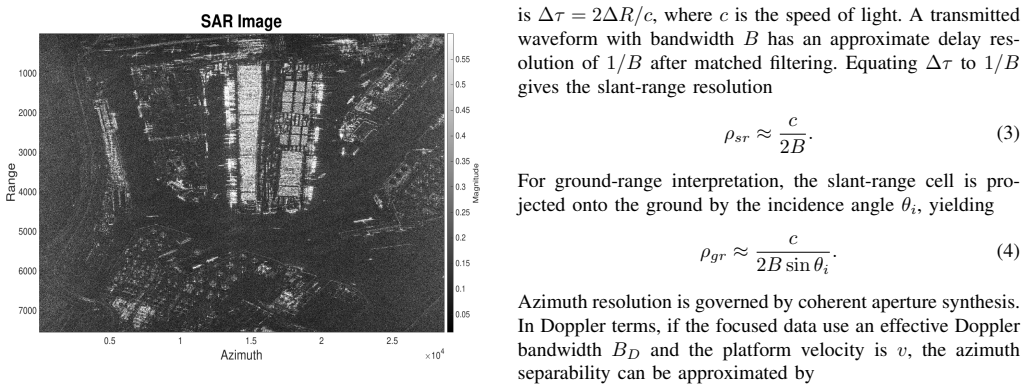
Summary. The manuscript describes a standard SAR processing chain applied to multitemporal spaceborne imagery over Tianjin Port, China. The workflow encompasses amplitude visualization with histogram-guided scaling, speckle reduction, amplitude-difference change mapping, GeoTIFF export, and interferometric coherence estimation using multiple spatial averaging windows. A 2-D Fourier analysis is used to estimate range resolution (~0.42 m) and azimuth angular separation (~0.19°). The central claim is that the resulting amplitude and coherence products are relevant for detecting structural and surface-condition changes in dense port environments (vessels, tanks, quays, yards, water-land transitions) on the basis of qualitative visual inspection of the processed maps.
Significance. If the visual interpretations were supported by quantitative validation, the work would illustrate the applicability of routine SAR amplitude and coherence products to maritime infrastructure monitoring under all-weather conditions. In its current form the contribution is primarily a demonstration of standard processing steps rather than a validated methodological advance or operational assessment.
major comments (1)
- [Abstract] Abstract (final sentence) and results discussion: the assertion that amplitude and coherence products are 'relevant' for operational port monitoring rests exclusively on qualitative visual distinguishability of features in the example maps. No detection accuracy, false-alarm rates, statistical tests, or comparison against optical/AIS ground truth are reported, rendering the utility claim unsupported.
minor comments (1)
- The manuscript would benefit from explicit statement of the SAR sensor, acquisition dates, and incidence angles to allow reproducibility of the reported resolution estimates.
Simulated Author's Rebuttal
We thank the referee for the constructive comments on our manuscript. The work is presented as a conference-style analysis demonstrating standard SAR processing for qualitative change detection in a maritime port. We respond to the major comment point by point below.
read point-by-point responses
-
Referee: [Abstract] Abstract (final sentence) and results discussion: the assertion that amplitude and coherence products are 'relevant' for operational port monitoring rests exclusively on qualitative visual distinguishability of features in the example maps. No detection accuracy, false-alarm rates, statistical tests, or comparison against optical/AIS ground truth are reported, rendering the utility claim unsupported.
Authors: The manuscript explicitly describes itself as an 'academic conference-style analysis' focused on the processing chain and qualitative visual inspection of amplitude and coherence products. No quantitative metrics are claimed or provided, as the contribution lies in illustrating the applicability through visual examples in a dense port setting. We acknowledge that the phrasing in the abstract's final sentence may overstate the operational relevance. We will revise the abstract and discussion sections to emphasize the qualitative nature of the demonstration and remove implications of operational validation. revision: yes
Circularity Check
No circularity; empirical processing demonstration with no closed-loop claims or derivations.
full rationale
The paper describes a standard SAR processing pipeline (amplitude visualization, speckle filtering, coherence estimation with varying windows, Fourier-based resolution estimation, and qualitative multitemporal comparison) applied to Tianjin Port data. No mathematical derivations, parameter fitting, predictions, or uniqueness theorems are presented. The central claim rests on visual inspection of processed products, which is a methodological choice rather than a self-referential reduction. No self-citations or ansatzes are invoked in a load-bearing way. This is a self-contained empirical demonstration.
Axiom & Free-Parameter Ledger
Reference graph
Works this paper leans on
-
[1]
A tutorial on synthetic aperture radar,
A. Moreira, P. Prats-Iraola, M. Younis, G. Krieger, I. Hajnsek, and K. P. Papathanassiou, “A tutorial on synthetic aperture radar,”IEEE Geoscience and Remote Sensing Magazine, vol. 1, no. 1, pp. 6–43, Mar. 2013
2013
-
[2]
J. C. Curlander and R. N. McDonough,Synthetic Aperture Radar: Systems and Signal Processing. New York, NY , USA: Wiley, 1991
1991
-
[3]
I. G. Cumming and F. H. Wong,Digital Processing of Synthetic Aperture Radar Data: Algorithms and Implementation. Norwood, MA, USA: Artech House, 2005
2005
-
[4]
Franceschetti and R
G. Franceschetti and R. Lanari,Synthetic Aperture Radar Processing. Boca Raton, FL, USA: CRC Press, 1999
1999
-
[5]
Oliver and S
C. Oliver and S. Quegan,Understanding Synthetic Aperture Radar Images. Raleigh, NC, USA: SciTech Publishing, 2004
2004
-
[6]
Lee and E
J.-S. Lee and E. Pottier,Polarimetric Radar Imaging: From Basics to Applications. Boca Raton, FL, USA: CRC Press, 2009
2009
-
[7]
Change detection techniques for ERS- 1 SAR data,
E. J. M. Rignot and J. J. van Zyl, “Change detection techniques for ERS- 1 SAR data,”IEEE Transactions on Geoscience and Remote Sensing, vol. 31, no. 4, pp. 896–906, Jul. 1993
1993
-
[8]
Automatic analysis of the difference image for unsupervised change detection,
L. Bruzzone and D. F. Prieto, “Automatic analysis of the difference image for unsupervised change detection,”IEEE Transactions on Geo- science and Remote Sensing, vol. 38, no. 3, pp. 1171–1182, May 2000
2000
-
[9]
A new statistical similarity measure for change detection in multitemporal SAR images and its extension to multiscale change analysis,
J. Inglada and G. Mercier, “A new statistical similarity measure for change detection in multitemporal SAR images and its extension to multiscale change analysis,”IEEE Transactions on Geoscience and Remote Sensing, vol. 45, no. 5, pp. 1432–1445, May 2007
2007
-
[10]
Generalized minimum-error thresholding for unsupervised change detection from SAR amplitude imagery,
G. Moser and S. B. Serpico, “Generalized minimum-error thresholding for unsupervised change detection from SAR amplitude imagery,”IEEE Transactions on Geoscience and Remote Sensing, vol. 44, no. 10, pp. 2972–2982, Oct. 2006
2006
-
[11]
Digital image enhancement and noise filtering by use of local statistics,
J.-S. Lee, “Digital image enhancement and noise filtering by use of local statistics,”IEEE Transactions on Pattern Analysis and Machine Intelligence, vol. PAMI-2, no. 2, pp. 165–168, Mar. 1980
1980
-
[12]
A review of speckle filtering in the context of estimation theory,
R. Touzi, “A review of speckle filtering in the context of estimation theory,”IEEE Transactions on Geoscience and Remote Sensing, vol. 40, no. 11, pp. 2392–2404, Nov. 2002
2002
-
[13]
Synthetic aperture radar interferometry,
R. Bamler and P. Hartl, “Synthetic aperture radar interferometry,”Inverse Problems, vol. 14, no. 4, pp. R1–R54, Aug. 1998
1998
-
[14]
Ferretti, A
A. Ferretti, A. Monti-Guarnieri, C. Prati, F. Rocca, and D. Massonnet, InSAR Principles: Guidelines for SAR Interferometry Processing and Interpretation. Noordwijk, The Netherlands: European Space Agency, ESA TM-19, 2007
2007
-
[15]
Decorrelation in interferometric radar echoes,
H. A. Zebker and J. Villasenor, “Decorrelation in interferometric radar echoes,”IEEE Transactions on Geoscience and Remote Sensing, vol. 30, no. 5, pp. 950–959, Sep. 1992
1992
-
[16]
Coherence estimation for SAR imagery,
R. Touzi, A. Lopes, J. Bruniquel, and P. W. Vachon, “Coherence estimation for SAR imagery,”IEEE Transactions on Geoscience and Remote Sensing, vol. 37, no. 1, pp. 135–149, Jan. 1999
1999
discussion (0)
Sign in with ORCID, Apple, or X to comment. Anyone can read and Pith papers without signing in.