Simulation-Free Estimation of Traffic Flows from Sparse Count Data
Pith reviewed 2026-06-26 09:04 UTC · model grok-4.3
The pith
A weighted least-squares optimization on feasible region-to-region routes estimates time-varying traffic flows from sparse sensor counts without simulation.
A machine-rendered reading of the paper's core claim, the machinery that carries it, and where it could break.
Core claim
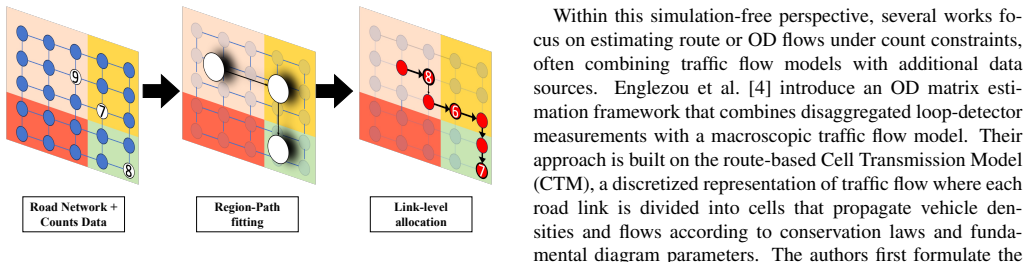
The central claim is that partitioning the network into regions, enumerating feasible inter-region routes, and solving a weighted least-squares problem whose objective incorporates a sensor coverage matrix produces flow allocations that reproduce observed daily profiles and outperform existing methods at a fraction of the computational cost.
What carries the argument
The weighted contribution matrix that encodes sensor coverage and steers the optimizer toward flow configurations directly observable by sensors.
If this is right
- Traffic estimation becomes feasible on networks where full microscopic simulation is too slow or too data-hungry.
- Only aggregated regional counts are required as input, not individual vehicle trajectories.
- Edge-level flow estimates follow directly from scoring the optimized routes against the observed temporal profiles.
- Computational cost remains low enough for repeated daily or near-real-time use.
Where Pith is reading between the lines
- The same route-allocation idea could be tested on other sparse-count problems such as pedestrian flows in buildings or commodity flows in supply networks.
- If the enumerated route set systematically omits high-volume corridors, the optimizer would be forced to over-allocate on the included routes and the estimates would degrade.
- Adding a small regularization term that favors smoother temporal profiles might improve robustness when sensor coverage is especially sparse.
Load-bearing premise
The chosen set of feasible routes together with the sensor contribution matrix supplies enough constraints for the optimizer to recover flows that match the true underlying traffic.
What would settle it
Apply the method to a network where the true route-level flows are known from a controlled simulation or detailed tracking, then measure whether the estimated flows deviate from the known values by more than a few percent on average.
Figures


read the original abstract
We propose a method for estimating time-varying traffic flow patterns from sparse aggregated vehicle counts. The method partitions the study area into spatial regions, constructs a set of feasible region-to-region routes, and solves a weighted least-squares optimization problem to determine the number of vehicles to allocate on each route. A weighted contribution matrix encodes sensor coverage, steering the optimizer toward flow configurations that are directly observable by sensors. Edge-level trajectories are then derived by scoring candidate routes against the temporal and volumetric profiles of aggregated regional sensor counts. The method is evaluated on the Brussels road network using real and synthetic traffic data. Results show that the proposed approach reproduces the daily traffic profile in the input data and outperforms the baseline methods at a fraction of the computational cost.
Editorial analysis
A structured set of objections, weighed in public.
Referee Report
Summary. The paper proposes a simulation-free method for estimating time-varying traffic flows from sparse aggregated vehicle counts. The approach partitions the study area into regions, enumerates feasible region-to-region routes, constructs a weighted contribution matrix encoding sensor coverage, solves a weighted least-squares optimization to allocate vehicles to routes, and derives edge-level trajectories by scoring routes against sensor profiles. Evaluation on the Brussels road network with real and synthetic data claims that the method reproduces daily traffic profiles in the input data and outperforms baseline methods at a fraction of the computational cost.
Significance. If the method could be shown to recover ground-truth flows from underdetermined sparse counts (rather than merely fitting aggregates), it would offer a computationally efficient alternative to simulation-based traffic estimation. The simulation-free formulation and use of a weighted contribution matrix to steer the optimizer are conceptually appealing, but the manuscript provides no quantitative metrics or identifiability analysis to support these strengths.
major comments (3)
- [Abstract] Abstract: The claim that the method 'reproduces the daily traffic profile in the input data' only verifies consistency with observed sensor aggregates. With sparse counts the linear system is underdetermined, so many route-flow vectors produce identical readings; the manuscript supplies no identifiability argument, regularization analysis, or proof that the weighted least-squares selects the true underlying flows rather than any feasible fit.
- [Abstract] Abstract / Evaluation: The assertion that the approach 'outperforms the baseline methods' is unsupported because no quantitative error metrics, validation details on the real and synthetic datasets, or comparison tables are provided, preventing assessment of the magnitude or statistical significance of any improvement.
- [Method] Method description: The construction of the feasible route set and the weighted contribution matrix is presented at a high level with no discussion of exhaustiveness of the route enumeration or how the weighting matrix resolves degeneracies in the underdetermined system; this is load-bearing for the central claim that the optimizer is steered toward true flows.
minor comments (1)
- [Abstract] Abstract: The phrase 'at a fraction of the computational cost' is stated without naming the baselines or reporting any runtime numbers.
Simulated Author's Rebuttal
We thank the referee for the constructive feedback. The comments correctly identify areas where additional discussion and quantitative support would strengthen the manuscript. We address each major comment below and will revise accordingly.
read point-by-point responses
-
Referee: [Abstract] Abstract: The claim that the method 'reproduces the daily traffic profile in the input data' only verifies consistency with observed sensor aggregates. With sparse counts the linear system is underdetermined, so many route-flow vectors produce identical readings; the manuscript supplies no identifiability argument, regularization analysis, or proof that the weighted least-squares selects the true underlying flows rather than any feasible fit.
Authors: We agree that consistency with aggregates does not establish recovery of unique true flows in an underdetermined system. The weighted contribution matrix is intended to prioritize observable configurations, but the manuscript lacks a formal identifiability analysis. We will add a dedicated discussion of these limitations and the role of weighting in the revised version. revision: yes
-
Referee: [Abstract] Abstract / Evaluation: The assertion that the approach 'outperforms the baseline methods' is unsupported because no quantitative error metrics, validation details on the real and synthetic datasets, or comparison tables are provided, preventing assessment of the magnitude or statistical significance of any improvement.
Authors: The evaluation section reports reproduction of profiles and computational advantages on the Brussels data, but we acknowledge the absence of detailed quantitative metrics and tables. We will add error metrics (e.g., MAE on flow profiles), validation details, and comparison tables with statistical information in the revision. revision: yes
-
Referee: [Method] Method description: The construction of the feasible route set and the weighted contribution matrix is presented at a high level with no discussion of exhaustiveness of the route enumeration or how the weighting matrix resolves degeneracies in the underdetermined system; this is load-bearing for the central claim that the optimizer is steered toward true flows.
Authors: We will expand the method section with specifics on the route enumeration procedure, its exhaustiveness for the studied network, and further explanation of how the weighting resolves (or mitigates) degeneracies in the underdetermined system. revision: yes
Circularity Check
No significant circularity in the derivation chain
full rationale
The paper describes a method that partitions space, enumerates feasible routes, constructs a sensor contribution matrix, and solves a weighted least-squares problem whose objective is explicitly to match observed aggregated counts. Reproduction of the daily profile is the intended and direct consequence of this data-driven fit rather than a separate derived claim. Evaluation includes synthetic data (allowing ground-truth comparison) and runtime comparisons to baselines, providing external benchmarks. No equations, self-citations, or uniqueness arguments are shown that would reduce the outputs to the inputs by construction; the derivation remains an explicit optimization procedure driven by external sensor data.
Axiom & Free-Parameter Ledger
Reference graph
Works this paper leans on
-
[1]
Behrisch and P
M. Behrisch and P. Hartwig. A comparison of sumo’s count based and countless demand generation tools. SUMO Conference Proceedings, 2:125–131, Jun. 2022
2022
-
[2]
Y . Cao, H. Van Lint, P. Krishnakumari, and M. Bliemer. Data driven origin–destination matrix estimation on large networks-a joint origin-destination-path-choice formulation.Transportation Research Part C: Emerg- ing Technologies, 168:104850, 2024
2024
-
[3]
R. F. Daguano, L. R. Yoshioka, M. L. Netto, C. L. Marte, C. A. Isler, M. M. D. Santos, and J. F. Justo. Automatic calibration of microscopic traffic simulation models us- ing artificial neural networks.Sensors, 23(21):8798, 2023
2023
-
[4]
Englezou, S
Y . Englezou, S. Timotheou, and C. G. Panayiotou. Dy- namic origin-destination matrix estimation for networks operating under free-flow conditions using macroscopic flow dynamics.IFAC-PapersOnLine, 58(10):213–218,
-
[5]
17th IFAC Symposium on Control of Transporta- tion Systems CTS 2024
2024
-
[6]
Galliani, P
G. Galliani, P. Secchi, and F. Ieva. Estimation of dy- namic origin–destination matrices in a railway trans- portation network integrating ticket sales and passenger count data.Transportation Research Part A: Policy and Practice, 190:104246, 2024
2024
-
[7]
D. A. Guastella, B. Cornelis, and G. Bontempi. Traf- fic simulation with incomplete data: the case of brus- sels. InProceedings of the 1st ACM SIGSPATIAL In- ternational Workshop on Methods for Enriched Mobility Data: Emerging Issues and Ethical Perspectives 2023, EMODE ’23, page 15–24, New York, NY , USA, 2023. Association for Computing Machinery
2023
-
[8]
D. A. Guastella, A. Morales-Hern ´andez, B. Cornelis, and G. Bontempi. Calibration of vehicular traffic sim- ulation models by local optimization.Transportation, 2025
2025
-
[9]
Nguyen and C
S. Nguyen and C. Dupuis. An efficient method for com- puting traffic equilibria in networks with asymmetric transportation costs.Transportation Science, 18(2):185– 202, 1984
1984
-
[10]
C. Osorio. High-dimensional offline origin-destination (od) demand calibration for stochastic traffic simulators 11 of large-scale road networks.Transportation Research Part B: Methodological, 124:18–43, 2019
2019
-
[11]
P. K.B. Rangaiah, B.P. Pradeep kumar, and R. Augus- tine. Improving burn diagnosis in medical image re- trieval from grafting burn samples using b-coefficients and the clahe algorithm.Biomedical Signal Processing and Control, 99:106814, 2025
2025
-
[12]
Roocroft, G
A. Roocroft, G. Punzo, and M. A. Ramli. Flow count data-driven static traffic assignment models through network modularity partitioning.Transporta- tion, 52(1):185–214, 2025
2025
-
[13]
Sadiq, M
M. Sadiq, M. N. Kadhim, D. Al-Shammary, and M. Mi- lanova. Novel eeg classification based on hellinger distance for seizure epilepsy detection.IEEE Access, 12:127357–127367, 2024
2024
-
[14]
L. Tang, D. Zhang, Y . Han, A. Fu, H. Zhang, Y . Tian, L. Yue, D. Wang, and J. Sun. Parallel-computing- based calibration for microscopic traffic simulation model.Transportation Research Record, 2678(4):279– 294, 2024
2024
-
[15]
G. Wei, D. Gundleg ˚ard, and C. Rydergren. Consis- tent origin-destination and link flow estimation based on data-driven network assignment.Transportation Re- search Procedia, 86:668–675, 2025
2025
-
[16]
Zhang, N
C. Zhang, N. Arora, C. Bian, Y . Li, W. Ng, A. Tomkins, B. Yan, J. Zhang, and C. Osorio. Origin-destination travel demand estimation: An approach that scales worldwide, and its application to five metropolitan high- way networks, 2025
2025
-
[17]
Zhang, G
Z. Zhang, G. Yuan, Z. Qin, and Q. Luo. An improve- ment by introducing lbfgs idea into the adam optimizer for machine learning.Expert Systems with Applications, 296:129002, 2026. 12
2026
discussion (0)
Sign in with ORCID, Apple, or X to comment. Anyone can read and Pith papers without signing in.