REVIEW 4 major objections 6 minor 38 references
Economic Disparities and Their Relationship to Destructive Health Behaviors in Five Western U.S. States
T0 review · 4 major / 6 minor · reviewed 2026-07-12 · grok-4.5
Pith's one-line read County economic indicators track several adverse health outcomes across five western states, with physical inactivity, mental distress, and smoking showing the strongest linear links and suicide rate a moderate one.
desk verdict Competent regional exploratory scan with a usable data portal; the associations are real enough to record, but the unvalidated regression imputation is the soft underbelly of every reported R² and LASSO path. read the letter →
The pith
A machine-rendered reading of the paper's core claim, the machinery that carries it, and where it could break.
The reading
What carries the argument
A two-step regression-imputed county dataset of Census economic variables plus derived measures (overcrowding, labor deprivation, equivalized and real equivalized income, rent index), analyzed by PCA/k-means for structure, correlation screening, OLS R-squared comparisons across health outcomes, and cross-validated LASSO coefficient paths for suicide-rate prediction under multicollinearity.
What would settle it
Re-run the same OLS and LASSO pipelines on the non-imputed (complete-case) subset of counties, or on an independent later ACS and County Health Rankings vintage, and check whether the R-squared ranking (physical inactivity, mental distress, smoking above suicide) and the non-zero LASSO predictors for suicide rate stay essentially the same.
Extended reading notes
Core claim
Across the five western states, county economic variables are meaningfully associated with multiple adverse health outcomes. Ordinary least-squares models that use only economic predictors achieve R-squared values of 0.723 for physical inactivity, 0.702 for frequent mental distress, 0.676 for smoking rate, and 0.501 for suicide rate. After LASSO shrinkage and cross-validation, the economic variables that remain most relevant for suicide rate include average household size, rent-index region, real equivalized income, poverty rate, bachelor’s-plus share, and labor deprivation.
Load-bearing premise
The two-step median-then-regression imputation recovers the true joint pattern of economic and health variables well enough that the reported correlations, R-squared values, and LASSO rankings remain reliable even for counties that originally had many missing entries.
Signed reviews
Editorial analysis
A structured set of objections, weighed in public.
Referee Report
Summary. The paper examines county-level associations between economic indicators (Census ACS) and adverse health outcomes (County Health Rankings) in Washington, Idaho, Oregon, California, and Nevada, with emphasis on suicide rate. After median-then-regression imputation, the authors apply PCA and k-means clustering to economic variables, report correlations, fit OLS models of each health outcome on economic predictors (Table 3 R²), and use cross-validated LASSO for suicide (Figure 6, Table 2). They conclude that economic indicators are meaningfully associated with several outcomes—strongest OLS R² for physical inactivity (0.723), frequent mental distress (0.702), and smoking (0.676), with suicide at 0.501—and that LASSO retains average household size, rent index region, real equivalized income, poverty rate, bachelor’s-plus share, and labor deprivation as non-zero suicide predictors.
Significance. If the reported associations hold under more robust missing-data treatment and uncertainty quantification, the work would provide a useful, reproducible exploratory map of economic–health linkages for five western states and a public data/website resource for further research. Strengths include transparent discussion of multicollinearity (VIF, LASSO), literature-motivated derived variables (equivalized income, rent index, labor deprivation), an open data portal, and explicit non-causal framing. The contribution is primarily descriptive/EDA rather than methodological or causal; its value for stat.AP depends on whether the headline R² and LASSO selection survive sensitivity checks that the manuscript currently lacks.
major comments (4)
- [Methods §2.1 / Limitations §5.1] Methods §2.1 and Limitations §5.1: The two-step regression imputation (column-median fill, then OLS prediction of originally missing cells from other columns) is load-bearing for every reported correlation, Table 3 R², and the LASSO path/selection. The paper itself notes that counties with many missing entries can yield inaccurate imputations, yet no complete-case analysis, multiple-imputation comparison, or leave-out-of-imputed-cells check is reported. Without at least one such sensitivity analysis showing that the headline associations (esp. Table 3 and Table 2) do not shrink or change sign materially, the central empirical claim is not yet reliable.
- [Table 3 / Results §3] Table 3 and Results §3: The comparative claim that physical inactivity, frequent mental distress, and smoking have the strongest economic associations rests on unregularized OLS R² despite VIFs reported above 350 for the suicide model. The authors correctly note that multicollinearity is less critical for pure prediction within the observed region, but Table 3 is used as a ranking of association strength across outcomes. Either report regularized/predictive metrics (e.g., CV R² under the same LASSO/ridge protocol for every outcome) or demonstrate that the ranking is stable under complete-case or VIF-pruned specifications.
- [Table 2 / Figure 6 / Discussion §4] Table 2, Figure 6, and Discussion §4: LASSO coefficients and the OLS R² values are presented without standard errors, confidence intervals, bootstrap intervals, or any measure of selection stability (e.g., selection frequency under CV folds or bootstrap). For a statistics-applied venue, point estimates alone cannot support statements about which economic variables are “most and least important” for suicide or about the strength of linear relationships. Add uncertainty quantification for coefficients and for the R² ranking.
- [Discussion §4] Discussion §4 (poverty-rate and Real Equivalized Income signs): The post-hoc explanations for the negative poverty coefficient and positive Real Equivalized Income coefficient invoke unmeasured density/overcrowding pathways and the algebraic construction of Real Equivalized Income. These are plausible but untested; they currently read as fitted-story rather than evidence. Either support them with auxiliary regressions (e.g., partial associations controlling for overcrowding/density) or clearly label them as speculative hypotheses, not findings.
minor comments (6)
- [Abstract / Introduction] Abstract and Introduction: The geographic scope is five western states, but data were gathered for the entire U.S. Clarify early which analyses use the five-state subset versus the national file, and whether imputation was fit nationally or within the five states.
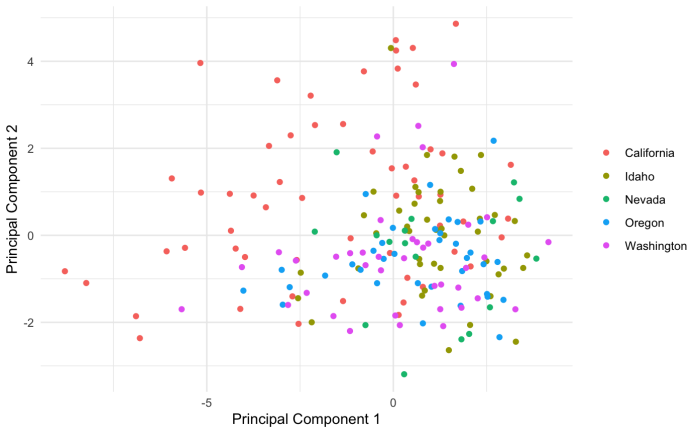
- [Figure 3] Figure 3 / Methods §2.2: k-means with the elbow method is fine for visualization, but state that cluster labels are descriptive only (as Limitations §5.2 does) already in the Results caption so readers do not treat the Nevada–Idaho cluster as a validated classification.
- [Table 1 / §2.1] Table 1: Define “Broadband Access” and “Uninsured Rate” in the data-collection paragraph; they appear in Table 2 but are not listed among the Census variables gathered in §2.1.
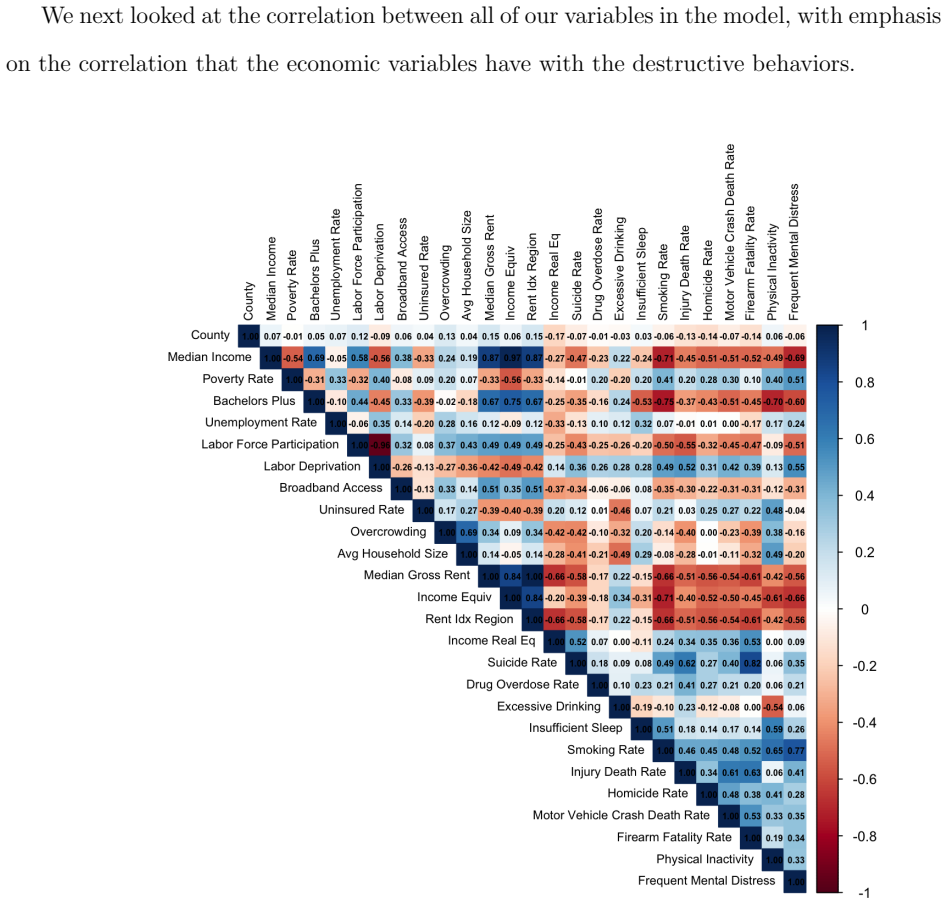
- [Figures 4–5] Figure 4–5: Correlation filtering at |r|≥0.4 is reasonable for the graph, but state sample size (number of counties) and whether correlations use pairwise complete or fully imputed data.
- [§2.3] Software §2.3: Package versions and a fixed random seed for k-means/CV would improve reproducibility alongside the shinyapps data portal.
- [Throughout / §7] Typos/clarity: “Bachelor’s plus” vs “Bachelors Plus” inconsistency; arXiv date “June 2026” / “3 Jul 2026” is fine for preprint but should be normalized for journal submission; “Web-Econ-disp” link should be archived (e.g., DOI or Zenodo) so the data statement remains durable.
Circularity Check
No circularity: purely observational EDA and regression on external Census/CHR data; derived variables are algebraic transforms, not quantities defined to equal the targets.
full rationale
The paper gathers economic variables from U.S. Census ACS and health outcomes from County Health Rankings, applies regression imputation for missing entries, constructs a few derived economic indices by explicit algebraic formulas (Overcrowding, Equivalized Income, Rent Index Region, Real Equivalized Income, Labor Deprivation), then runs standard unsupervised and supervised procedures (PCA, k-means, correlation matrices, OLS R^{2}, LASSO with CV). None of these steps defines a target quantity in terms of itself, fits a free parameter and then re-labels the fit as an independent prediction, or rests on a load-bearing self-citation uniqueness claim. The derived variables are simple functions of observed columns and are never asserted to equal suicide rate or any other health outcome by construction. The reported R^{2} values and LASSO coefficient paths are ordinary statistical summaries of the (imputed) joint distribution; they may be sensitive to the imputation procedure (a validity concern already flagged by the authors), but that is not circularity. There is no self-citation chain, no ansatz smuggled via prior work by the same authors, and no renaming of a known result presented as a new derivation. The analysis is therefore self-contained against its external data sources and scores 0 on circularity.
Assumptions & free parameters
free parameters (3)
- LASSO regularization parameter λ =
CV-selected (value not numerically reported)
- Number of k-means clusters =
3
- Median fill values used before regression imputation =
column-wise sample medians
assumptions (3)
- domain assumption Linear additive relationships between the economic block and each health outcome are adequate for exploratory association measurement.
- ad hoc to paper Regression imputation after median fill recovers associations sufficiently well for the reported correlations and models to be informative.
- domain assumption County-level ecological associations are worth reporting even though they do not identify individual-level effects.
invented entities (3)
-
Labor Deprivation index
-
Real Equivalized Income
-
Rent Index Region (MRI)
independent evidence
Cite this review
Pith. "Pith review of Economic Disparities and Their Relationship to Destructive Health Behaviors in Five Western U.S. States." pith.science (2026). https://pith.science/paper/NLXQIVSK
@misc{pith2026260700317,
  author       = {Pith},
  title        = {Pith review of: Economic Disparities and Their Relationship to Destructive Health Behaviors in Five Western U.S. States},
  year         = {2026},
  howpublished = {\url{https://pith.science/paper/NLXQIVSK}},
  note         = {Machine review of arXiv:2607.00317}
}
abstract
In this paper, we look at the relationships that economic variables have with adverse health outcomes in the western counties of Washington, Idaho, Oregon, California, and Nevada, with specific emphasis on how suicide rate relates to such economic variables. Data was first gathered from Census and County Health Rankings for the entire United States (for website use and usefulness for future research), cleaned and regression-imputed, and then various exploratory data analysis methods were used, such as PCA, clustering, correlation gathering, linear fittings, and LASSO. PCA and clustering suggested that counties may group according to broader state-level economic patterns, although political interpretations would require additional electoral data. Correlation Analysis, along with LASSO and linear fittings, showed us the destructive variables that connected the most with economic variables (in terms of $R^2$ and correlation values seen), the economic variables that are most and least important in predicting suicide rate, and the possible relationships that suicide rate has with these economic variables.
Figures


Figures from the paper (3 more)


Reference graph
Works this paper leans on
-
[1]
Daly and Norman J
Mary C. Daly and Norman J. Johnson and Daniel J. Wilson , title=. 2007 , number=. doi:None , url=
2007
-
[2]
Vital Signs: Trends in State Suicide Rates — United States, 1999–2016 and Circumstances Contributing to Suicide — 27 States, 2015 , volume =
Stone, Deborah and Simon, Thomas and Fowler, Katherine and Kegler, Scott and Yuan, Keming and Holland, Kristin and Ivey-Stephenson, Asha and Crosby, Alex , year =. Vital Signs: Trends in State Suicide Rates — United States, 1999–2016 and Circumstances Contributing to Suicide — 27 States, 2015 , volume =. MMWR. Morbidity and Mortality Weekly Report , doi =
1999
-
[3]
Missing data imputation: Focusing on single imputation , volume =
Zhang, Zhongheng , year =. Missing data imputation: Focusing on single imputation , volume =. Annals of translational medicine , doi =
-
[4]
WHO Housing and Health Guidelines , year =
-
[5]
Income and Wealth Distribution Databases: Terms of Reference , year =
-
[6]
Sakari Karvonen and Pasi Moisio and Kristian Vepsäläinen and Joonas Ollonqvist , keywords =. Assessing health gradient with different equivalence scales for household income – A sensitivity analysis , journal =. 2021 , issn =. doi:https://doi.org/10.1016/j.ssmph.2021.100892 , url =
-
[7]
Income Comparisons with Regional Price Parity Adjustments , year=
U.S. Income Comparisons with Regional Price Parity Adjustments , year=. The B.E. Journal of Economic Analysis & Policy , author=. doi:10.1515/bejeap-2018-0024 , url=
-
[8]
Better Jobs Index: An Employment Conditions Index for Latin America , institution =
Show all 38 references
-
[9]
and Garnett, Matthew F
Spencer, Merianne R. and Garnett, Matthew F. and Mini. Drug overdose deaths in the United States, 2002--2022 , institution =. 2024 , doi =
2002
-
[10]
http://www.nber.org/papers/w32068
Hamilton, James D and Ma, Xinwei and Xi, Jin. Principal Component Analysis for a Mix of Stationary and Nonstationary Variables. 2024. doi:10.3386/w32068 , URL = "http://www.nber.org/papers/w32068", abstract =
2024 doi
-
[11]
Journal of Monetary Economics , author=
Forecasting inflation , year=. Journal of Monetary Economics , author=. doi:None , url=
-
[12]
Journal of Educational Psychology , volume =
Analysis of a Complex of Statistical Variables into Principal Components , author =. Journal of Educational Psychology , volume =
-
[13]
Proceedings of the Fifth Berkeley Symposium on Mathematical Statistics and Probability , volume =
Some Methods for Classification and Analysis of Multivariate Observations , author =. Proceedings of the Fifth Berkeley Symposium on Mathematical Statistics and Probability , volume =. 1967 , publisher =
1967
-
[14]
Journal of the Royal Statistical Society: Series B (Methodological) , volume =
Tibshirani, Robert , title =. Journal of the Royal Statistical Society: Series B (Methodological) , volume =. 1996 , publisher =
1996
-
[15]
and Nachtsheim, Christopher J
Kutner, Michael H. and Nachtsheim, Christopher J. and Neter, John and Li, William , title =. 2005 , publisher =
2005
-
[16]
2011 , month = jul, url =
Renwick, Trudi , title =. 2011 , month = jul, url =
2011
-
[17]
2024 , month = may, url =
Burns, Kalee , title =. 2024 , month = may, url =
2024
-
[18]
Review of Income and Wealth , volume =
Serajuddin, Umar and Verme, Paolo , title =. Review of Income and Wealth , volume =. 2015 , month = mar, doi =
2015
-
[19]
Trevor Hastie and Robert Tibshirani and Jerome Friedman , title =
-
[20]
Associations of suicide rates with socioeconomic status and social isolation: Findings from longitudinal register and Census Data , url=
Näher, Anatol-Fiete and Rummel-Kluge, Christine and Hegerl, Ulrich , year=. Associations of suicide rates with socioeconomic status and social isolation: Findings from longitudinal register and Census Data , url=. Frontiers in psychiatry , publisher=
-
[21]
The relationship between population density and suicide: a systematic review and meta-analysis , journal =
Chiara Davico and Marilia. The relationship between population density and suicide: a systematic review and meta-analysis , journal =. 2025 , issn =. doi:https://doi.org/10.1016/j.jpsychires.2025.06.003 , url =
2025 doi
-
[22]
and Millman, K
Harris, Charles R. and Millman, K. Jarrod and van der Walt, St. Array Programming with NumPy , journal =. 2020 , doi =
2020
-
[23]
Proceedings of the 9th Python in Science Conference , pages =
McKinney, Wes , title =. Proceedings of the 9th Python in Science Conference , pages =
-
[24]
John Fox and Sanford Weisberg , year =. An
-
[25]
2024 , note =
R package 'corrplot': Visualization of a Correlation Matrix , author =. 2024 , note =
2024
-
[26]
InterJournal , volume =
The igraph software package for complex network research , author =. InterJournal , volume =. 2006 , url =
2006
-
[27]
arXiv preprint arXiv:2311.10260 , year =
igraph enables fast and robust network analysis across programming languages , author =. arXiv preprint arXiv:2311.10260 , year =
-
[28]
doi:10.5281/zenodo.7682609 , url =
Gábor Csárdi and Tamás Nepusz and Vincent Traag and Szabolcs Horvát and Fabio Zanini and Daniel Noom and Kirill Müller and David Schoch and Maëlle Salmon , year =. doi:10.5281/zenodo.7682609 , url =
-
[29]
2026 , note =
dplyr: A Grammar of Data Manipulation , author =. 2026 , note =
2026
-
[30]
2016 , isbn =
Hadley Wickham , title =. 2016 , isbn =
2016
-
[31]
2023 , publisher =
Edzer Pebesma and Roger Bivand , title =. 2023 , publisher =
2023
-
[32]
2018 , journal =
Edzer Pebesma , title =. 2018 , journal =. doi:10.32614/RJ-2018-009 , url =
2018 doi
-
[33]
2025 , note =
tigris: Load Census TIGER/Line Shapefiles , author =. 2025 , note =
2025
-
[34]
2025 , note =
patchwork: The Composer of Plots , author =. 2025 , note =
2025
-
[35]
2026 , note =
magick: Advanced Graphics and Image-Processing in R , author =. 2026 , note =
2026
-
[36]
2024 , note =
kableExtra: Construct Complex Table with 'kable' and Pipe Syntax , author =. 2024 , note =
2024
-
[37]
Journal of Statistical Software , year =
Regularization Paths for Generalized Linear Models via Coordinate Descent , author =. Journal of Statistical Software , year =
-
[38]
Journal of Statistical Software , year =
Elastic Net Regularization Paths for All Generalized Linear Models , author =. Journal of Statistical Software , year =
Reviewed July 12, 2026 · model on record in the stance chip above.
Discussion (0). Continue with ORCID to comment.