The angular scale of homogeneity in the Local Universe with the SDSS blue galaxies
Pith reviewed 2026-05-25 15:46 UTC · model grok-4.3
The pith
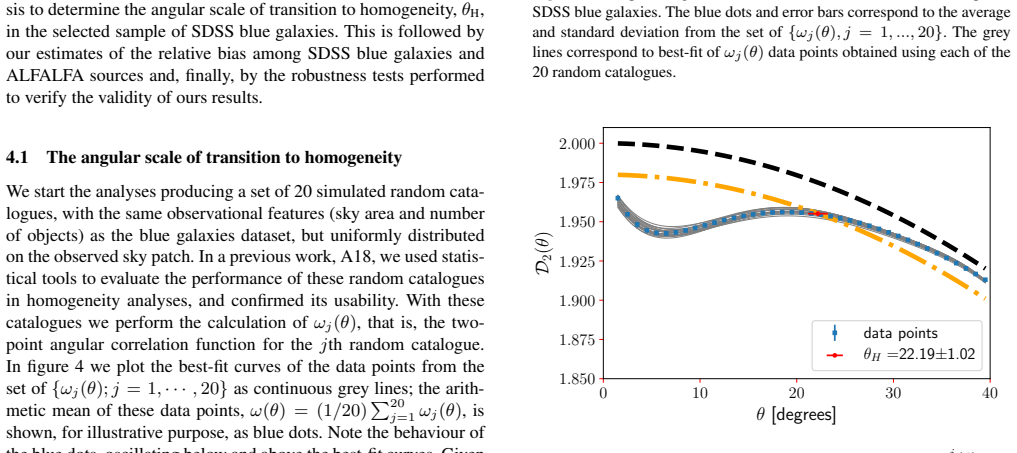
Blue galaxies from the SDSS survey transition to homogeneity at an angular scale of 22.19 degrees
A machine-rendered reading of the paper's core claim, the machinery that carries it, and where it could break.
Core claim
Through the scaled counts in spherical caps N(<θ) and the fractal correlation dimension D2(θ), the analysis of SDSS blue galaxies finds an angular scale of transition to homogeneity of 22.19 degrees with an uncertainty of 1.02 degrees. Comparison with HI extragalactic sources from the ALFALFA catalogue at similar redshifts shows excellent agreement after bias correction. Robustness tests on survey area size and a reduced sample produce similar scales. The observed scale agrees with LambdaCDM expectations and provides further evidence strengthening the validity of the Cosmological Principle.
What carries the argument
The scaled counts in spherical caps N(<θ) and fractal correlation dimension D2(θ), which track when the galaxy distribution becomes statistically uniform with increasing angular scale.
If this is right
- The angular scale of transition to homogeneity for SDSS blue galaxies is 22.19 degrees plus or minus 1.02 degrees.
- Blue galaxies and HI sources yield consistent homogeneity scales after bias correction.
- The measured scale matches what is expected in the LambdaCDM scenario.
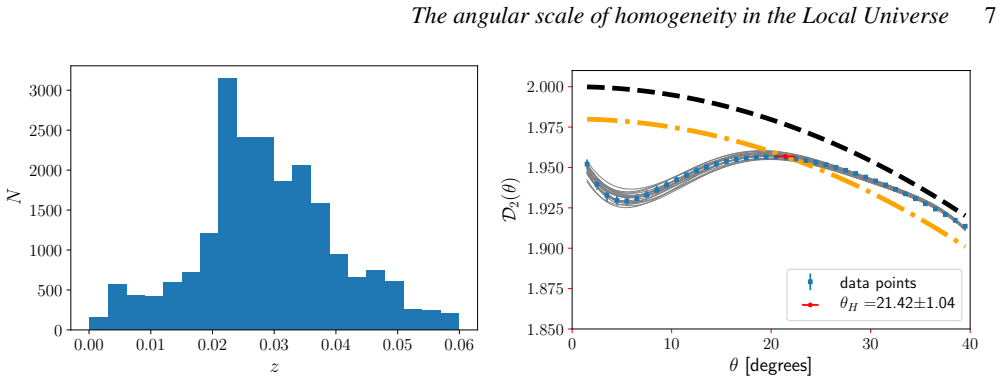
- Robustness checks confirm that survey area size and sample reduction do not alter the identified transition scale.
Where Pith is reading between the lines
- Consistency between two independent tracers at the same redshift suggests the reported scale is not driven by the choice of galaxy population.
- The method could be applied to deeper surveys to check whether the homogeneity scale changes with look-back time.
- If the scale holds across multiple independent datasets, it tightens constraints on possible large-scale deviations from uniformity.
Load-bearing premise
The scaled counts in spherical caps and fractal correlation dimension methods correctly identify the physical transition to homogeneity without residual survey systematics or tracer bias that would shift the reported angle.
What would settle it
An independent measurement of the homogeneity transition scale using a different tracer or survey at z less than 0.06 that differs from 22.19 degrees by more than the stated uncertainty would falsify the reported value.
Figures




read the original abstract
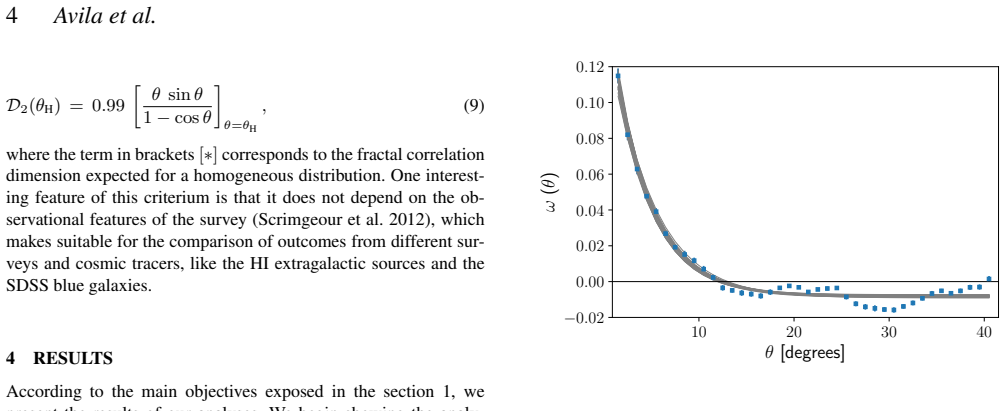
We probe the angular scale of homogeneity in the local Universe using blue galaxies from the SDSS survey as a cosmological tracer. Through the scaled counts in spherical caps, $ \mathcal{N}(<\theta) $, and the fractal correlation dimension, $\mathcal{D}_{2}(\theta)$, we find an angular scale of transition to homogeneity for this sample of $\theta_{\text{H}} = 22.19^{\circ} \pm 1.02^{\circ}$. A comparison of this measurement with another obtained using a different cosmic tracer at a similar redshift range ($z < 0.06$), namely, the HI extragalactic sources from the ALFALFA catalogue, confirms that both results are in excellent agreement (taking into account the corresponding bias correction). We also perform tests to asses the robustness of our results. For instance, we test if the size of the surveyed area is large enough to identify the transition scale we search for, and also we investigate a reduced sample of blue galaxies, obtaining in both cases a similar angular scale for the transition to homogeneity. Our results, besides confirming the existence of an angular scale of transition to homogeneity in different cosmic tracers present in the local Universe, show that the observed angular scale $\theta_{\text{H}}$ agrees well with what is expected in the $\Lambda$CDM scenario. Although we can not prove spatial homogeneity within the approach followed, our results provide one more evidence of it, strengthening the validity of the Cosmological Principle.
Editorial analysis
A structured set of objections, weighed in public.
Referee Report
Summary. The manuscript measures the angular homogeneity scale in the local Universe (z < 0.06) using blue galaxies from SDSS as tracers. Applying the scaled counts-in-spherical-caps statistic N(<θ) and the fractal correlation dimension D2(θ), the authors report a transition scale θ_H = 22.19° ± 1.02°. They find consistency with an independent measurement from the ALFALFA HI catalog after bias correction, and after performing area-size and subsample robustness tests they conclude that the result supports the Cosmological Principle and agrees with ΛCDM expectations.
Significance. If the reported θ_H is shown to be free of residual survey systematics, the work would add a useful cross-tracer confirmation (blue galaxies versus HI sources) of the homogeneity transition scale in the very local universe. The dual-statistic approach and explicit comparison to another catalog are positive features that would strengthen the evidential value for tests of large-scale homogeneity.
major comments (2)
- [Abstract (robustness tests)] Abstract (robustness tests paragraph): The area-size and subsample tests are reported only at summary level and do not include end-to-end mock catalogs that inject a known homogeneity scale, apply the actual SDSS footprint, magnitude limits, and blue-galaxy color selection, and then recover θ_H. Without such controlled simulations, it remains possible that mask or selection effects shift the apparent transition angle, which directly affects the central claim that θ_H = 22.19° ± 1.02° is the physical scale.
- [Abstract and results] Abstract and results: The uncertainty ±1.02° on θ_H is stated without any description of how the transition point is identified in N(<θ) or D2(θ), how errors are propagated, or whether bin-to-bin covariance is included. This omission prevents assessment of whether the quoted agreement with ALFALFA (after bias correction) and with ΛCDM is statistically meaningful.
minor comments (1)
- [Abstract] Typo: 'asses' should read 'assess' in the sentence 'we test if the size of the surveyed area is large enough to identify the transition scale we search for, and also we investigate a reduced sample of blue galaxies, obtaining in both cases a similar angular scale for the transition to homogeneity.'
Simulated Author's Rebuttal
We thank the referee for the constructive comments. We respond to each major point below.
read point-by-point responses
-
Referee: [Abstract (robustness tests)] Abstract (robustness tests paragraph): The area-size and subsample tests are reported only at summary level and do not include end-to-end mock catalogs that inject a known homogeneity scale, apply the actual SDSS footprint, magnitude limits, and blue-galaxy color selection, and then recover θ_H. Without such controlled simulations, it remains possible that mask or selection effects shift the apparent transition angle, which directly affects the central claim that θ_H = 22.19° ± 1.02° is the physical scale.
Authors: We agree that end-to-end mocks with injected homogeneity scales, the SDSS footprint, and full selection would provide stronger validation against systematics. The area-size and subsample tests in the manuscript vary the surveyed region and galaxy selection and recover consistent θ_H values, indicating that mask and selection effects do not drive the result. We will expand the description of these tests in the revised text. Full mock suites are beyond the present scope. revision: partial
-
Referee: [Abstract and results] Abstract and results: The uncertainty ±1.02° on θ_H is stated without any description of how the transition point is identified in N(<θ) or D2(θ), how errors are propagated, or whether bin-to-bin covariance is included. This omission prevents assessment of whether the quoted agreement with ALFALFA (after bias correction) and with ΛCDM is statistically meaningful.
Authors: We will add an explicit description in the revised manuscript of how the transition scale is identified from the convergence of N(<θ) to 1 and D2(θ) to 2, the method used to obtain the quoted uncertainty, and whether bin-to-bin covariance enters the error estimate. This will allow direct evaluation of the statistical comparisons. revision: yes
Circularity Check
No significant circularity: standard measurement on independent data
full rationale
The paper applies the established scaled counts N(<θ) and fractal dimension D2(θ) methods to SDSS blue-galaxy data to measure the transition angle θ_H, then cross-checks the result against the independent ALFALFA HI catalog (after bias correction) and performs area-size and subsample robustness tests. None of these steps reduce the reported angle to a fitted parameter by construction, nor does the central claim rest on a self-citation chain or imported uniqueness theorem. The derivation chain is self-contained against external catalogs and does not exhibit any of the enumerated circularity patterns.
Axiom & Free-Parameter Ledger
axioms (2)
- domain assumption Blue galaxies constitute an unbiased enough tracer for the homogeneity-scale statistics at z < 0.06
- domain assumption The scaled counts and fractal dimension methods recover the true homogeneity scale when applied to a sufficiently large survey volume
Lean theorems connected to this paper
-
IndisputableMonolith/Foundation/AlexanderDuality.leanalexander_duality_circle_linking (D=3 topological forcing) unclear?
unclearRelation between the paper passage and the cited Recognition theorem.
Through the scaled counts in spherical caps, N(<θ), and the fractal correlation dimension, D2(θ), we find an angular scale of transition to homogeneity ... θ_H = 22.19° ± 1.02°.
-
IndisputableMonolith/Foundation/RealityFromDistinction.leanreality_from_one_distinction unclear?
unclearRelation between the paper passage and the cited Recognition theorem.
the observed angular scale θ_H agrees well with what is expected in the ΛCDM scenario ... strengthening the validity of the Cosmological Principle.
What do these tags mean?
- matches
- The paper's claim is directly supported by a theorem in the formal canon.
- supports
- The theorem supports part of the paper's argument, but the paper may add assumptions or extra steps.
- extends
- The paper goes beyond the formal theorem; the theorem is a base layer rather than the whole result.
- uses
- The paper appears to rely on the theorem as machinery.
- contradicts
- The paper's claim conflicts with a theorem or certificate in the canon.
- unclear
- Pith found a possible connection, but the passage is too broad, indirect, or ambiguous to say the theorem truly supports the claim.
Reference graph
Works this paper leans on
-
[1]
Abbott T. M. C. et al., 2018; arXiv:1811.02374
work page internal anchor Pith review Pith/arXiv arXiv 2018
-
[2]
Ade P. A. R. et al., 2016, A&A, 594, A16; arXiv:1506.07135
work page internal anchor Pith review Pith/arXiv arXiv 2016
-
[3]
Planck 2018 results. VI. Cosmological parameters
Aghanim N. et al., 2018; arXiv:1807.06209
work page internal anchor Pith review Pith/arXiv arXiv 2018
-
[4]
The Eleventh and Twelfth Data Releases of the Sloan Digital Sky Survey: Final Data from SDSS-III
Alam S. et al., 2015, Astrophys. J. Supplement Series, 219, 12; arXiv:1501.00963
work page internal anchor Pith review Pith/arXiv arXiv 2015
-
[5]
Alam S. et al., 2017, MNRAS, 470, 2617; arXiv:1607.03155
work page internal anchor Pith review Pith/arXiv arXiv 2017
-
[6]
Measuring the transition to homogeneity with photometric redshift surveys
Alonso D. et al., 2014, MNRAS, 440, 10; arXiv:1312.0861
work page internal anchor Pith review Pith/arXiv arXiv 2014
-
[7]
Alignments of parity even/odd-only multipoles in CMB
Aluri P. K., Ralston J. P., Weltman A., 2017, MNRAS, 472, 2410; arXiv:1703.07070
work page internal anchor Pith review Pith/arXiv arXiv 2017
-
[8]
The scale of homogeneity in the local Universe with the ALFALFA catalogue
Avila F. et al., 2018, JCAP, 12, 041; arXiv:1806.04541
work page internal anchor Pith review Pith/arXiv arXiv 2018
-
[9]
Basilakos S., Plionis M., Kova c K., Voglis N., 2007, MNRAS, 378, 301; arXiv:astro-ph/0703713
work page internal anchor Pith review Pith/arXiv arXiv 2007
-
[10]
Bengaly C. A. P. et al., 2017, MNRAS, 466, 2799; arXiv:1511.09414
work page internal anchor Pith review Pith/arXiv arXiv 2017
-
[11]
Bengaly C. A. P. et al., 2017, MNRAS, 464, 768; arXiv:1606.06751
work page internal anchor Pith review Pith/arXiv arXiv 2017
-
[12]
On the large-scale angular distribution of short-Gamma ray bursts
Bernui A., Ferreira I. S., Wuensche C. A., 2008a, ApJ, 673, 968; arXiv:0710.1695
work page internal anchor Pith review Pith/arXiv arXiv
-
[13]
Bernui A., 2008b, Phys. Rev. D, 78, 063531; arXiv:0809.0934
work page internal anchor Pith review Pith/arXiv arXiv
-
[14]
Topology and the suppression of CMB large-angle correlations
Bernui A. et al., 2018; arXiv:1809.05924
work page internal anchor Pith review Pith/arXiv arXiv 2018
-
[15]
Blake C., Wall J., 2002, Nature, 416, 150; arXiv:0203385
work page 2002
-
[16]
Brinchmann J., Charlot S., White S. D. M., et al., 2004, , 351, 1151; arXiv:astro-ph/0311060
work page internal anchor Pith review Pith/arXiv arXiv 2004
-
[17]
L., Storchi-Bergmann T., 1994, , 429, 582
Calzetti D., Kinney A. L., Storchi-Bergmann T., 1994, , 429, 582
work page 1994
-
[18]
Calzetti D., Armus L., Bohlin R. C., et al., 2000, , 533, 682; arXiv:astro-ph/9911459
work page internal anchor Pith review Pith/arXiv arXiv 2000
-
[19]
Castagnoli C., Provenzale A., 1991, A&A, 246, 634
work page 1991
-
[20]
Scale Dependent Galaxy Bias in the SDSS as a function of Luminosity and Colour
Cresswell, J. G.; Percival, W. J., 2009, Monthly Notices of the Royal Astronomical Society, 392 , 682; arXiv:0808.1101
work page internal anchor Pith review Pith/arXiv arXiv 2009
-
[21]
Analytical approximations of K-corrections in optical and near-infrared bands
Chilingarian I. V., Melchior A.-L., Zolotukhin I. Y., 2010, , 405, 1409; arXiv:1002.2360
work page internal anchor Pith review Pith/arXiv arXiv 2010
-
[22]
A universal ultraviolet-optical colour-colour-magnitude relation of galaxies
Chilingarian I. V., Zolotukhin I. Y., 2012, , 419, 1727; arXiv:1102.1159
work page internal anchor Pith review Pith/arXiv arXiv 2012
-
[23]
Angular Baryon Acoustic Oscillation measure at z=2.225 from the SDSS quasar survey
de Carvalho E. et al., 2018, JCAP, 04, 064; arXiv:1709.00113
work page internal anchor Pith review Pith/arXiv arXiv 2018
-
[24]
Ellis G. F. R., 2006; arXiv:astro-ph/0602280
work page internal anchor Pith review Pith/arXiv arXiv 2006
-
[25]
Probing statistical isotropy of cosmological radio sources using SKA
Ghosh S. et al., 2016, Journal of Astrophysics and Astronomy, 37, 25; arXiv:1610.08176
work page internal anchor Pith review Pith/arXiv arXiv 2016
-
[26]
Low Variance at large scales of WMAP 9 year data
Gruppuso A. et al., 2013, JCAP, 07, 047; arXiv:1304.5493
work page internal anchor Pith review Pith/arXiv arXiv 2013
-
[27]
Gon c alves T. S., Martin D. C., Men \'e ndez-Delmestre K., Wyder T. K., Koekemoer A., 2012, , 759, 67; arXiv:1209.4084
work page internal anchor Pith review Pith/arXiv arXiv 2012
-
[28]
Gon c alves R. S. et al., 2018a, MNRAS, 475, L20; arXiv:1710.02496
work page internal anchor Pith review Pith/arXiv arXiv
- [29]
-
[30]
The Arecibo Legacy Fast ALFA Survey: The ALFALFA Extragalactic HI Source Catalog
Haynes M. P., et al., 2018, , 861, 49; arXiv:1805.11499
work page internal anchor Pith review Pith/arXiv arXiv 2018
-
[31]
Hoyle B., Tojeiro R., Jimenez R., Heavens A., Clarkson C., Maartens R., 2013, ApJL, 762, L9; arXiv:1209.6181
work page internal anchor Pith review Pith/arXiv arXiv 2013
- [32]
-
[33]
A 14 $h^{-3}$ Gpc$^3$ study of cosmic homogeneity using BOSS DR12 quasar sample
Laurent P. et al., 2016, JCAP, 11, 060; arXiv:1602.09010
work page internal anchor Pith review Pith/arXiv arXiv 2016
-
[34]
Lewis A., Challinor A., Lasenby A., 2000, ApJ, 538, 473; astro-ph/9911177
work page internal anchor Pith review Pith/arXiv arXiv 2000
-
[35]
Maartens R., 2011, Phil. Trans. Roy. Soc. London, A369, 5115; arXiv:1104.1300
work page internal anchor Pith review Pith/arXiv arXiv 2011
-
[36]
Marques G. A. et al., 2018, MNRAS, 473, 165; arXiv:1708.09793
work page internal anchor Pith review Pith/arXiv arXiv 2018
-
[37]
Nadathur S., 2013, MNRAS, 434, 398; arXiv:1306.1700
work page internal anchor Pith review Pith/arXiv arXiv 2013
-
[38]
Nesseris S., Trashorras M., 2019, Phys. Rev. D, 99, 063539; arXiv:1901.02400
work page internal anchor Pith review Pith/arXiv arXiv 2019
-
[39]
Local analyses of Planck maps with Minkowski Functionals
Novaes C. P., Bernui A., Marques G. A., Ferreira I. S., 2016, MNRAS, 461, 1363; arXiv:1606.04075
work page internal anchor Pith review Pith/arXiv arXiv 2016
-
[40]
Tomographic local 2D analyses of the WISExSuperCOSMOS all-sky galaxy catalogue
Novaes C. P., Bernui A., Xavier H. S., Marques G. A., 2018, MNRAS, 478, 3253; arXiv:1805.04078
work page internal anchor Pith review Pith/arXiv arXiv 2018
-
[41]
Exploring cosmic homogeneity with the BOSS DR12 galaxy sample
Ntelis P. et al., 2017, JCAP, 06, 019; arXiv:1702.02159
work page internal anchor Pith review Pith/arXiv arXiv 2017
-
[42]
The scale of cosmic homogeneity as a standard ruler
Ntelis P. et al., 2018, JCAP, 12, 014; arXiv:1810.09362v2
work page internal anchor Pith review Pith/arXiv arXiv 2018
- [43]
-
[44]
Pandey B., Sarkar S., 2015, MNRAS, 454, 2647; arXiv:1507.03124
work page internal anchor Pith review Pith/arXiv arXiv 2015
-
[45]
Papastergis E. et al., 2013, ApJ, 776, 43; arXiv:1308.2661
work page internal anchor Pith review Pith/arXiv arXiv 2013
-
[46]
Clustering of HI galaxies in HIPASS and ALFALFA
Passmoor S. S., Cress C. M., Faltenbacher A., 2011, MNRAS, 412, L50; arXiv:1101.5007
work page internal anchor Pith review Pith/arXiv arXiv 2011
-
[47]
Polastri L., Gruppuso A., Natoli P., 2015, JCAP, 04, 018; arXiv:1503.01611
work page internal anchor Pith review Pith/arXiv arXiv 2015
- [48]
-
[49]
R \'ipa J., Shafiello A., 2017, ApJ, 851, 15; arXiv:1706.03556
work page internal anchor Pith review Pith/arXiv arXiv 2017
-
[50]
R \'ipa J., Shafiello A., 2018; arXiv:1809.03973
work page internal anchor Pith review Pith/arXiv arXiv 2018
-
[51]
Sarkar S., Pandey B., Khatri R., 2019, MNRAS, 483, 2453; arXiv:1810.07410
work page internal anchor Pith review Pith/arXiv arXiv 2019
-
[52]
Sarkar P., Majumdar S., Pandey B., Kedia A., Sarkar S., 2016; arXiv:1611.07915
work page internal anchor Pith review Pith/arXiv arXiv 2016
-
[53]
Sarkar S., Pandey B., 2018; arXiv:1812.03661
work page internal anchor Pith review Pith/arXiv arXiv 2018
-
[54]
Scharf C. A. et al., 2000, ApJ, 544, 49; arXiv:astro-ph/9908187
work page internal anchor Pith review Pith/arXiv arXiv 2000
-
[55]
Maps of Dust IR Emission for Use in Estimation of Reddening and CMBR Foregrounds
Schlegel D. J., Finkbeiner D. P., Davis M., 1998, , 500, 525; arXiv:astro-ph/9710327
work page internal anchor Pith review Pith/arXiv arXiv 1998
-
[56]
Schwarz D. J., Copi C. J., Huterer D., Starkman G. D., 2016, Classical and Quantum Gravity, 33, 184001; arXiv:1510.07929
work page internal anchor Pith review Pith/arXiv arXiv 2016
-
[57]
Scrimgeour M. I. et al., 2012, MNRAS, 425, 116; arXiv:1205.6812
work page internal anchor Pith review Pith/arXiv arXiv 2012
-
[58]
The nature of extremely red galaxies in the local universe
Sodr \'e L., Ribeiro da Silva A., Santos W. A., 2013, , 434, 2503; arXiv:1306.6552
work page internal anchor Pith review Pith/arXiv arXiv 2013
- [59]
-
[60]
Xavier H. S., Costa-Duarte M. V., Balaguera-Antol\' nez A., Bilicki M., 2018; arXiv:1812.08182
-
[61]
Yoon M., Huterer D., Gibelyou C., Kov\'acs A., Szapudi I., 2014, MNRAS, 445, L60; arXiv:1406.1187
work page internal anchor Pith review Pith/arXiv arXiv 2014
-
[62]
York D. G. et al., 2000, AJ, 120, 1579; arXiv:astro-ph/0006396
work page internal anchor Pith review Pith/arXiv arXiv 2000
discussion (0)
Sign in with ORCID, Apple, or X to comment. Anyone can read and Pith papers without signing in.