Performance of the Cherenkov Telescope Array
Pith reviewed 2026-05-24 20:14 UTC · model grok-4.3
The pith
Monte Carlo simulations establish the expected performance of the Cherenkov Telescope Array at its La Palma and Paranal sites.
A machine-rendered reading of the paper's core claim, the machinery that carries it, and where it could break.
Core claim
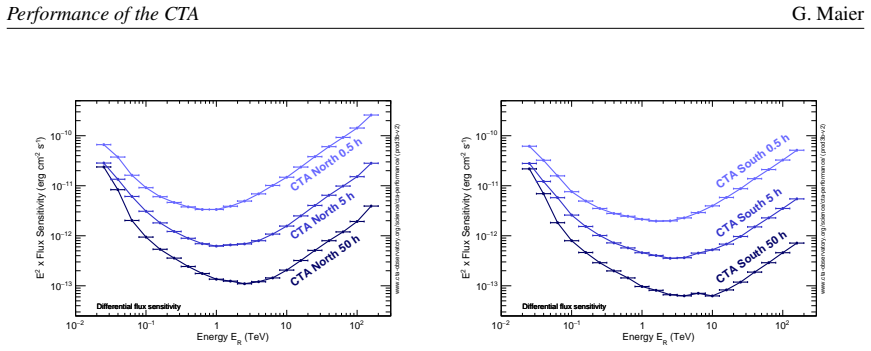
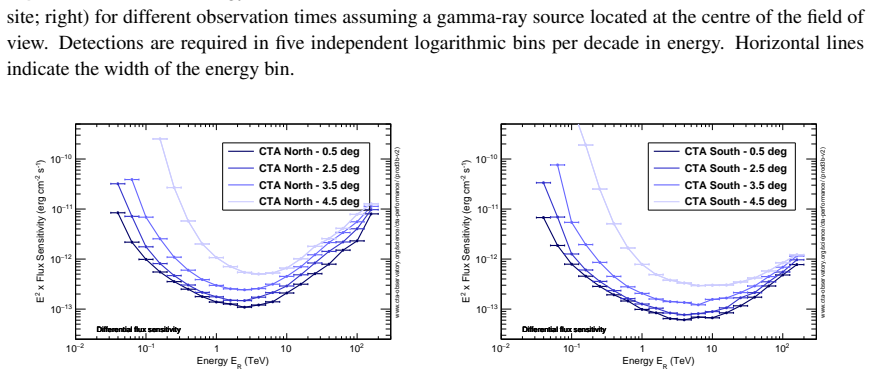
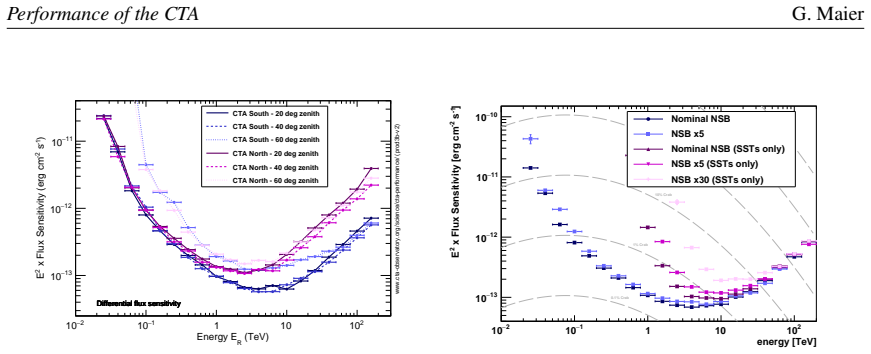
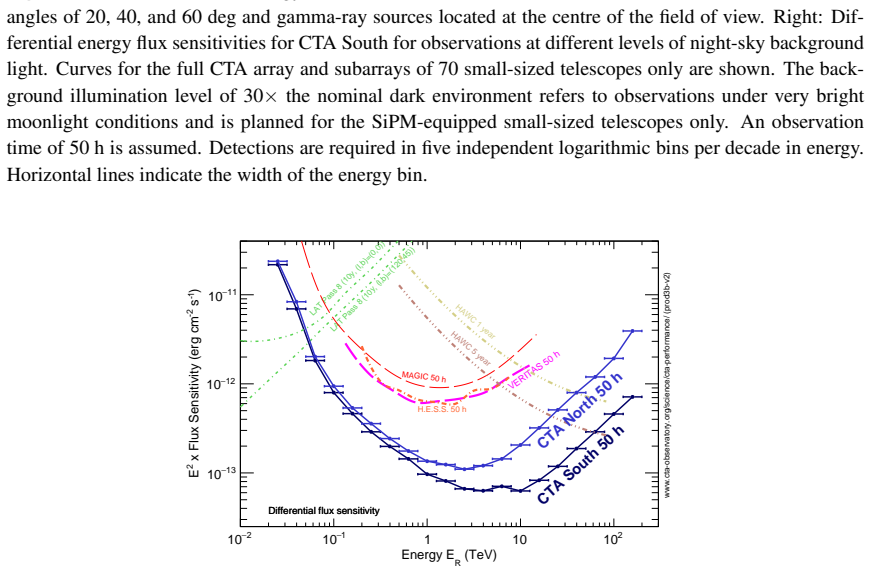
The performance of the future observatory derived from detailed Monte Carlo simulations is presented for the two CTA sites located on the island of La Palma and near Paranal. This includes the evaluation of CTA sensitivity over observations pointing towards different elevations and for operations at higher night-sky background light levels.
What carries the argument
Detailed Monte Carlo simulations modeling telescope response, atmospheric effects, and night-sky background to compute sensitivity metrics.
If this is right
- The array can detect gamma rays from extremely faint sources with high precision on energy and direction.
- Sensitivity holds across the energy range from 20 GeV to more than 300 TeV at both sites.
- Performance varies with observation elevation but remains usable at higher night-sky background levels.
Where Pith is reading between the lines
- Real observations from the completed array can directly test and refine these simulation predictions.
- Site differences in performance may affect choices for long-term observation scheduling and analysis methods.
- The same simulation framework could evaluate proposed changes to array layout or instrument upgrades.
Load-bearing premise
The Monte Carlo simulations accurately capture the real telescope response, atmospheric effects, and night-sky background conditions at the two sites.
What would settle it
Comparison of the simulated sensitivity curves and performance metrics with actual data collected once the Cherenkov Telescope Array begins operations.
Figures


read the original abstract
The Cherenkov Telescope Array (CTA) is expected to become the by far largest and most sensitive observatory for very-high-energy gamma rays in the energy range from 20 GeV to more than 300 TeV. CTA will be capable of detecting gamma rays from extremely faint sources with unprecedented precision on energy and direction. The performance of the future observatory derived from detailed Monte Carlo simulations is presented in this contribution for the two CTA sites located on the island of La Palma (Spain) and near Paranal (Chile). This includes the evaluation of CTA sensitivity over observations pointing towards different elevations and for operations at higher night-sky background light levels.
Editorial analysis
A structured set of objections, weighed in public.
Referee Report
Summary. The paper claims that the performance of the Cherenkov Telescope Array (CTA) observatory—including sensitivity, angular resolution, and energy resolution—for the La Palma (Spain) and Paranal (Chile) sites is derived from detailed Monte Carlo simulations. These results are presented for observations at varying elevations and under conditions of elevated night-sky background light levels, spanning the energy range from 20 GeV to over 300 TeV.
Significance. If the Monte Carlo simulations are shown to be reliable, the reported performance metrics would serve as essential reference values for planning CTA observations, estimating detection capabilities for faint sources, and optimizing array configurations at the two sites. The inclusion of elevation and NSB variations adds practical value for real-world operations.
major comments (1)
- [Abstract] Abstract: The central claim states that performance figures are 'derived from detailed Monte Carlo simulations' with no accompanying information on validation against real data from existing IACTs (e.g., MAGIC at La Palma). This is load-bearing for the claim that the sensitivities represent actual future observatory performance, because unvalidated modeling of telescope response, atmospheric extinction, or site-specific NSB could introduce systematic offsets not captured in the presented numbers.
Simulated Author's Rebuttal
We thank the referee for their review and for highlighting the importance of simulation validation. We respond to the single major comment below.
read point-by-point responses
-
Referee: [Abstract] Abstract: The central claim states that performance figures are 'derived from detailed Monte Carlo simulations' with no accompanying information on validation against real data from existing IACTs (e.g., MAGIC at La Palma). This is load-bearing for the claim that the sensitivities represent actual future observatory performance, because unvalidated modeling of telescope response, atmospheric extinction, or site-specific NSB could introduce systematic offsets not captured in the presented numbers.
Authors: The manuscript presents performance predictions obtained from Monte Carlo simulations of the future CTA arrays; it does not claim that these numbers have been directly validated with CTA data, as the observatory is not yet operational. The underlying simulation tools and atmospheric models have been validated against data from existing IACTs (including MAGIC at La Palma) in a series of earlier dedicated studies. We will revise the manuscript to include an explicit reference to those validation papers in the introduction and to add a short clarifying sentence in the abstract and methods section. This addresses the concern without altering the scope of the present contribution. revision: partial
Circularity Check
No circularity: performance figures are direct outputs of external Monte Carlo simulations.
full rationale
The paper states that observatory performance (sensitivity, resolution) is obtained from detailed Monte Carlo simulations for the two sites. No equations, fitted parameters, or self-citations are shown that reduce any reported quantity to an input by construction. The modeling fidelity to real conditions is an external assumption, not a definitional loop. This matches the default expectation of a non-circular presentation of simulation results.
Axiom & Free-Parameter Ledger
axioms (1)
- domain assumption Monte Carlo simulations can accurately model the detection of gamma rays by Cherenkov telescopes under varying observational conditions.
Reference graph
Works this paper leans on
-
[1]
www.cta-observatory.org 5 Performance of the CTA G. Maier 2 −101 −101 10 2 10 (TeV) REnergy E13 −1012 −1011 −10)-1 s -2 x Flux Sensitivity (erg cm 2 E www.cta-observatory.org/science/cta-performance/ (prod3b-v2) Differential flux sensitivity Differential flux sensitivityDifferential flux sensitivityDifferential flux sensitivityDifferential flux sensitivit...
-
[2]
Funk, S. & Hinton, J. (The CTA Consortium), 2013, Astroparticle Physics, 43, 348
work page 2013
-
[3]
Bernlöhr, K. et al. (The CTA Consortium), 2013, Astroparticle Physics, 43, 171
work page 2013
-
[4]
Heck et al., CORSIKA: a Monte Carlo code to simulate extensive air showers, 1998, Tech
D. Heck et al., CORSIKA: a Monte Carlo code to simulate extensive air showers, 1998, Tech. Rep. FZKA 6019, Forschungszentrum Karlsruhe 6 Performance of the CTA G. Maier
work page 1998
-
[5]
Bernlöhr, K., 2008, Astroparticle Physics, 30, 149
work page 2008
-
[6]
Eventdisplay: An Analysis and Reconstruction Package for Ground-based Gamma-ray Astronomy
Maier, G. & Holder, J., 2017, PoS(ICRC2017)747. arXiv:1708.04048
work page internal anchor Pith review Pith/arXiv arXiv 2017
-
[7]
et al., 2009, Proceedings of the 31st International Cosmic Ray Conference, Łodz, arXiv:0907.0943
Moralejo, A., Gaug M., Carmona E. et al., 2009, Proceedings of the 31st International Cosmic Ray Conference, Łodz, arXiv:0907.0943
-
[8]
et al., 2017, Astroparticle Physics 93, 76
Hassan, T. et al., 2017, Astroparticle Physics 93, 76
work page 2017
-
[9]
Acharyya, A. et al. (The CTA Consortium), 2019, Astroparticle Physics 111, 35
work page 2019
-
[10]
The Cherenkov Telescope Array Consortium, Science with the Cherenkov Telescope Array
-
[11]
https://www.cta-observatory.org/science/cta-performance
-
[12]
http: //www.slac.stanford.edu/exp/glast/groups/canda/lat_Performance.htm
-
[13]
collaboration), 2015 Proceedings of the 34th ICRC (adapted)
Holler et al (The H.E.S.S. collaboration), 2015 Proceedings of the 34th ICRC (adapted)
work page 2015
-
[14]
Aleksi ´c, J. et al. (The MAGIC Collaboration, 2016 Astroparticle Physics 72, 76
work page 2016
-
[15]
http://veritas.sao.arizona.edu/about-veritas-mainmenu-81/ veritas-specifications-mainmenu-111
-
[16]
Abeysekara, A.U. et al. (The HAWC Collaboration), 2017, ApJ 843, 39 (World Scientific Publishing, 2019), ISBN 978-981-3270-08-4, arXiv: 1709.07997 7
work page internal anchor Pith review Pith/arXiv arXiv 2017
discussion (0)
Sign in with ORCID, Apple, or X to comment. Anyone can read and Pith papers without signing in.