pith. sign in

arxiv: 1907.10368 · v1 · pith:MPZLYWZUnew · submitted 2019-07-24 · ✦ hep-ex · nucl-ex

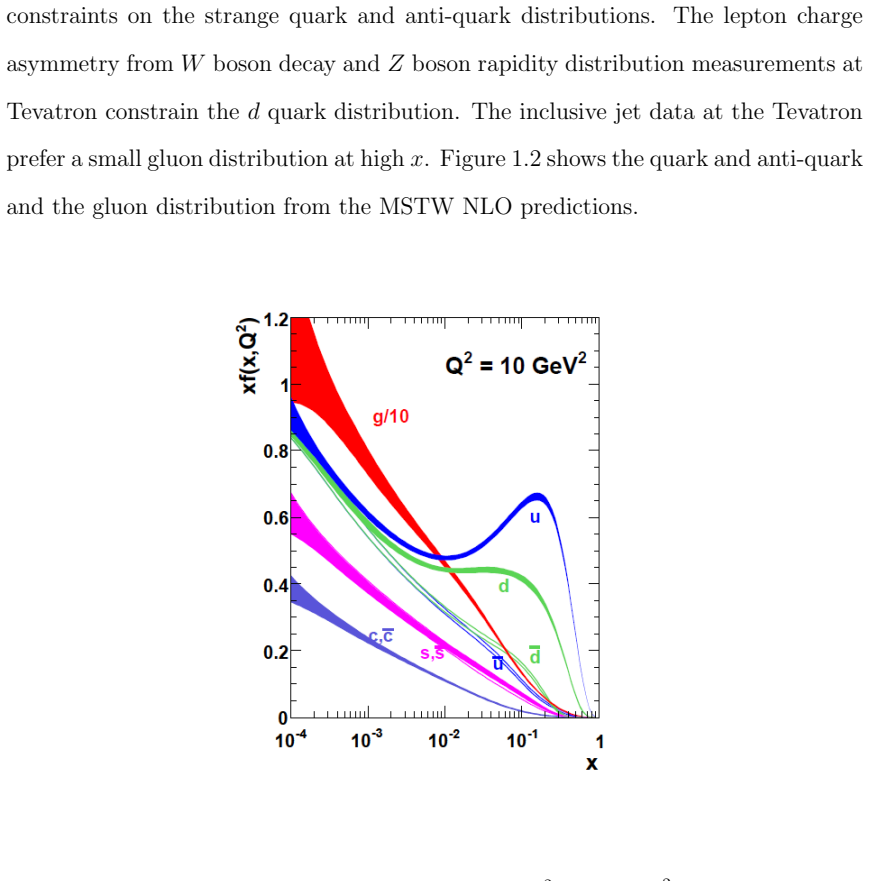
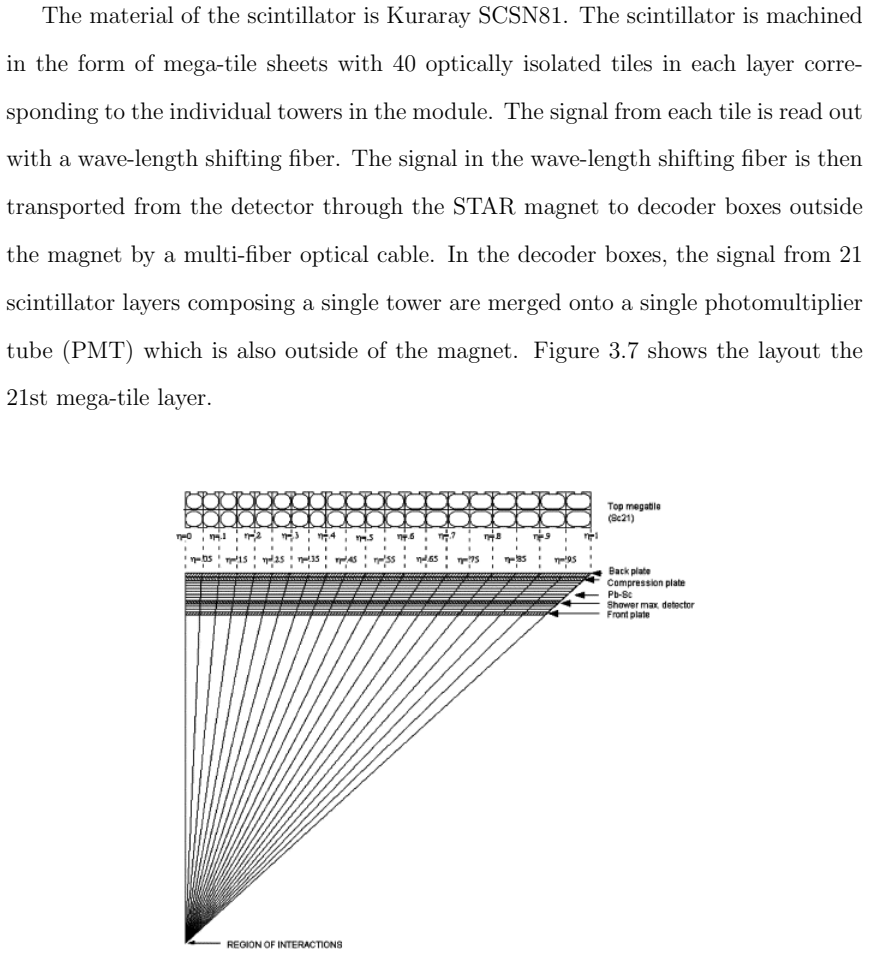
Inclusive Jet Longitudinal Double-spin Asymmetry A_(LL) Measurements in 510 GeV Polarized pp Collisions at STAR

Pith reviewed 2026-05-24 16:48 UTC · model grok-4.3

classification ✦ hep-ex nucl-ex
keywords inclusive jetdouble-spin asymmetrygluon polarizationpolarized PDFsRHICSTAR experiment510 GeV pp collisionsproton spin
0
0 comments X

The pith

The first inclusive jet A_LL measurement at 510 GeV in polarized pp collisions extends gluon polarization constraints to x approximately 0.02.

A machine-rendered reading of the paper's core claim, the machinery that carries it, and where it could break.

This paper presents the initial measurement of the longitudinal double-spin asymmetry A_LL for inclusive jet production in proton-proton collisions at a center-of-mass energy of 510 GeV using data recorded by STAR in 2012. The higher beam energy reaches smaller momentum fractions x for the gluon inside the proton compared to prior 200 GeV runs. Several new analysis methods were introduced to control systematic uncertainties given the high statistics and small size of the asymmetries, including underlying event subtraction in jet reconstruction, refined bias corrections, optimized PYTHIA Monte Carlo tuning, and uncertainty estimation for tune parameters. The extracted A_LL values as a function of jet transverse momentum agree with predictions from recent global polarized parton distribution function analyses that already included earlier RHIC data, and they also match previous STAR results at 200 GeV where the kinematic regions overlap. These results supply additional data points that will tighten constraints on the polarized gluon distribution at lower x.

Core claim

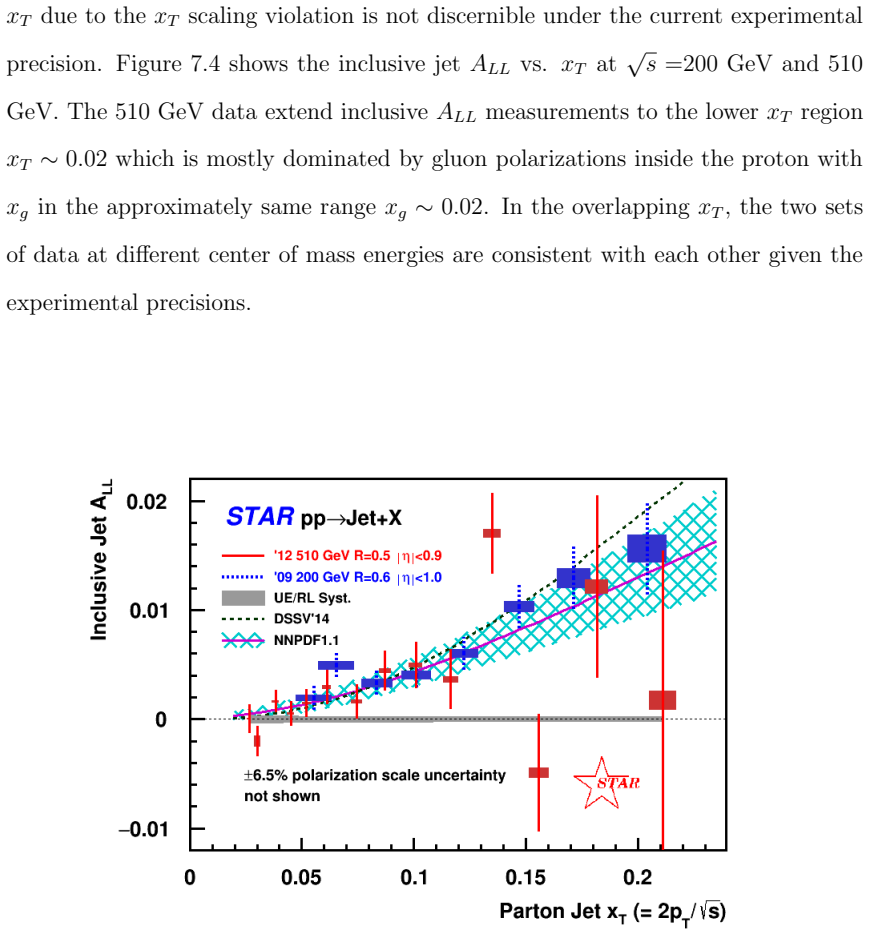
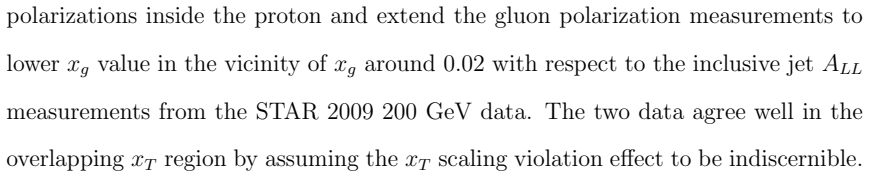
The results for inclusive jet A_LL versus jet p_T in 510 GeV pp collisions are consistent with predictions from recent global analyses of the polarized PDFs that included prior RHIC data in the fit and are also consistent with the previous STAR inclusive jet A_LL measurements at sqrt(s) = 200 GeV in the overlapping kinematic region, thereby providing new constraints on gluon polarization in the proton at x values below those sampled at 200 GeV.

What carries the argument

The longitudinal double-spin asymmetry A_LL extracted for inclusive jets, which directly probes the polarized gluon distribution Delta g(x) through the difference in cross sections for parallel versus antiparallel proton beam helicities.

If this is right

  • The data will be included in future global fits of polarized parton distributions to refine the gluon polarization contribution at low x.
  • Consistency with 200 GeV results in the overlap region supports the reliability of the asymmetry extraction across different beam energies.
  • The improved analysis techniques reduce uncertainties and can be applied to higher-statistics datasets for greater precision.
  • The measurement covers a kinematic range that fills a gap in existing constraints on Delta g(x) from RHIC experiments.

Where Pith is reading between the lines

These are editorial extensions of the paper, not claims the author makes directly.

  • If the consistency persists under updated global fits, the gluon spin contribution at x below 0.02 is likely small or positive, narrowing the range of possible proton spin decompositions.
  • The same jet reconstruction and bias-correction methods could be extended to other spin-dependent observables such as di-jet or photon-jet asymmetries at similar energies.
  • A mismatch in future fits would point to either missing higher-order QCD effects or limitations in the current Monte Carlo modeling of polarized processes.

Load-bearing premise

The new analysis procedures including underlying event subtraction, trigger bias estimation, PYTHIA tune optimization, and tune-parameter uncertainty estimation correctly reduce systematic uncertainties without introducing new biases.

What would settle it

A statistically significant deviation between the measured A_LL points and the global polarized PDF predictions specifically in the newly accessed low-x region at 510 GeV would indicate that the consistency claim does not hold.

Figures

Figures reproduced from arXiv: 1907.10368 by Zilong Chang.

Figure 1.1
Figure 1.1. Figure 1.1: The NLO HERAPDF 2.0 fits where xS = 2x(¯u+ ¯d+ ¯s) at Q2 = 10 GeV2 [21]. The NLO CT14 fit is another global QCD analysis from the CTEQ collaboration, based upon its several previous versions such as CT10, CTEQ6, and so on [22, 23, 24]. Not only does it have the DIS data from HERA, the lepton asymmetry from W boson and inclusive jet data from the Tevatron, Drell-Yan measurements from E866, but it also inc… view at source ↗
Figure 1.2
Figure 1.2. Figure 1.2: The NLO MSTW fits at Q2 = 10 GeV2 [25]. The neural network technique is also applied to determine the PDFs, such as the NNPDF model [26]. The NNPDF group has produced its most recent version NNPDF3.0 with LHC data. However in this document, the older version NNPDF2.3 is chosen as the reference for the un-polarized proton PDF. The NNPDF2.3 uses DIS data from HERA and fixed-target experiments, Drell-Yan da… view at source ↗
Figure 1.3
Figure 1.3. Figure 1.3: x∆G(x) predicted by BB model with other global models at Q2 = 4 GeV2 [46]. The LSS model named after its authors, Leader, Sidorov and Stamenov, is another global analysis by including polarized DIS experimental data to extract the polarized PDF inside the proton [47]. It takes inclusive DIS and semi-inclusive data as its input, for example data from EMC, HERMES and COMPASS, as well as lower-Q2 data from … view at source ↗
Figure 1.4
Figure 1.4. Figure 1.4: x∆G(x) predicted by LSS model with at Q2 = 2.5 GeV2 [47]. The global analysis developed by de Florian, Sassot, Stratmann and Vogelsang, known as the DSSV models, uses not only the inclusive DIS and semi-inclusive DIS data but also hadronic collider data from RHIC to extract the polarized PDFs [48, 49, 50]. Data from EMC, HERMES and COMPASS are included in their analysis as well as the inclusive π 0 data … view at source ↗
Figure 1.5
Figure 1.5. Figure 1.5: x∆G(x) predicted by DSSV with (red) and without (blue) 2009 RHIC data and an earlier version of its fit (dashed) at Q2 = 10 GeV2 [50]. Like the un-polarized PDFs, the NNPDF group also provides their polarized PDFs by using the same techniques [51]. In their earlier version, NNPDF1.0 the inclusive DIS data were only included so it could not separate the parton distributions between quarks and anti-quarks … view at source ↗
Figure 1.6
Figure 1.6. Figure 1.6: x∆G(x) predicted by NNPDF1.1 and NNPDF1.0 at Q2 = 10 GeV2 [51]. Another comprehensive global QCD analysis of spin-dependent parton distribu￾16 [PITH_FULL_IMAGE:figures/full_fig_p031_1_6.png] view at source ↗
Figure 2.1
Figure 2.1. Figure 2.1: Feynman diagram for the gg (red), qg (blue) and qq (green) sub processes. For un-polarized collisions, the inclusive jet cross-section is measured to extract un-polarized PDFs in the proton. The cross-section of inclusive jet can be expressed 18 [PITH_FULL_IMAGE:figures/full_fig_p033_2_1.png] view at source ↗
Figure 2.2
Figure 2.2. Figure 2.2: Comparison of jet yields vs. jet pT from pp collisions at √ s = 200 GeV [61]. 24 [PITH_FULL_IMAGE:figures/full_fig_p039_2_2.png] view at source ↗
Figure 2.3
Figure 2.3. Figure 2.3: Comparison of jet transverse energy fraction within a cone radius of ∆ [PITH_FULL_IMAGE:figures/full_fig_p040_2_3.png] view at source ↗
Figure 2.4
Figure 2.4. Figure 2.4: STAR 2006 inclusive jet cross-section from [PITH_FULL_IMAGE:figures/full_fig_p041_2_4.png] view at source ↗
Figure 2.5
Figure 2.5. Figure 2.5: STAR 2006 inclusive jet cross-section from [PITH_FULL_IMAGE:figures/full_fig_p042_2_5.png] view at source ↗
Figure 2.6
Figure 2.6. Figure 2.6: STAR 2009 inclusive jet cross-section from [PITH_FULL_IMAGE:figures/full_fig_p043_2_6.png] view at source ↗
Figure 2.7
Figure 2.7. Figure 2.7: Inclusive jet cross-section fractions due to subprocesses [PITH_FULL_IMAGE:figures/full_fig_p044_2_7.png] view at source ↗
Figure 2.8
Figure 2.8. Figure 2.8: STAR 2006 inclusive jet ALL from longitudinally polarized pp collisions at √ s = 200 GeV [61]. In the year 2009, STAR collected a large data sample of 200 GeV longitudinally polarized pp data during the RHIC run. The event statistics used in the inclusive jet ALL analysis was about 20 times larger than the 2006 analysis. This arose from increases in the trigger rates enabled by improvement to the data ac… view at source ↗
Figure 2.9
Figure 2.9. Figure 2.9: STAR 2009 inclusive jet longitudinal ALL at √ s = 200 GeV [66]. The results of the STAR 2009 inclusive jet ALL is shown in [PITH_FULL_IMAGE:figures/full_fig_p046_2_9.png] view at source ↗
Figure 3.1
Figure 3.1. Figure 3.1: The layout of RHIC facility for plarized proton operation [67, 68]. [PITH_FULL_IMAGE:figures/full_fig_p048_3_1.png] view at source ↗
Figure 3.2
Figure 3.2. Figure 3.2: H-jet polarimeter layout [70]. 3.2 STAR Detectors The Solenoidal Tracker at RHIC (STAR) is a large detector system built at the 6 o’clock intersection point of the two rings [72]. The detectors at STAR are designed 35 [PITH_FULL_IMAGE:figures/full_fig_p050_3_2.png] view at source ↗
Figure 3.3
Figure 3.3. Figure 3.3: Cross sectional view of STAR detectors. 3.2.1 TPC The TPC is the central part of the STAR detector system [73]. It is a cylindrical detector with 4 m in diameter and 4.2 m in length built around the beam-line. Thousands of particles can be produced after high center of mass energy heavy-ion collisions. The charged particles of them are deflected by the STAR magnet in a helical motion. The TPC is able to … view at source ↗
Figure 3
Figure 3. Figure 3: shows the layout of the STAR TPC. It consists of a central membrane, [PITH_FULL_IMAGE:figures/full_fig_p052_3.png] view at source ↗
Figure 3.4
Figure 3.4. Figure 3.4: The layout of the STAR TPC [73]. The readout endcaps are based on Multi-Wire Proportional Chambers (MWPC) with readout pads. The drift electrons avalanche in the high fields due to the 20 µm anode wire, then the created positive ions in the avalanche induce image charges on the pads, and the image charges are read out by the digital system. There are 12 read out sectors arranged on a clock on each side o… view at source ↗
Figure 3.5
Figure 3.5. Figure 3.5: The design of a TPC readout sector at both endcaps [73]. [PITH_FULL_IMAGE:figures/full_fig_p054_3_5.png] view at source ↗
Figure 3.6
Figure 3.6. Figure 3.6: The side view of the BEMC module [74]. The BEMC consist of lead-scintillator stack with 20 layers of 5 mm thick lead and 21 layers of scintillators. The first 2 layers are 6 mm thick and the last 19 layers are 5 mm thick. The lead-scintillator stacks are held together between the front and back plates. The SMD is located between the fifth lead layer and the sixth scintillator layer. It is a gas amplifica… view at source ↗
Figure 3.7
Figure 3.7. Figure 3.7: The side view of the BEMC module and layout of the 21st scintillator [PITH_FULL_IMAGE:figures/full_fig_p056_3_7.png] view at source ↗
Figure 3
Figure 3. Figure 3: shows the one half of the STAR EEMC with the schematic tower [PITH_FULL_IMAGE:figures/full_fig_p057_3.png] view at source ↗
Figure 3.8
Figure 3.8. Figure 3.8: STAR EEMC with the schematic tower structure on the left and the cut [PITH_FULL_IMAGE:figures/full_fig_p058_3_8.png] view at source ↗
Figure 3
Figure 3. Figure 3: shows the structure of the STAR BBC. There are two annuli of scin [PITH_FULL_IMAGE:figures/full_fig_p059_3.png] view at source ↗
Figure 3.9
Figure 3.9. Figure 3.9: Front view of STAR BBC annuli [76]. 3.2.5 ZDC The ZDC is intended to detect evaporation neutrons from heavy-ion collisions at small angles close to the beam-line, θ < 4 mrad [77]. ZDCs are located at the east and west sides of the collision center. Each ZDC has three modules with each 10 cm in width and 13.6 cm in length. The ZDC module has multiple alternating quartz and tungsten layers. The tungsten pl… view at source ↗
Figure 3.10
Figure 3.10. Figure 3.10: The STAR VPD detector [78]. 46 [PITH_FULL_IMAGE:figures/full_fig_p061_3_10.png] view at source ↗
Figure 4.1
Figure 4.1. Figure 4.1: Beam polarization vs. run number where runs in this plot are those runs [PITH_FULL_IMAGE:figures/full_fig_p066_4_1.png] view at source ↗
Figure 4
Figure 4. Figure 4: shows the bunch crossing distribution for the east single hits, the west [PITH_FULL_IMAGE:figures/full_fig_p075_4.png] view at source ↗
Figure 4.2
Figure 4.2. Figure 4.2: Probabilities to find the various hit combinations from the VPD. [PITH_FULL_IMAGE:figures/full_fig_p076_4_2.png] view at source ↗
Figure 4.3
Figure 4.3. Figure 4.3: Probabilities to find the various hit combinations from the BBC. [PITH_FULL_IMAGE:figures/full_fig_p077_4_3.png] view at source ↗
Figure 4.4
Figure 4.4. Figure 4.4: Probabilities to find the various hit combinations from the ZDC. [PITH_FULL_IMAGE:figures/full_fig_p078_4_4.png] view at source ↗
Figure 4.5
Figure 4.5. Figure 4.5: Bunch crossing distributions for the defined VPD east, west and coinci [PITH_FULL_IMAGE:figures/full_fig_p079_4_5.png] view at source ↗
Figure 4.6
Figure 4.6. Figure 4.6: Bunch crossing distributions for the defined VPD east, west and coinci [PITH_FULL_IMAGE:figures/full_fig_p080_4_6.png] view at source ↗
Figure 4.7
Figure 4.7. Figure 4.7: Bunch crossing distributions for the defined VPD east, west and coinci [PITH_FULL_IMAGE:figures/full_fig_p081_4_7.png] view at source ↗
Figure 4.8
Figure 4.8. Figure 4.8: ∆R1,2,3 calculated by ZDC east hits and VPD coincidence hits vs. run index (left) and the associated distributions (right). 69 [PITH_FULL_IMAGE:figures/full_fig_p084_4_8.png] view at source ↗
Figure 4.9
Figure 4.9. Figure 4.9: ∆R1,2,3 calculated by ZDC west hits and VPD coincidence hits vs. run index (left) and the associated distributions (right). 70 [PITH_FULL_IMAGE:figures/full_fig_p085_4_9.png] view at source ↗
Figure 4.10
Figure 4.10. Figure 4.10: ∆R1,2,3 calculated by ZDC coincidence hits and VPD coincidence hits vs. run index (left) and the associated distributions (right). 71 [PITH_FULL_IMAGE:figures/full_fig_p086_4_10.png] view at source ↗
Figure 4.11
Figure 4.11. Figure 4.11: ∆R1,2,3 calculated by VPD east hits and VPD coincidence hits vs. run index (left) and the associated distributions (right). 72 [PITH_FULL_IMAGE:figures/full_fig_p087_4_11.png] view at source ↗
Figure 4.12
Figure 4.12. Figure 4.12: ∆R1,2,3 calculated by VPD west hits and VPD coincidence hits vs. run index (left) and the associated distributions (right). 73 [PITH_FULL_IMAGE:figures/full_fig_p088_4_12.png] view at source ↗
Figure 4.13
Figure 4.13. Figure 4.13: R3 vs. run number where runs in this plot are those run selected in this analysis. 4.5 Jet Patch Trigger Setup The STAR BEMC and EEMC serve as the trigger detectors for high pT and jet event studies. A BEMC tower covers 0.05 × 0.05 in η and φ. A trigger patch in the BEMC consists of 4 × 4 BEMC towers covering 0.2 × 0.2 in η and φ. A jet patch is a defined 1.0 × 1.0 η-φ region, which is contributed by 5 … view at source ↗
Figure 4.14
Figure 4.14. Figure 4.14: BEMC DSM η − φ scheme. The jet patch formed in the EEMC is similar to what is formed in the BEMC. The segments of jet patches in a particular φ direction are matched with those in 76 [PITH_FULL_IMAGE:figures/full_fig_p091_4_14.png] view at source ↗
Figure 4
Figure 4. Figure 4: shows the EEMC trigger scheme in the full EEMC region. A level 0 [PITH_FULL_IMAGE:figures/full_fig_p092_4.png] view at source ↗
Figure 4.15
Figure 4.15. Figure 4.15: EEMC DSM η − φ scheme, seen from the West looking towards the center of STAR. At the level 2, the DSM board receives six input channels from the BEMC and two channels from the EEMC. Each of the six BEMC input channels has threshold bits for three BEMC jet patches and one jet patch sum. Each of the two EEMC input channels has threshold bits for three jet patches and one largest partial jet patch sum. The… view at source ↗
Figure 4.16
Figure 4.16. Figure 4.16: The ratio of number of tracks with the pT dependent three-dimensiona cut over these with the pT dependent two-dimensional cut for a low luminosity run at √ s = 500 GeV. 82 [PITH_FULL_IMAGE:figures/full_fig_p097_4_16.png] view at source ↗
Figure 4.17
Figure 4.17. Figure 4.17: The ratio of number of tracks with the pT dependent three-dimensional cut over these with the pT dependent two-dimensional cut for a high luminosity run at √ s = 500 GeV [PITH_FULL_IMAGE:figures/full_fig_p098_4_17.png] view at source ↗
Figure 4.18
Figure 4.18. Figure 4.18: The averaged number of jets per event vs. accidental and multiple [PITH_FULL_IMAGE:figures/full_fig_p102_4_18.png] view at source ↗
Figure 4.19
Figure 4.19. Figure 4.19: Jet pT vs. accidental and multiple corrected BBC rate for JP2 events. 87 [PITH_FULL_IMAGE:figures/full_fig_p102_4_19.png] view at source ↗
Figure 4.20
Figure 4.20. Figure 4.20: Jet neutral fraction Rt vs. accidental and multiple corrected BBC rate for JP2 events. The final selection criteria are determined by fitting the jet quantities as a function of collision rates with a second or third order polynominal form. The RMSs of the jet quantities relative to the fitted value are calculated. The runs that have at least one of the jet quantities inspected fall outside the fitted v… view at source ↗
Figure 4.21
Figure 4.21. Figure 4.21: The illustration of two off-axis cones relative to a jet. [PITH_FULL_IMAGE:figures/full_fig_p105_4_21.png] view at source ↗
Figure 4
Figure 4. Figure 4: shows 2-D distribution of the summed track and tower [PITH_FULL_IMAGE:figures/full_fig_p106_4.png] view at source ↗
Figure 4.22
Figure 4.22. Figure 4.22: The 2-D distribution of the summed track and tower [PITH_FULL_IMAGE:figures/full_fig_p106_4_22.png] view at source ↗
Figure 5
Figure 5. Figure 5: shows the comparison between the parton jet cross-section from the [PITH_FULL_IMAGE:figures/full_fig_p118_5.png] view at source ↗
Figure 5.1
Figure 5.1. Figure 5.1: Parton jet cross-sections from PYTHIA from the default Perugia 2012 [PITH_FULL_IMAGE:figures/full_fig_p118_5_1.png] view at source ↗
Figure 5.2
Figure 5.2. Figure 5.2: Sub process ratios from PYTHIA (solid line) are compared to those from [PITH_FULL_IMAGE:figures/full_fig_p119_5_2.png] view at source ↗
Figure 5.3
Figure 5.3. Figure 5.3: Particle jet cross-section vs. jet pT for the default Perugia 2012 tune and the Perugia 2012 tune with reduced exponent value at 0.213. 105 [PITH_FULL_IMAGE:figures/full_fig_p120_5_3.png] view at source ↗
Figure 5.4
Figure 5.4. Figure 5.4: Particle jet to parton jet matching ratio vs. jet [PITH_FULL_IMAGE:figures/full_fig_p121_5_4.png] view at source ↗
Figure 5.5
Figure 5.5. Figure 5.5: Off-aixs cone underlying event correction [PITH_FULL_IMAGE:figures/full_fig_p122_5_5.png] view at source ↗
Figure 5.6
Figure 5.6. Figure 5.6: The 2D distributions of the cone sum pT from the two off-axis cones dpT vs. jet pT for the Perugia 2012 tune with reduced exponent value at 0.213. 108 [PITH_FULL_IMAGE:figures/full_fig_p123_5_6.png] view at source ↗
Figure 5.7
Figure 5.7. Figure 5.7: The distribution of the sum of the two cone sum [PITH_FULL_IMAGE:figures/full_fig_p124_5_7.png] view at source ↗
Figure 5.8
Figure 5.8. Figure 5.8: The sum of the two cone sum pT from the two off-axis cones vs. the reconstructed jet pT for the matched and un-matched particle jets by using the Perugia 2012 tune with reduced exponent value at 0.213. 110 [PITH_FULL_IMAGE:figures/full_fig_p125_5_8.png] view at source ↗
Figure 5.9
Figure 5.9. Figure 5.9: Particle jet to parton jet matching ratio vs. jet [PITH_FULL_IMAGE:figures/full_fig_p126_5_9.png] view at source ↗
Figure 5.10
Figure 5.10. Figure 5.10: JP0, JP1 and JP2 jet pT distribution comparisons between data and embedding. 112 [PITH_FULL_IMAGE:figures/full_fig_p127_5_10.png] view at source ↗
Figure 5.11
Figure 5.11. Figure 5.11: JP0, JP1 and JP2 jet η distribution comparisons between data and embedding. 113 [PITH_FULL_IMAGE:figures/full_fig_p128_5_11.png] view at source ↗
Figure 5.12
Figure 5.12. Figure 5.12: JP0, JP1 and JP2 jet φ distribution comparisons between data and embedding. 114 [PITH_FULL_IMAGE:figures/full_fig_p129_5_12.png] view at source ↗
Figure 5.13
Figure 5.13. Figure 5.13: JP0, JP1 and JP2 jet tower multiplicity distribution comparisons be [PITH_FULL_IMAGE:figures/full_fig_p130_5_13.png] view at source ↗
Figure 5.14
Figure 5.14. Figure 5.14: JP0, JP1 and JP2 jet track multiplicity distribution comparisons be [PITH_FULL_IMAGE:figures/full_fig_p131_5_14.png] view at source ↗
Figure 5.15
Figure 5.15. Figure 5.15: JP0, JP1 and JP2 jet Rt distribution comparisons between data and embedding. 117 [PITH_FULL_IMAGE:figures/full_fig_p132_5_15.png] view at source ↗
Figure 5.16
Figure 5.16. Figure 5.16: JP0, JP1 and JP2 jet tower pT distribution comparisons between data and embedding. 118 [PITH_FULL_IMAGE:figures/full_fig_p133_5_16.png] view at source ↗
Figure 5.17
Figure 5.17. Figure 5.17: JP0, JP1 and JP2 jet track pT distribution comparisons between data and embedding. 119 [PITH_FULL_IMAGE:figures/full_fig_p134_5_17.png] view at source ↗
Figure 5.18
Figure 5.18. Figure 5.18: JP0, JP1 and JP2 jet off-axis correction [PITH_FULL_IMAGE:figures/full_fig_p135_5_18.png] view at source ↗
Figure 5.19
Figure 5.19. Figure 5.19: The distributions of tower pT inside the two off-axis cones are compared between data and embedding for JP0, JP1 and JP2 jets. 121 [PITH_FULL_IMAGE:figures/full_fig_p136_5_19.png] view at source ↗
Figure 5.20
Figure 5.20. Figure 5.20: The distributions of track pT inside the two off-axis cones are compared between data and embedding for JP0, JP1 and JP2 jets. 122 [PITH_FULL_IMAGE:figures/full_fig_p137_5_20.png] view at source ↗
Figure 5.21
Figure 5.21. Figure 5.21: The sum of tower multiplicities from the two off-axis cones profile vs. [PITH_FULL_IMAGE:figures/full_fig_p138_5_21.png] view at source ↗
Figure 5.22
Figure 5.22. Figure 5.22: The sum of track multiplicities from the two off-axis cones profile vs. [PITH_FULL_IMAGE:figures/full_fig_p139_5_22.png] view at source ↗
Figure 6.1
Figure 6.1. Figure 6.1: Falses asymmetries measured in the data before (black) and after (red) [PITH_FULL_IMAGE:figures/full_fig_p143_6_1.png] view at source ↗
Figure 6.2
Figure 6.2. Figure 6.2: Underlying event dpT in each jet pT bin before and after the underlying event correction. The dpT double spin asymmetry, A dpT LL is defined by A dpT LL = 1 PAPB (< dpT >++ + < dpT >−−) − (< dpT >+− + < dpT >−+) (< dpT >++ + < dpT >−−) + (< dpT >+− + < dpT >−+) , (6.11) where < dpT >++ is the measured mean underlying event correction dpT for the spin state ++ and similar definition for the other three sp… view at source ↗
Figure 6
Figure 6. Figure 6: shows the final measured [PITH_FULL_IMAGE:figures/full_fig_p144_6.png] view at source ↗
Figure 6.3
Figure 6.3. Figure 6.3: Underlying event dpT asymmetry measured in the data with a p0 fit in each jet pT bin after the jet pT corrected from the underlying events. To estimate the underlying event contribution, it is assumed that the underlying event adds extra energy to the jet, which effectively shifts the jet pT spectrum to the positive pT direction. Therefore for the jet cross-section with the same helicity ++, the jet cros… view at source ↗
Figure 6.4
Figure 6.4. Figure 6.4: Underlying event systematic (red), relative luminosity systematic (green) [PITH_FULL_IMAGE:figures/full_fig_p147_6_4.png] view at source ↗
Figure 6.5
Figure 6.5. Figure 6.5: Jet pT shift from the detector leve to the parton level. The trigger bias and reconstruction uncertainty is estimated by comparing the ALL found in every detector jet pT bin with the ALL found at the parton jet pT corresponding to the detector jet pT plus the pT shift obtained in the previous step. The ALL is calculated by first extracting the parton scattering kinematics, the Man￾delstam variables u,s, … view at source ↗
Figure 6
Figure 6. Figure 6: shows the spectra of the detector level [PITH_FULL_IMAGE:figures/full_fig_p154_6.png] view at source ↗
Figure 6.6
Figure 6.6. Figure 6.6: Inclusive jet ALL from embedding for JP0, JP1, JP2 triggered jets at the detector level and all the jets at the parton level. 140 [PITH_FULL_IMAGE:figures/full_fig_p155_6_6.png] view at source ↗
Figure 6.7
Figure 6.7. Figure 6.7: Jet yields a function of jet pT and bunch crossing numbers from zero-bias events [PITH_FULL_IMAGE:figures/full_fig_p161_6_7.png] view at source ↗
Figure 6.8
Figure 6.8. Figure 6.8: Fractions of good vertex found vs. bunch crossings (left) and track [PITH_FULL_IMAGE:figures/full_fig_p161_6_8.png] view at source ↗
Figure 6.9
Figure 6.9. Figure 6.9: Jet pT shift for 7% track loss (blue) and no track loss (red). 6.11 Jet pT Shift Uncertainties due to Tune Variations The jet pT shift uncertainties due to the PYTHIA is estimated in the analysis by utilizing the possible variants provided for Perugia 2012 in the PYTHIA version of 6.4.28. There are 13 other variants for Perugia 2012 tunes except the default tune. As shown in the [PITH_FULL_IMAGE:figures… view at source ↗
Figure 6.10
Figure 6.10. Figure 6.10: Jet pT shift vs. particle jet pT from the default Perugia 2012 tune and its variants The systematic uncertainty due to tune variation is estimated by taking the square root of quadrature sum of the difference of dpT for various tunes relative to the default tune. In exception, for the pair, 371 and 372, and the pair 376 and 377, the half of the absolute difference between the pairs is taken. For the oth… view at source ↗
Figure 6.11
Figure 6.11. Figure 6.11: Jet pT shift vs. particle jet pT from the default Perugia 2012 tune and its variants [PITH_FULL_IMAGE:figures/full_fig_p169_6_11.png] view at source ↗
Figure 7.1
Figure 7.1. Figure 7.1: The distribution of the number of jets triggered by the three triggers, [PITH_FULL_IMAGE:figures/full_fig_p172_7_1.png] view at source ↗
Figure 7.2
Figure 7.2. Figure 7.2: STAR 2012 inclusive jet ALL with its statistical and systematical un￾certainties. The results are compared with DSSV’14 [50] and NNPDF predictions [51]. 159 [PITH_FULL_IMAGE:figures/full_fig_p174_7_2.png] view at source ↗
Figure 7.3
Figure 7.3. Figure 7.3: Gluon momentum fraction xg sampled by the inclusive jet with detector jet pT between 7.0 and 8.2 GeV and by the parton jets with the same pT range. The measured inclusive jet ALL is compared with the STAR 2009 inclusive jet ALL results. Since the two measurements have different center of mass energy, 510 GeV and 200 GeV respectively, the ALL is compared on the scale of xT = 2 √ pT s . The xT is also an a… view at source ↗
Figure 7.4
Figure 7.4. Figure 7.4: STAR 2012 inclusive jet ALL vs. xT compared with STAR 2009 inclusive jet ALL results [66]. In conclusion, the STAR 2012 510 GeV inclusive jet ALL data explore gluon 162 [PITH_FULL_IMAGE:figures/full_fig_p177_7_4.png] view at source ↗
Figure 7
Figure 7. Figure 7: shows the 2012 results with the predictions from the 100 NNPDFpol1.1 [PITH_FULL_IMAGE:figures/full_fig_p178_7.png] view at source ↗
Figure 7.5
Figure 7.5. Figure 7.5: STAR 2012 inclusive jet ALL vs. pT compared with the predictions from the 100 NNPDFpol1.1 replicas [51]. 164 [PITH_FULL_IMAGE:figures/full_fig_p179_7_5.png] view at source ↗
read the original abstract

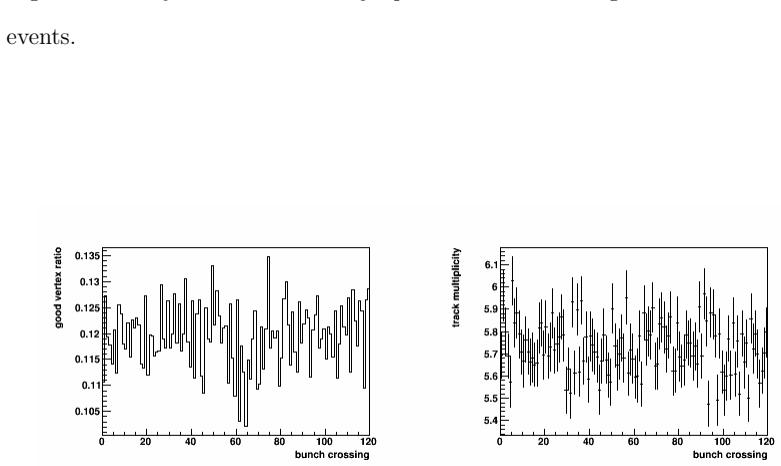
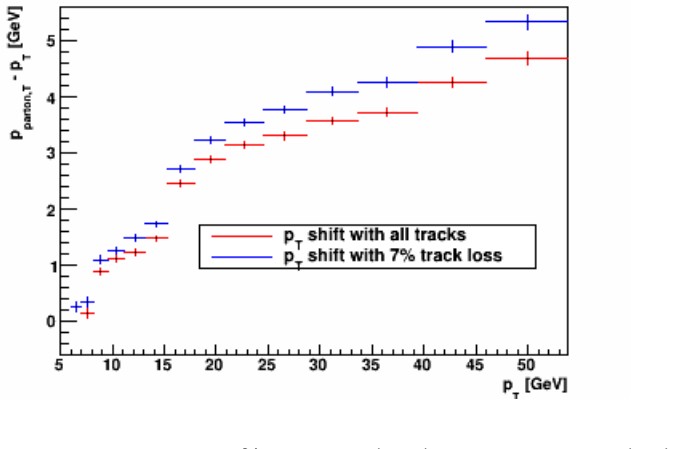
In this analysis, I perform the first ever measurement of \(A_{LL}\) for inclusive jet production in \(pp\) collisions at the higher beam energy of \(\sqrt{s}\) = 510 GeV, based on data that STAR recorded during 2012. The higher beam energy extends the sensitivity to gluon polarization down to \(x \sim 0.02\). The high statistics of the data set and the small size of the physics asymmetries, compared to the previous measurements at 200 GeV, required the development of several new or improved analysis procedures in order to minimize the systematic uncertainties. These include: the first implementation by STAR of an underlying event subtraction during jet reconstruction, a much improved technique to estimate the trigger and reconstruction bias effects, a detailed optimization of the PYTHIA tune that provides a much better match between the experimental data and simulated Monte Carlo events, and a new procedure to estimate the uncertainties associated with the PYTHIA tune parameters. The results for inclusive jet \(A_{LL}\) \textit{vs}.\@ jet \(p_T\) in 510 GeV \(pp\) collisions are presented. They are found to be consistent with predictions from recent global analyses of the polarized PDFs that included prior RHIC data in the fit. They are also consistent with the previous STAR inclusive jet \(A_{LL}\) measurements at \(\sqrt{s}\) = 200 GeV in the region where the kinematics for the two beam energies overlap. These results will provide important new constraints on the gluon polarization in the proton in the \(x\) region below that sampled in 200 GeV \(pp\) collisions.

Editorial analysis

A structured set of objections, weighed in public.

Desk editor's note, referee report, simulated authors' rebuttal, and a circularity audit. Tearing a paper down is the easy half of reading it; the pith above is the substance, this is the friction.

Referee Report

2 major / 1 minor

Summary. The manuscript reports the first measurement of the longitudinal double-spin asymmetry A_LL for inclusive jet production in 510 GeV polarized pp collisions using 2012 STAR data. It describes the development of four new or improved analysis procedures (underlying-event subtraction in jet reconstruction, trigger/reconstruction bias estimation, PYTHIA tune optimization, and tune-parameter uncertainty propagation) to handle the higher statistics and smaller asymmetries relative to prior 200 GeV measurements. The extracted A_LL vs. jet p_T results are stated to be consistent with recent global polarized-PDF fits that incorporate earlier RHIC data and with the previous STAR 200 GeV inclusive-jet A_LL measurements in the overlapping kinematic region, thereby extending constraints on gluon polarization to x ≲ 0.02.

Significance. If the measured A_LL values and their uncertainties are robust, the result supplies new experimental input on Δg(x) at low momentum fraction that was not accessible at 200 GeV, directly addressing a central goal of the RHIC spin program. The higher beam energy and increased luminosity make the data set a potentially valuable addition to global analyses of polarized parton distributions.

major comments (2)
  1. [Abstract] Abstract (paragraph on new procedures): The central consistency claim with global fits and with the 200 GeV data set rests on the assertion that the four new analysis steps reduce rather than shift the extracted A_LL. No quantitative demonstration (e.g., closure tests, data-MC comparisons before/after each correction, or bias-vs.-uncertainty tables) is referenced in the provided text; this validation is load-bearing for both the consistency statement and the claimed new constraint on Δg(x).
  2. [Analysis procedures] The manuscript must show that the PYTHIA tune optimization and its associated uncertainty propagation do not correlate with the A_LL extraction in a way that artificially improves agreement with the global fits; a dedicated section or appendix comparing A_LL obtained with the default versus optimized tune would be required.
minor comments (1)
  1. [Abstract] The abstract states that the results 'will provide important new constraints' but does not quantify the expected improvement in the uncertainty on the integrated gluon polarization; a brief statement of the projected impact on global-fit uncertainties would strengthen the significance paragraph.

Simulated Author's Rebuttal

2 responses · 0 unresolved

We thank the referee for the careful review and constructive comments on our manuscript. We address the major comments point-by-point below and outline the revisions we will make to strengthen the presentation of the analysis validation.

read point-by-point responses
  1. Referee: [Abstract] Abstract (paragraph on new procedures): The central consistency claim with global fits and with the 200 GeV data set rests on the assertion that the four new analysis steps reduce rather than shift the extracted A_LL. No quantitative demonstration (e.g., closure tests, data-MC comparisons before/after each correction, or bias-vs.-uncertainty tables) is referenced in the provided text; this validation is load-bearing for both the consistency statement and the claimed new constraint on Δg(x).

    Authors: We agree that explicit quantitative validation of the new procedures is essential to support the consistency claims. While the full manuscript contains data-MC comparisons and uncertainty evaluations within the individual procedure sections, we acknowledge that a consolidated summary of closure tests and before/after effects is not sufficiently highlighted. In the revised version we will add a dedicated subsection (or appendix) that tabulates the impact of each correction on the extracted A_LL, including closure-test results and bias-versus-uncertainty comparisons. This will explicitly demonstrate that the procedures reduce systematic uncertainties without shifting the central values. revision: yes

  2. Referee: [Analysis procedures] The manuscript must show that the PYTHIA tune optimization and its associated uncertainty propagation do not correlate with the A_LL extraction in a way that artificially improves agreement with the global fits; a dedicated section or appendix comparing A_LL obtained with the default versus optimized tune would be required.

    Authors: We will add the requested comparison in a new appendix. The appendix will present the A_LL results obtained with both the default and optimized PYTHIA tunes, together with the associated systematic uncertainties from the tune parameters. The comparison shows that the central A_LL values remain consistent within the quoted uncertainties; the optimization improves the modeling of jet observables and underlying-event activity but does not shift the asymmetry in a manner that artificially enhances agreement with global polarized-PDF fits. The uncertainty propagation follows a conservative envelope approach that is independent of the global-fit procedure. revision: yes

Circularity Check

0 steps flagged

No circularity: pure experimental measurement with external comparisons only

full rationale

This is an experimental paper reporting direct measurements of inclusive jet A_LL at 510 GeV. The abstract and text describe data collection, new analysis procedures for uncertainty reduction, and consistency checks against external global polarized-PDF fits (which incorporate prior RHIC data) plus overlapping prior STAR 200 GeV results. No equations, ansatzes, or fitted parameters are presented as predictions that reduce to the measurement inputs by construction. Self-citations to prior STAR work are limited to kinematic overlap comparisons and do not bear the load of any derivation. The paper is self-contained against external benchmarks; no load-bearing step matches any enumerated circularity pattern.

Axiom & Free-Parameter Ledger

1 free parameters · 1 axioms · 0 invented entities

Abstract-only; the analysis rests on standard high-energy physics assumptions plus new experimental corrections whose validity cannot be checked without the full text.

free parameters (1)
  • PYTHIA tune parameters
    Optimized to match experimental data; uncertainties on these parameters are newly estimated.
axioms (1)
  • domain assumption Underlying event subtraction and trigger/reconstruction bias corrections accurately remove experimental distortions.
    Cited as newly implemented or improved procedures required for the higher-statistics 510 GeV data set.

pith-pipeline@v0.9.0 · 5833 in / 1313 out tokens · 24237 ms · 2026-05-24T16:48:17.504361+00:00 · methodology

discussion (0)

Sign in with ORCID, Apple, or X to comment. Anyone can read and Pith papers without signing in.

Lean theorems connected to this paper

Citations machine-checked in the Pith Canon. Every link opens the source theorem in the public Lean library.

What do these tags mean?
matches
The paper's claim is directly supported by a theorem in the formal canon.
supports
The theorem supports part of the paper's argument, but the paper may add assumptions or extra steps.
extends
The paper goes beyond the formal theorem; the theorem is a base layer rather than the whole result.
uses
The paper appears to rely on the theorem as machinery.
contradicts
The paper's claim conflicts with a theorem or certificate in the canon.
unclear
Pith found a possible connection, but the passage is too broad, indirect, or ambiguous to say the theorem truly supports the claim.

Reference graph

Works this paper leans on

91 extracted references · 91 canonical work pages · 3 internal anchors

  1. [1]

    Zweig, CERN-TH-401 (1964)

    G. Zweig, CERN-TH-401 (1964)

  2. [2]

    Zweig, CERN-TH-412 (1964)

    G. Zweig, CERN-TH-412 (1964)

  3. [3]

    Gell-Mann, Phys

    M. Gell-Mann, Phys. Rev. Lett. 8, 214 (1964)

  4. [4]

    E. D. Bloom, D. H. Coward, H. DeStaebler, J. Drees, G. Miller, L. W. Mo, R. E. Taylor, M. Breidenbach, J. I. Friedman, G. C. Hartmann, and H. W. Kendall, Phys. Rev. Lett 23, 930 (1969)

  5. [5]

    Breidenbach, J

    M. Breidenbach, J. I. Friedman, H. W. Kendall, E. D. Bloom, D. H. Coward, H. DeStaebler, J. Drees, L. W. Mo, and R. E. Taylor, Phys. Rev. Lett 23, 935 (1969)

  6. [6]

    R. P. Feynman, Phys. Rev. Lett. 23, 1415 (1969)

  7. [7]

    J. D. Bjorken and E. A. Paschos, Phys. Rev. Lett. 185, 1975 (1969)

  8. [8]

    D. J. Gross and F. Wilczek, Phys. Rev. Lett. 30, 1343 (1973)

  9. [9]

    H. D. Politzer, Phys. Rev. Lett. 30, 1346 (1973)

  10. [10]

    V. N. Gribov and L. N. Lipatov, Sov. J. Nucl. Phys. 15, 438 (1972)

  11. [11]

    Y. L. Dokshitzer, Sov. Phys. JETP 46, 641 (1977)

  12. [12]

    Altarelli and G

    G. Altarelli and G. Parisi, Nucl. Phys. B 126, 298 (1977)

  13. [13]

    F. D. Aaron et al. (ZEUS and H1 Collaboration), 01, 109 (2010), arXiv:0911.0884 [hep-ex]

  14. [14]

    Aaltonen et al

    T. Aaltonen et al. (CDF Collaboration), Phys. Rev. D 78, 052006 (2008)

  15. [15]

    V. M. Abazov et al. (D0 Collaboration), Phys. Rev. D 85, 052006 (2012)

  16. [16]

    Acosta et al

    D. Acosta et al. (CDF Collaboration), Phys. Rev. D 71, 051104 (2005)

  17. [17]

    V. M. Abazov et al. (D0 Collaboration), Phys. Rev. Lett. 101, 211801 (2008)

  18. [18]

    Antero et al

    T. Antero et al. (CDF Collaboration), Phys. Lett. B 692, 232 (2010). 165

  19. [19]

    V. M. Abazov et al. (D0 Collaboration), Phys. Rev. D 76, 012003 (2007)

  20. [20]

    R. S. Towell et al. (FNAL E866/NuSea Collaboration), Phys. Rev. D 64, 052002 (2001)

  21. [21]

    Abramowicz et al

    H. Abramowicz et al. (H1 and ZEUS Collaboration), Eur. Phys. J. C 75, 580 (2015)

  22. [22]

    Pumplin, D

    J. Pumplin, D. R. Stump, J. Huston, H. L. Lai, P. M. Nadolsky, and W. K. Tung, JHEP 07, 012 (2002), arXiv:0201195 [hep-ph]

  23. [23]

    H.-L. Lai, M. Guzzi, J. Huston, Z. Li, P. M. Nadolsky, J. Pumplin, and C.-P. Yuan, Phys. Rev. D 82, 074024 (2010)

  24. [24]

    Dulat, T.-J

    S. Dulat, T.-J. Hou, J. Gao, M. Guzzi, J. Huston, P. Nadolsky, J. Pumplin, C. Schmidt, D. Stump, and C.-P. Yuan, Phys. Rev. D 93, 033006 (2016)

  25. [25]

    A. D. Martin, W. J. Stirling, R. S. Thorne, and G. Watt, arXiv:0901.0002 [hep-th]

  26. [26]

    R. D. Ball et al. (NNPDF Collaboration), JHEP 04, 40 (2015)

  27. [27]

    R. L. Jaff and A. Manohar, Nucl. Phys. B. 337, 509

  28. [28]

    O. C. Allkofer et al. (EMC Collaboration), Nucl. Instr. and Meth. 179, 445 (1981)

  29. [29]

    J. D. Bjorken, Phys. Lett. D 1, 1376 (1970)

  30. [30]

    Ellis and R

    J. Ellis and R. Jaffe, Phys. Lett. D 9, 1444 (1974)

  31. [31]

    Ashman et al

    J. Ashman et al. (EMC Collaboration), Phys. Lett. B 206, 364 (1988)

  32. [32]

    Abbon et al

    P. Abbon et al. (Compass Collaboration), Nucl. Instr. and Meth. A 577, 455 (2007)

  33. [33]

    M. G. Abbon et al. (Compass Collaboration), Phys. Lett. B 690, 466 (2010)

  34. [34]

    V. Y. Alexakhin et al. (Compass Collaboration), Phys. Lett. B 647, 8 (2007)

  35. [35]

    Alexakhin et al

    M. Alexakhin et al. (Compass Collaboration), Phys. Lett. B 693, 227 (2010)

  36. [36]

    Alexakhin et al

    M. Alexakhin et al. (Compass Collaboration), Phys. Lett. B 680, 217 (2009). 166

  37. [37]

    E. S. Ageev et al. (Compass Collaboration), Phys. Lett. B 633, 25 (2006)

  38. [38]

    Alekseev et al

    M. Alekseev et al. (Compass Collaboration), Phys. Lett. B 676, 31 (2009)

  39. [39]

    Adolph et al

    C. Adolph et al. (Compass Collaboration), Phys. Rev. D 87, 052018 (2013)

  40. [40]

    Adolph et al

    C. Adolph et al. (Compass Collaboration), Phys. Lett. B 718, 922 (2013)

  41. [41]

    Airapetian et al

    A. Airapetian et al. (HERMES Collaboration), Nucl. Instr. and Meth. A 540, 68 (2005)

  42. [42]

    Ackestaff et al

    A. Ackestaff et al. (HERMES Collaboration), Nucl. Instr. and Meth. A 417, 230 (1998)

  43. [43]

    Airapetian et al

    A. Airapetian et al. (HERMES Collaboration), Phys. Rev. D 75, 012007 (2007)

  44. [44]

    Airapetian et al

    A. Airapetian et al. (HERMES Collaboration), Phys. Rev. D 71, 012003 (2005)

  45. [45]

    Airapetian et al

    A. Airapetian et al. (HERMES Collaboration), JHEP 08, 130 (2010)

  46. [46]

    Bl¨ umlein and H

    J. Bl¨ umlein and H. B¨ ottcher, Nucl. Phys. B841, 205 (2010)

  47. [47]

    Leader, A

    E. Leader, A. V. Sidorov, and D. B. Stamenov, Phys. Rev. D 82, 1140812 (2010)

  48. [48]

    de Florian, R

    D. de Florian, R. Sassot, M. Stratmann, and W. Vogelsang, Phys. Rev. Lett. 101, 072001 (2008)

  49. [49]

    de Florian, R

    D. de Florian, R. Sassot, M. Stratmann, and W. Vogelsang, Phys. Rev. D. 80, 034030 (2009)

  50. [50]

    de Florian, R

    D. de Florian, R. Sassot, M. Stratmann, and W. Vogelsang, Phys. Rev. Lett. 113, 012001 (2014)

  51. [51]

    R. D. Ball et al. (NNPDF Collaboration), Nucl. Phys. B 887, 276 (2014)

  52. [52]

    R. D. Ball et al. (NNPDF Collaboration), Nucl. Phys. B 874, 36 (2013)

  53. [53]

    N. Sato, W. Melnitchouk, S. E. Kuhn, J. J. Eithier, and A. Accardi (Jefferson Lab Angular Momentum Collaboration), Phys. Rev. D 93, 074005 (2016)

  54. [54]

    G. C. Blazey, J. R. Dittmann, S. D. Ellis, V. D. Elvira, K. Frame, S. Grinstein, R. Hirosky, R. Piegaia, H. Schellman, R. Snihur, V.Sorin, and D. Zeppenfeld, 167 arXiv:0005012 [hep-ex]

  55. [55]

    Catani, Y

    S. Catani, Y. L. Dokshitzer, M. H. Seymour, and B. R. Webber, Nucl. Phys. B 406, 187 (1993)

  56. [56]

    S. D. Ellis and D. E. Soper, Phys. Rev. D 48, 3160 (1993)

  57. [57]

    Y. L. Dokshitzer, G. D. Leder, S. Moretti, and B. R. Webber, JHEP 9708, 001 (1997)

  58. [58]

    Wobisch and T

    M. Wobisch and T. Wengler, arXiv:9907280 [hep-ph]

  59. [59]

    B. I. Abelev et al. (STAR Collaboration), Phys. Rev. Lett. 97, 252001 (2006)

  60. [60]

    B. I. Abelev et al. (STAR Collaboration), Phys. Rev. Lett. 100, 232003 (2008)

  61. [61]

    Adamczyk et al

    L. Adamczyk et al. (STAR Collaboration), Phys. Rev. D. 86, 032006 (2012)

  62. [62]

    Sakuma, Inclusive Jet and Dijet Production in Polarized proton-proton Col- lisions at √s =200 GeV at RHIC , Ph.D

    T. Sakuma, Inclusive Jet and Dijet Production in Polarized proton-proton Col- lisions at √s =200 GeV at RHIC , Ph.D. thesis, Massachusetts Institute of Technology (2010)

  63. [63]

    Li, in PoS(DIS2015)203 (2015)

    X. Li, in PoS(DIS2015)203 (2015)

  64. [64]

    Webb, in PoS(DIS2013)215 (2013)

    G. Webb, in PoS(DIS2013)215 (2013)

  65. [65]

    Mukherjee and W

    A. Mukherjee and W. Vogelsang, Phys. Rev. D 86, 094009 (2012)

  66. [66]

    Adamczyk et al

    L. Adamczyk et al. (STAR Collaboration), Phys. Rev. Lett. 115, 092002 (2015)

  67. [67]

    Harrison, T

    M. Harrison, T. Ludlam, and S. Ozaki, Nucl. Instr. and Meth. A 499, 235 (2003)

  68. [68]

    H. Hahn, E. Forsyth, H. Foelsche, M. Harrison, J. Kewisch, G. Parzen, S. Peggs, E. Raka, A. Ruggiero, A. Stevens, S. Tepikian, P. Thieberger, D. Trbojevic, J. Wei, E. Willen, S. Ozaki, and S. Lee, Nucl. Instr. and Meth. A 499, 245 (2003)

  69. [69]

    Alekseev, C

    I. Alekseev, C. Allgower, M. Bai, Y. Batygin, L. Bozano, K. Brown, G. Bunce, P. Cameron, E. Courant, S. Erin, et al. , Nucl. Instr. and Meth. A 499, 392 (2003). 168

  70. [70]

    Okada, I

    H. Okada, I. Alekseev, A. Bravar, G. Bunce, S. Dhawan, R. Gill, W. Haeberli, O. Jinnouchi, A. Khodinov, Y. Makdisi, et al. , arXiv:0601001 [hep-ex]

  71. [71]

    , arXiv:0412053 [nucl-ex]

    O.Jinnouchi, I.G.Alekseev, A.Bravar, G.Bunce, S.Dhawan, H.Huang, G.Igo, V.P.Kanavets, K.Kurita, H.Okada, et al. , arXiv:0412053 [nucl-ex]

  72. [72]

    Ackermann, N

    K. Ackermann, N. Adams, C. Adler, Z. Ahammed, S. Ahmad, C. Allgower, J. Amonett, J. Amsbaugh, B. Anderson, M. Anderson, et al. , Nucl. Instr. and Meth. A 499, 624 (2003)

  73. [73]

    Anderson, J

    M. Anderson, J. Berkovitz, W. Betts, R. Bossingham, F. Bieser, R. Brown, M. Burks, M. C. de la Barca S´ anchez, D. Cebra, M. Cherney,et al., Nucl. Instr. and Meth. A 499, 659 (2003)

  74. [74]

    Beddo, E

    M. Beddo, E. Bielick, T. Fornek, V. Guarino, D. Hill, K. Krueger, T. LeCompte, D. Lopiano, H. Spinka, D. Underwood, et al. , Nucl. Instr. and Meth. A 499, 725 (2003)

  75. [75]

    Allgower, B

    C. Allgower, B. Anderson, A. Baldwin, J. Balewski, M. Belt-Tonjes, L. Bland, R. Brown, R. Cadman, W. Christie, I. Cyliax, et al. , Nucl. Instr. and Meth. A 499, 740 (2003)

  76. [76]

    Kiryluk, arXiv:0501072 [hep-ex]

    J. Kiryluk, arXiv:0501072 [hep-ex]

  77. [77]

    Adler, A

    C. Adler, A. Denisov, E. Garcia, M. Murray, H. Strobele, and S. White, Nucl. Instr. and Meth. A 470, 433 (2001)

  78. [78]

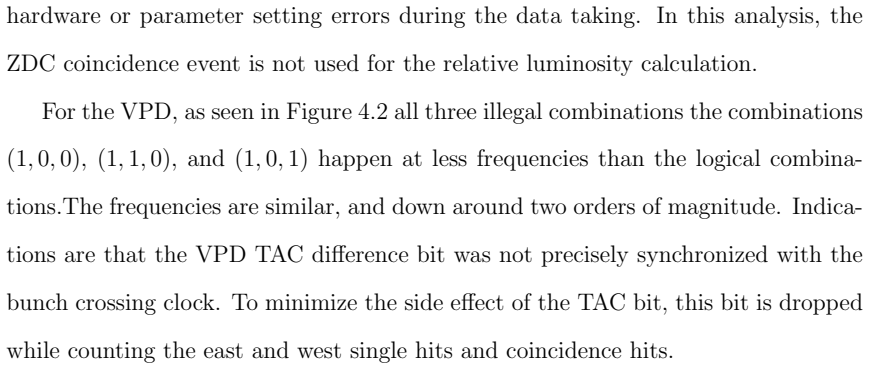
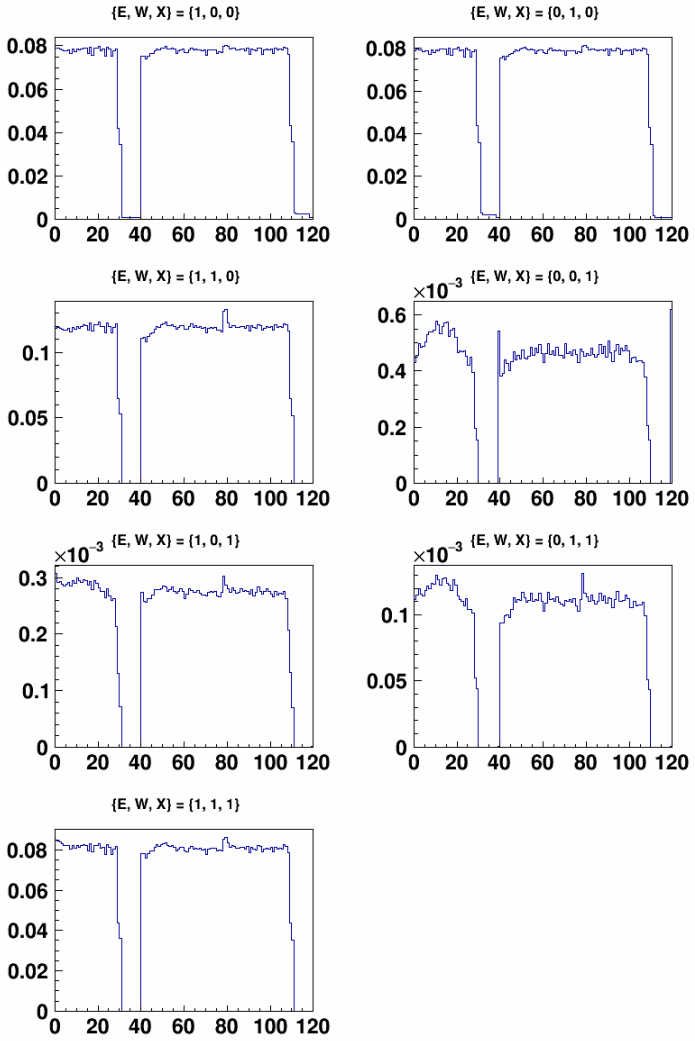
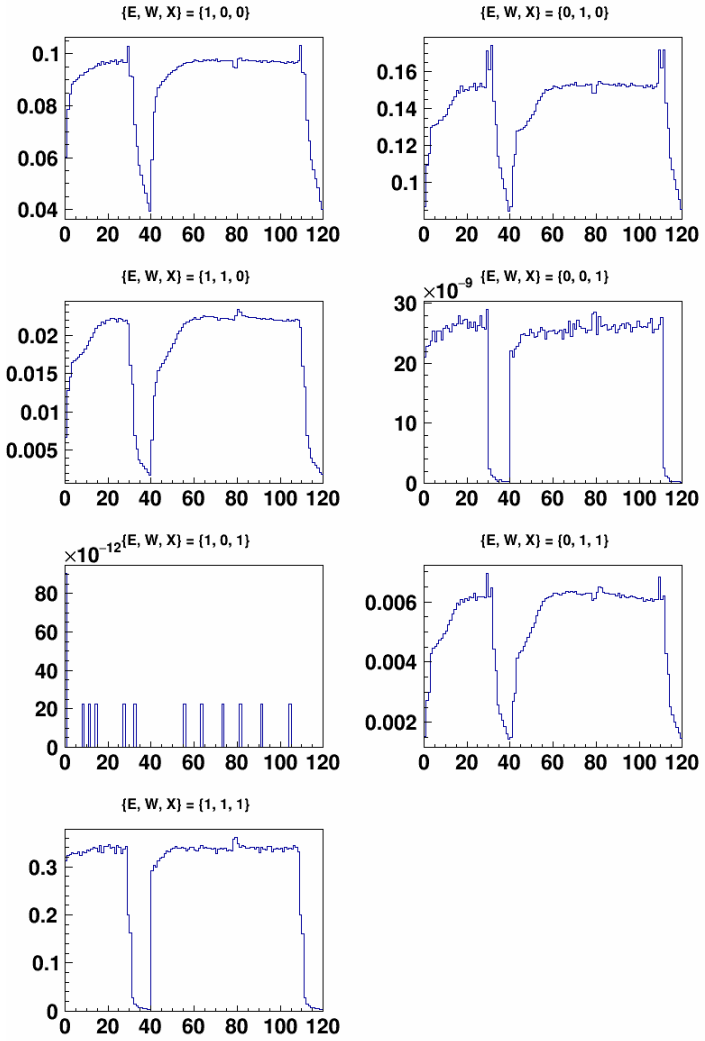
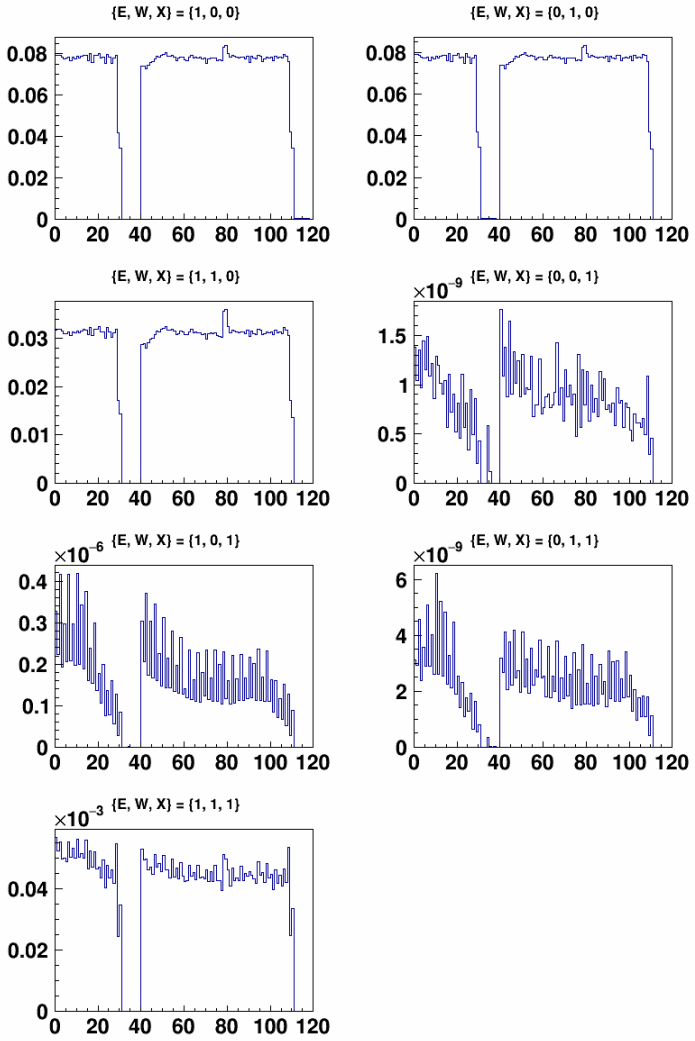
    The STAR Vertex Position Detector

    W. Llope, J. Zhou, T. Nussbaum, G. Hoffmann, K. Asselta, J. Brandenburg, J. Butterworth, T. Camarda, W. Christie, H. Crawford, et al. , arXiv:1403.6855 [physics.ins-det]

  79. [79]

    The RHIC Polarimetry Group, http://public.bnl.gov/docs/cad/Documents/RHIC polarization for Runs 9-12.pdf (2013)

  80. [80]

    The RHIC Polarimetry Group, https://wiki.bnl.gov/rhicspin/Run 12 polarization (2012). 169

Showing first 80 references.