REVIEW 3 major objections 5 minor 50 references
Evidences of low-diffusion bubbles around Galactic pulsars
T0 review · 3 major / 5 minor · reviewed 2026-08-14 · deepseek-v4-flash
Pith's one-line read Across a sample of 27 pulsar wind nebulae, gamma-ray halos imply diffusion coefficients two orders of magnitude below the Galactic average, making low-diffusion bubbles of at least 80 pc a general property of Galactic pulsars.
desk verdict First sample-wide D0 measurement around 27 PWNe, with real forecasts and fit work, but the ISM-escape interpretation is explicitly conditional and the two-zone degeneracy remains unresolved. read the letter →
The pith
A machine-rendered reading of the paper's core claim, the machinery that carries it, and where it could break.
The reading
What carries the argument
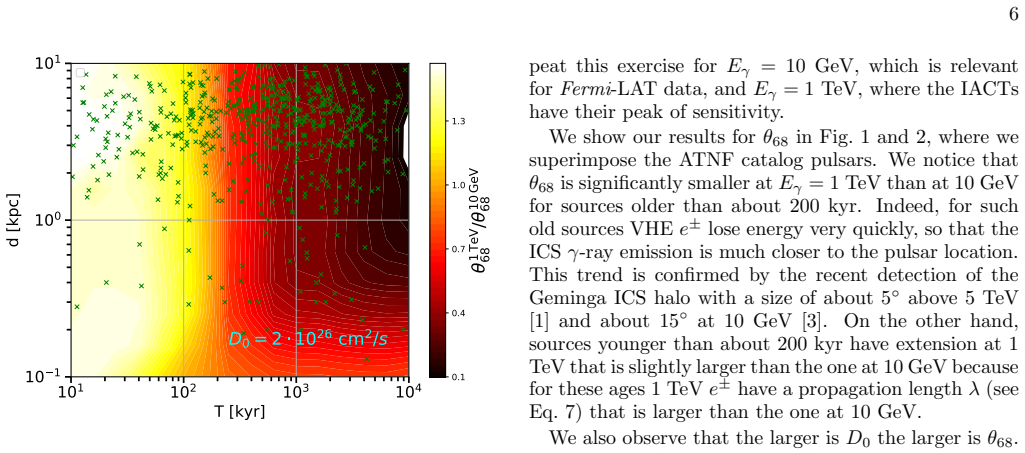
The load-bearing object is the two-zone diffusion model, in which the diffusion coefficient is $D(E,r)=D_0(E/1\,\mathrm{GeV})^\delta$ inside a bubble of radius $r_b$ and jumps to the larger Galactic value outside. The electrons and positrons are injected continuously with a spin-down-powered spectrum $Q(E,t)\propto L(t)E^{-\gamma}e^{-E/E_c}$, propagated with energy losses and a diffusion length $\lambda$, and converted into gamma rays by inverse Compton scattering off the cosmic microwave background, infrared, and starlight fields. Halo sizes are quantified by the 68% containment angle $\theta_{68}$ and by the empirical $\theta_{\mathrm{ICS}}$ profile used for the catalog fits; the fitted surface-brightness profile is the mechanism that turns an observed angular extension into a diffusion coefficient.
What would settle it
Measure one bright halo, such as HESS J1825-137, out to radii well beyond its fitted bubble with CTA or HAWC: if the surface brightness breaks to the steeper, more extended profile predicted for Galactic diffusion beyond $r_b$, the two-zone picture is confirmed; if the steep low-diffusion profile continues to several hundred parsecs with no break, the bubble is much larger than 80 pc. If instead deep X-ray or radio mapping shows no escaping particles beyond the PWN boundary, the assumption that the TeV halo is made of interstellar-diffusing leptons collapses.
Extended reading notes
Core claim
The central claim is that essentially every pulsar wind nebula in the sample sits inside a region where cosmic rays diffuse far more slowly than they do in the bulk of the Galaxy. The evidence is morphological: the TeV surface-brightness profiles of the 27 sources are well described by a leptonic inverse-Compton halo model with a low diffusion coefficient, whereas a simple Gaussian is often a worse fit. The mean fitted value is $D_0 = 9.1^{+17.4}_{-6.0}\times10^{25}\,\mathrm{cm^2\,s^{-1}}$ at 1 GeV, equivalent to $D(1\,\mathrm{TeV}) = 8.2^{+20.9}_{-5.9}\times10^{26}\,\mathrm{cm^2\,s^{-1}}$, with no significant difference between pulsars younger or older than 20 kyr and no trend with age. The inferred halo radii, typically about 35 pc and exceeding 100 pc for several sources, are then read as lower limits on the bubble radius $r_b$: for $D_0\sim10^{26}\,\mathrm{cm^2\,s^{-1}}$, bubbles smaller than about 80 pc would truncate the observed degree-scale halos. On this basis the paper concludes that low-diffusion bubbles of at least 80 pc are a general property of Galactic pulsar wind nebulae.
Load-bearing premise
The load-bearing premise is that the observed TeV emission is inverse-Compton radiation from electrons and positrons that have escaped the pulsar wind nebula and are diffusing in the interstellar medium, so the fitted $D_0$ measures interstellar diffusion rather than confinement inside the nebula.
Editorial extensions
If this is right
- If the central claim holds, the low-diffusion bubble is a standard feature of pulsar wind nebulae, so models of cosmic-ray escape from pulsars must place every source in an $r_b \gtrsim 80$ pc low-diffusion region rather than assigning only Geminga and Monogem a special environment.
- With a few-percent conversion efficiency, HAWC and HESS should already have detected a few tens of inverse-Compton halos, and CTA should detect roughly four times more, about 100–130, making the population testable in the near future.
- The ranking by predicted inverse-Compton flux is a strong selection tool: 21 of the 23 brightest predicted pulsars in the HAWC field are already in the 2HWC catalog, and PSR B1951+32 and PSR J1740+1000 are predicted as likely future detections.
- The absence of an age dependence in $D_0$ argues against a strong evolution of the diffusion coefficient with pulsar age over the sampled 3–340 kyr range.
- Reinterpreting halo sizes with $\theta_{\mathrm{ICS}}$ roughly doubles the halo volumes used in earlier confinement estimates; for at least one source, HESS J1825-137, the revised electron density drops below the interstellar value, weakening the case that all these halos are still nebular rather than interstellar.
Reading between the lines
- A decisive follow-up would measure one bright halo, such as HESS J1825-137, at GeV and TeV energies simultaneously with Fermi-LAT and CTA; the joint fit could break the $D_0$–$r_b$ degeneracy that the paper's own two-zone check exposes, turning the current lower limit on the bubble radius into a measured value.
- If low-diffusion bubbles are ubiquitous, the standard practice of using a single average Galactic diffusion coefficient for cosmic-ray propagation may need to treat pulsar surroundings as a population of 'slow zones', which would alter predictions of the pulsar contribution to the AMS-02 positron excess.
- The paper's finding of no age trend in $D_0$ contradicts the theoretical expectation of a strong increase in diffusion after roughly 100 kyr; if confirmed by a larger sample, transport models around old pulsars must be revised.
- Because the TeV halo size is tied to the bubble radius, the same low-diffusion regions should also suppress the arrival of lower-energy cosmic rays from those directions, a signature that might be observable through the gamma-ray shadows of background sources seen behind the bubbles.
Editorial analysis
A structured set of objections, weighed in public.
Referee Report
Summary. This paper investigates whether the low-diffusion halos seen around Geminga and Monogem are a generic property of Galactic pulsar wind nebulae (PWNe). The authors model the inverse-Compton (IC) gamma-ray emission from electrons/positrons injected by PWNe, using a one-zone diffusion model with a two-zone variant containing an inner low-diffusion bubble of radius r_b, and study the 68% containment angle as a function of pulsar age, distance, D0 and r_b. They forecast the number of IC halos detectable by HAWC, HESS and CTA as a function of the pulsar-to-lepton efficiency η, and they construct a sample of 27 HGPS/HAWC sources associated with PWNe. Fitting the HGPS surface-brightness maps and the HAWC data for Geminga and Monogem source by source with D0 and η free, they obtain a sample-mean D0 ≈ 9×10^25 cm2/s at 1 GeV (D(1 TeV) ≈ 8×10^26 cm2/s), about two orders of magnitude below the average Galactic value, and infer low-diffusion bubbles of size at least about 80 pc around the sources. The paper also ranks pulsars by predicted IC flux and identifies the brightest expected halos.
Significance. If correct, the result would generalize the Geminga/Monogem low-diffusion halos to a substantial sample of Galactic PWNe, with implications for cosmic-ray transport in the inner Galaxy and for the pulsar contribution to the positron excess. The paper's strengths are its use of public HGPS and HAWC data, the source-by-source surface-brightness fits, the report of statistical errors, the explicit test of the correlation-radius choice, and the falsifiable predictions (source ranking and detection counts) that can be checked with future HAWC and CTA observations. The central inference, however, is conditional on the assumption that the TeV emission is produced by leptons that have escaped into the interstellar medium; the one-zone fits measure an effective diffusion scale in the emission region, and the two-zone fit shows a D0–r_b degeneracy. The sample-wide claim is therefore plausible but not yet demonstrated at the level claimed in the abstract.
major comments (3)
- [Secs. I and VI, Eqs. (5), (9), (11)] The identification of the fitted D0 with the interstellar diffusion coefficient is the load-bearing step and is not established. The model assumes a point-like injector in a homogeneous ISM, so the profile fits in Sec. VI can only yield D0 in this interpretation if the radiating e± have actually left the PWN/SNR. The paper itself flags this as unresolved in Sec. I and cites Ref. [11], which concludes that for most HGPS PWNe the e± density exceeds the ISM value, i.e., confinement. The rebuttal in Sec. VI, that Ref. [11] underestimates halo sizes by about a factor of two, changes the density estimates but does not by itself demonstrate escape; a confined electron population radiating inside the PWN/SNR environment would also produce an extended profile that the one-zone diffusion fit could absorb into a low effective D0. This concern is concrete: the sample includes objects whose TeV emission is commonly attributed to the PWN itself, e.g., HESS J0835-455 (Vela X) in Tab. III. Please either soften the claim to an effective diffusion coefficient in the emission region or add a model component that distinguishes confined and escaped leptons.
- [Sec. VI, Fig. 11] The claim of a low-diffusion bubble size of at least 80 pc is not directly constrained by the data. The one-zone fits in Tab. IV fix r_b effectively infinite, and the only two-zone fit, HESS J1825-137 in Fig. 11, shows a strong D0–r_b degeneracy: the text reports r_b > 60 pc, with the best-fit D0 changing from about 16×10^26 cm2/s at r_b = 60 pc to about 2×10^26 cm2/s at r_b = 120 pc, and a chi2 that is flat for r_b > 70 pc. The 80 pc value therefore comes from combining the one-zone D0 with the model curves in Fig. 4, not from a fit. Please present the bubble-size result as a model-dependent lower limit under the one-zone assumption and report the degenerate D0–r_b range explicitly.
- [Sec. V.B, Sec. VI] The surface-brightness fits do not include a background component. The paper states in Sec. V.B that, assuming the background is isotropic, it should act as a mere normalization without changing significantly the angular profile of the TeV surface brightness. This is not correct: a constant isotropic background adds a constant to the azimuthally averaged surface brightness, which flattens the profile at large angles and changes the fitted slope of the diffusion model unless the background is fitted simultaneously. Since the ROIs extend to 0.7–1.1 degrees and the HGPS maps contain interstellar emission and unresolved sources, the fitted D0 values may be biased. Please add a constant background parameter to the fits or demonstrate with off-source regions that the effect is negligible.
minor comments (5)
- [Abstract, Tab. IV] The abstract states that all sources are extended with gamma-ray emission of about 15–80 pc, but the sizes in Tab. IV range from about 6 pc (HESS J1026-582) to about 180 pc (HESS J1841-055); please clarify which statistic is quoted in the abstract and make the numbers consistent.
- [Sec. VI] The same numerical value 8.2+20.9-5.9 appears both as D0 = 8.2×10^25 cm2/s for annuli of 0.1 degrees and as D(1 TeV) = 8.2×10^26 cm2/s, without stating the assumed spectral index delta used for the energy rescaling; please make the D0-to-D(E) relation explicit.
- [Tabs. III–IV] Tab. III uses HESS J1837-069 / 2HWC J1837-065 while Tab. IV and parts of the text use HESS J1837-065; please unify the source naming.
- [Sec. IV.A] The forecast uses a fixed HAWC sensitivity of 10^-14 (TeV cm2 s)^-1 and a fixed HESS sensitivity of 10^-12 (TeV cm2 s)^-1, with no declination or longitude dependence; the predicted detection numbers should be labeled as order-of-magnitude estimates.
- [Throughout] There are several typos and minor wording issues: 'PNW gamma-ray emission' in Sec. III.A, 'with an efficiency a slow as a few %' in Sec. IV.A, 'the constrain of the HAWC field of view' in Sec. IV.B, and 'an other one' before Fig. 4.
Circularity Check
Central D0 values come from external HGPS/HAWC fits; one non-load-bearing circular consistency check where θ68 is computed from assumed D0 and then used to 'imply' that same D0.
-
self definitional
[Sec. V A (sample selection; Tab. III caption and text)]
"We report also the predicted size of ICS emission calculated, for each source, with θ68, i.e. as the 68% containment radius (see Eq. 12), at 1 TeV and for D0 = 7 · 10^25 cm2/s. ... Overall, we find a good match between the measured and predicted size of extension, implying that the morphology of the γ-ray emission from these sources should be consistent with a diffusion environment with D0∼ 10^26 cm2/s."
The predicted θ68 is computed by construction from the assumed value D0 = 7e25 cm2/s. Concluding from the match to the measured extensions that 'D0 ∼ 1e26 cm2/s' merely recovers the input assumption; the apparent consistency is not independent evidence. The same circular pattern appears in Sec. IV B / Tab. I, where θ68 is calculated with D0 = 7e25 and the text says 'This implies that D0 should be of the order of ∼10^26 cm2/s'. This step is not load-bearing for the main result, because Sec. VI re-fits D0 directly to the HESS/HAWC surface-brightness profiles with D0 and η as free parameters.
full rationale
The paper's central D0 determination is a source-by-source fit to external HGPS flux maps and HAWC surface-brightness data (Secs. V-VI), with D0 and η free; those data are not generated from the model, so the low-D0 result is not an input renamed as an output. The detection-rate forecasts and pulsar rankings use assumed efficiencies and D0 = 7e25 cm2/s taken from prior Geminga/HAWC work, and are checked against the 2HWC/HGPS catalogs rather than fitted to them, so they are predictions, not circular fits. The one clear circular-consistency moment is in Sec. V A (and similarly in Tab. I), where θ68 is computed from the assumed D0 and the match to measured sizes is then said to imply D0 ∼ 1e26 cm2/s; this reduces by construction to the assumed value, but it is not the basis of the final D0 values. The paper's acknowledged assumption that the e± have escaped into the ISM (with the alternative confinement scenario cited from Ref. [11]) is a model-dependence/correctness concern, not circularity, and the explicit two-zone fit in Sec. VI exposing the D0-rb degeneracy further shows the authors are not hiding the model dependence. Overall: central derivation self-contained; one minor non-load-bearing circular-consistency statement.
Assumptions & free parameters
free parameters (8)
- D0 =
2.4e24 to 9.3e26 cm2/s at 1 GeV, per source; sample mean 9.1e25 cm2/s
- η =
per source; some values exceed 1; assumed 0.01 in forecasts
- γe =
1.2 to 3.0 per source
- τ0 =
12 kyr
- Ec =
10^3 TeV
- E1 =
0.1 GeV
- δ =
not explicitly stated (standard value assumed)
- rb =
not fit for the sample; explored 10 to 200 pc for HESS J1825-137
assumptions (7)
- domain assumption The VHE gamma-ray emission is produced by inverse Compton scattering of e± that have escaped the PWN into the ISM.
- domain assumption A one-zone diffusion model with a uniform low D0 applies out to the halo radius.
- domain assumption Continuous injection follows the magnetic dipole spin-down law with τ0 = 12 kyr and Ec = 10^3 TeV.
- domain assumption Background emission in the surface brightness fits is isotropic and acts only as a normalization.
- domain assumption The diffusion spectral index δ is fixed to a standard value when rescaling D0.
- domain assumption Pulsar proper motion does not significantly distort the TeV halos in the sample.
- domain assumption The local ISRF model of Vernetto and Lipari [37] describes the radiation fields around all sources.
Cite this review
Pith. "Pith review of Evidences of low-diffusion bubbles around Galactic pulsars." pith.science (2026). https://pith.science/paper/GKRLA5YF
@misc{pith2026190803216,
  author       = {Pith},
  title        = {Pith review of: Evidences of low-diffusion bubbles around Galactic pulsars},
  year         = {2026},
  howpublished = {\url{https://pith.science/paper/GKRLA5YF}},
  note         = {Machine review of arXiv:1908.03216}
}
abstract
Recently, a few-degrees extended $\gamma$-ray halo in the direction of Geminga pulsar has been detected by HAWC, Milagro and Fermi-LAT. These observations can be interpreted with positrons ($e^+$) and electrons ($e^-$) accelerated by Geminga pulsar wind nebula (PWN), released in a Galactic environment with a low diffusion coefficient ($D_0$), and inverse Compton scattering (ICS) with the interstellar radiation fields. We inspect here how the morphology of the ICS $\gamma$-ray flux depends on the energy, the pulsar age and distance, and the strength and extension of the low-diffusion bubble. In particular we show that $\gamma$-ray experiments with a peak of sensitivity at TeV energies are the most promising ones to detect ICS halos. We perform a study of the sensitivity of HAWC, HESS and the future CTA experiment finding that, with efficiencies of the order of a few %, the first two experiments should have already detected a few tens of ICS halos while the latter will increase the number of detections by a factor of 4. We then consider a sample of sources associated to PWNe and detected in the HESS Galactic plane survey and in the second HAWC catalog. We use the information available in these catalogs for the $\gamma$-ray spatial morphology and flux of these sources to inspect the value of $D_0$ around them and the $e^{\pm}$ injection spectrum. All sources are detected as extended with a $\gamma$-ray emission extended about $15-80$ pc. Assuming that most of the $e^{\pm}$ accelerated by these sources have been released in the interstellar medium, the diffusion coefficient is $2-30 \cdot 10^{26}$ cm$^2$/s at 1 TeV, i.e. two orders of magnitude smaller than the value considered to be the average in the Galaxy. These observations imply that Galactic PWNe have low-diffusion bubbles with a size of at least 80 pc.
Figures


Figures from the paper (8 more)




Reference graph
Works this paper leans on
-
[11]
G. Giacinti, A. M. W. Mitchell, R. L´ opez-Coto, V. Joshi, R. D. Parsons, and J. A. Hinton (2019), 1907.12121
arXiv 2019
-
[1]
and about 15 ◦ at 10 GeV [3]. On the other hand, sources younger than about 200 kyr have extension at 1 TeV that is slightly larger than the one at 10 GeV because for these ages 1 TeVe± have a propagation lengthλ (see Eq. 7) that is larger than the one at 10 GeV. We also observe that the larger is D0 the larger is θ68. For example, for a source as Geminga...
-
[2]
A. A. Abdo, B. T. Allen, T. Aune, et al., ApJL 700, L127 (2009), 0904.1018
work page Pith review arXiv 2009
- [3]
-
[4]
A. U. Abeysekara et al. (HAWC), Science 358, 911 (2017), 1711.06223
arXiv 2017
-
[5]
M. Ackermann, M. Ajello, Allafort, et al., Physical Re- view Letters 108, 011103 (2012), 1109.0521
arXiv 2012
-
[6]
M. Aguilar, L. Ali Cavasonza, G. Ambrosi, et al. (AMS Collaboration), Phys. Rev. Lett. 122, 041102 (2019), URL https://link.aps.org/doi/10.1103/ PhysRevLett.122.041102
work page 2019
- [7]
Show all 50 references
-
[8]
Genolini, A
Y. Genolini, A. Putze, P. Salati, and P. D. Serpico, As- tron. Astrophys. 580, A9 (2015), 1504.03134
2015 arXiv
- [9]
- [10]
- [12]
-
[13]
Hooper, I
D. Hooper, I. Cholis, T. Linden, and K. Fang, Phys. Rev. D96, 103013 (2017), 1702.08436
2017 arXiv
- [14]
-
[15]
Fang, X.-J
K. Fang, X.-J. Bi, P.-F. Yin, and Q. Yuan, Astrophys. J. 863, 30 (2018), 1803.02640
2018 arXiv
-
[16]
Xi, R.-Y
S.-Q. Xi, R.-Y. Liu, Z.-Q. Huang, K. Fang, H. Yan, and X.-Y. Wang (2018), 1810.10928
2018 arXiv
-
[17]
In the present study, we argue that the most promising energy range for searching for ICS halos is above 100 GeV, where IACTs, and HAWC and Milagro operate
and, as we have shown in [3], this effect distorts the ICS γ-ray morphology. In the present study, we argue that the most promising energy range for searching for ICS halos is above 100 GeV, where IACTs, and HAWC and Milagro operate. We then use the ICS flux to predict the brigh...
-
[18]
B. S. Acharya et al. (Cherenkov Telescope Array Consor- tium) (2017), 1709.07997
2017 arXiv
-
[19]
A. U. Abeysekara et al., Astrophys. J. 843, 40 (2017), 1702.02992
2017 arXiv
-
[20]
Hobbs, D
G. Hobbs, D. R. Lorimer, A. G. Lyne, and M. Kramer, Mon. Not. Roy. Astron. Soc. 360, 974 (2005), astro- ph/0504584
2005
-
[21]
Amato, International Journal of Modern Physics Con- ference Series 28, 1460160 (2014), 1312.5945
E. Amato, International Journal of Modern Physics Con- ference Series 28, 1460160 (2014), 1312.5945
2014 arXiv
-
[22]
R. N. Manchester, G. B. Hobbs, A. Teoh, and M. Hobbs, AJ 129, 1993 (2005), astro-ph/0412641
2005 arXiv
-
[23]
X. Chi, K. S. Cheng, and E. C. M. Young, ApJL 459, L83 (1996)
1996
-
[24]
J. D. Gelfand, P. O. Slane, and W. Zhang, ApJ 703, 2051 (2009), 0904.4053
2009 arXiv
-
[25]
B. M. Gaensler and P. O. Slane, Ann. Rev. Astron. As- trophys. 44, 17 (2006), astro-ph/0601081
2006 arXiv
-
[26]
R. A. Chevalier, in Supernovae, edited by D. N. Schramm (1977), vol. 66 of Astrophysics and Space Science Library, p. 53
1977
-
[27]
Yuksel, M
H. Yuksel, M. D. Kistler, and T. Stanev, Phys. Rev. Lett. 103, 051101 (2009), 0810.2784
2009 arXiv
-
[28]
van der Swaluw, A
E. van der Swaluw, A. Achterberg, Y. A. Gallant, and G. T´ oth, A&A380, 309 (2001)
2001
-
[29]
S. P. Reynolds and R. A. Chevalier, ApJ278, 630 (1984)
1984
-
[30]
Profumo, J
S. Profumo, J. Reynoso-Cordova, N. Kaaz, and M. Sil- verman, Phys. Rev. D97, 123008 (2018), 1803.09731
2018 arXiv
-
[31]
Buesching, O
I. Buesching, O. C. de Jager, M. S. Potgieter, and C. Ven- ter, Astrophys. J. 678, L39 (2008), 0804.0220
2008 arXiv
- [32]
-
[33]
Posselt, G
B. Posselt, G. G. Pavlov, P. O. Slane, R. Romani, N. Buc- ciantini, A. M. Bykov, O. Kargaltsev, M. C. Weisskopf, and C.-Y. Ng, ApJ 835, 66 (2017), 1611.03496
2017 arXiv
- [34]
- [35]
-
[36]
Delahaye, J
T. Delahaye, J. Lavalle, R. Lineros, F. Donato, and N. Fornengo, A&A 524, A51 (2010), 1002.1910
2010 arXiv
-
[37]
G. R. Blumenthal and R. J. Gould, Reviews of Modern Physics 42, 237 (1970)
1970
-
[38]
Cirelli, G
M. Cirelli, G. Corcella, A. Hektor, G. Hutsi, M. Kadastik, P. Panci, M. Raidal, F. Sala, and A. Strumia, JCAP 1103, 051 (2011), [Erratum: JCAP1210,E01(2012)], 1012.4515
2011 arXiv
-
[39]
C. C. Popescu, R. Yang, R. J. Tuffs, G. Natale, M. Rush- ton, and F. Aharonian, MNRAS 470, 2539 (2017), 1705.06652. 20
2017 arXiv
- [40]
-
[41]
T. A. Porter, I. V. Moskalenko, and A. W. Strong, ApJL 648, L29 (2006), astro-ph/0607344
2006 arXiv
- [42]
-
[43]
Faherty, F
J. Faherty, F. Walter, and Anderson, Astrophysics and Space Science 308, 225230 (2007), astro-ph/0504584
2007 arXiv
- [44]
-
[45]
Joshi and A
V. Joshi and A. Jardin-Blicq (HAWC), PoS ICRC2017, 806 (2018), [35,806(2017)], 1708.04032
2018 arXiv
-
[46]
Mazin (CTA Consortium), in 36th International Cosmic Ray Conference (ICRC 2019) Madison, Wisconsin, USA, July 24-August 1, 2019 (2019), 1907.08530
D. Mazin (CTA Consortium), in 36th International Cosmic Ray Conference (ICRC 2019) Madison, Wisconsin, USA, July 24-August 1, 2019 (2019), 1907.08530
2019 arXiv
-
[47]
Ambrogi, S
L. Ambrogi, S. Celli, and F. Aharonian, Astropart. Phys. 100, 69 (2018), 1803.03565
2018 arXiv
-
[49]
Blasi and E
P. Blasi and E. Amato, Astrophysics and Space Science Proceedings 21, 624 (2011), 1007.4745
2011 arXiv
-
[50]
D. F. Torres, A. Cillis, J. Martn, and E. de Oa Wilhelmi, JHEAp 1-2, 31 (2014), 1402.5485
2014 arXiv
-
[105]
If this factor is considered in their calculation, many of their sources would have a e± density comparable to the one of the ISM
The differences in the halo size is for most of the sources about a factor of 2 thus bringing a difference in halo volume of almost 1 order of magnitude. If this factor is considered in their calculation, many of their sources would have a e± density comparable to the one of the...
Reviewed August 14, 2026 · model on record in the stance chip above.
Discussion (0). Continue with ORCID to comment.