REVIEW 3 major objections 4 minor 147 references
Radio-loudness along the quasar main sequence
T0 review · 3 major / 4 minor · reviewed 2026-08-14 · deepseek-v4-flash
Pith's one-line read The standard radio-loudness criterion $R_K>10$ picks out jetted quasars only on part of the main sequence; in extreme Population A it can select star formation instead.
desk verdict A systematic, useful MS-resolved radio-loudness study whose Population B jetted conclusion is solid, but whose xA thermal headline rests on external FIR data and is explicitly under-supported in the paper itself. read the letter →
The pith
A machine-rendered reading of the paper's core claim, the machinery that carries it, and where it could break.
The reading
What carries the argument
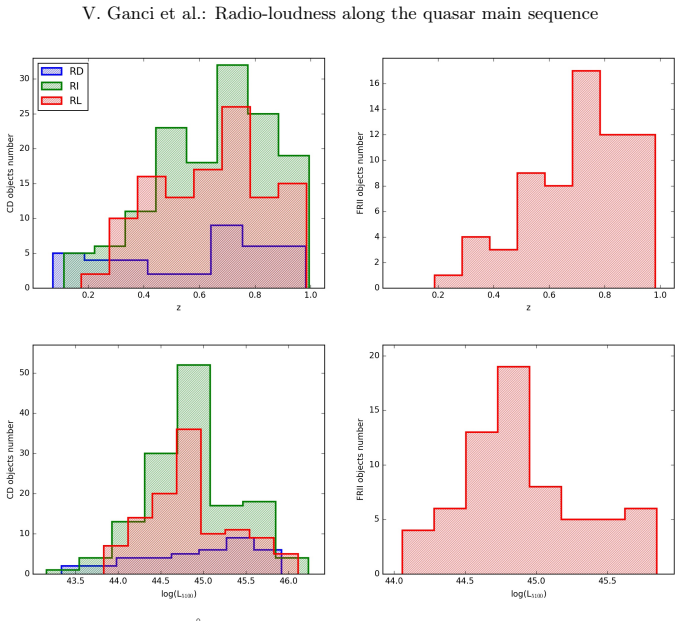
The organizing device is the quasar main sequence, the plane defined by FWHM(H$\beta$) versus the FeII strength $R_{\rm FeII}$, subdivided into spectral types from A1 to A5 and B1 to B1+++. Within each spectral type, the analysis compares three radio-loudness classes ($R_K<10$, $10\le R_K<70$, and $R_K\ge70$) and two radio morphologies, compact core-dominated and extended FRII-like. The decisive comparison is between the radio pseudo-star-formation rate derived from the 1.4 GHz power and the star-formation rate derived from 70/100 $\mu$m infrared photometry; sources that fall inside the star-forming, radio-quiet zone of the FIR-radio correlation are interpreted as thermally powered, while sources outside it are read as jetted.
What would settle it
Measure infrared brightness at 70–160 microns for the radio-intermediate and radio-loud extreme-A quasars in the paper's candidate list. If they fall below the star-forming infrared-radio relation and show compact flat-spectrum core-jet structure, the thermal interpretation fails; if they stay on it, the dichotomy holds.
Extended reading notes
Core claim
The central discovery is that radio-loudness is not one physical condition along the quasar main sequence. The authors build a sample of 355 type-1 quasars from a FIRST-SDSS cross-match, split into compact core-dominated and extended FRII-like radio morphologies, and into radio-detected, radio-intermediate, and radio-loud classes inside each optical spectral type. Extreme Population A (xA: A3 and A4, strong FeII and narrow H$\beta$) contains a notable prevalence of radio-intermediate and radio-loud sources, but their radio powers overlap those expected from star formation and their infrared-radio positions match radio-quiet quasars. Population B radio-loud sources, especially the FRII double-lobed ones, are jetted, and several of their H$\beta$ composites are better described by two displaced broad components than by the usual broad-plus-very-broad model, pointing to a binary broad-line region. The paper therefore argues that $R_K>10$ is sufficient to identify jetted sources in Population B and in spectral bin A1, but not in extreme Population A.
Load-bearing premise
The thermal interpretation of the extreme Population A sources assumes that the infrared-radio correlation from previous samples correctly marks star formation as the dominant radio mechanism and that those samples represent the present selection; only seven objects here have infrared data and none is an extreme-A source.
Editorial extensions
If this is right
- In Population B and in spectral bin A1, the condition $R_K>10$ (or $\log R_K>1$) remains a workable identifier of jetted sources, so those bins can be used as a clean jetted sample.
- In extreme Population A (A3/A4), radio-intermediate and radio-loud sources should not be counted as jetted without infrared or high-resolution radio follow-up; they are prime targets for testing the thermal interpretation.
- FRII double-lobed quasars appear almost exclusively in Population B, with a few A1 objects interpretable as the same jetted population seen at smaller viewing angle, so orientation must be included when using H$\beta$ FWHM to classify sources.
- The H$\beta$ profile fits of several Population B bins are consistent with two broad-line regions orbiting each other; if secure, these sources are binary black hole candidates, and radio-loud extreme Population B is the preferred hunting ground for such binaries.
Reading between the lines
- If the thermal interpretation holds, radio-loudness-selected samples that ignore main-sequence position will systematically overestimate the number of jetted quasars at the highest Eddington ratios, and may inflate binary black hole candidate lists by mixing starbursts into them.
- A direct extension would be to obtain high-resolution radio maps of the RL CD A3 candidates: compact symmetric or GPS/CSS morphologies combined with steep spectra would argue for a young jetted source, while diffuse or resolved disk-like radio emission would support a star-formation origin.
- The binary-broad-line-region interpretation predicts that the two H$\beta$ components should change radial velocity on decade timescales; single-epoch double-component fits alone cannot confirm a binary, so monitoring campaigns on the B1++ candidates would settle the matter.
- If xA radio power is substantially thermal, then feedback at the most extreme accretion rates is probably driven by outflows and star formation rather than by radio jets, which would shift how high-accretion quasars are treated in galaxy evolution models.
Signed reviews
Editorial analysis
A structured set of objections, weighed in public.
Referee Report
Summary. The paper cross-matches the FIRST radio survey with the SDSS DR14 quasar catalog to build a sample of 355 radio-detected type-1 AGNs, classifies them along the quasar main sequence (spectral types A1-A5, B1-B3) and by radio morphology (core-dominated vs. FRII-like) and radio-loudness (RD, RI, RL). It analyzes composite optical spectra per spectral type and radio class, measuring H-beta and [O III] profile parameters, estimating black hole masses and Eddington ratios, and comparing radio-derived pseudo-SFRs with FIR-derived SFRs. The central claims are that (i) radio-loud and radio-intermediate sources in extreme Population A (A3/A4) may have thermal, star-formation-dominated radio emission rather than relativistic jets, so that Kellermann's RK>10 criterion may not identify truly jetted sources in this region of the main sequence; (ii) radio-loud Population B sources are characteristically jetted, with some broad H-beta profiles consistent with a binary broad-line region; and (iii) a list of binary black hole AGN candidates is presented.
Significance. If the thermal-origin interpretation for extreme Population A were established, the paper would provide an observationally grounded refinement of the standard radio-loudness classification and would identify a population of quasars where the Kellermann criterion fails. The paper also delivers useful resources: a systematically selected sample, a FIRST atlas of FRII candidates, detailed spectral decompositions, and a candidate list for SMBBH searches. The Population B jetted classification is well supported by the radio morphology and power distributions. However, the headline claim that RK>10 is insufficient for extreme Population A is not established by the primary sample: as the authors explicitly concede in Sect. 5.3.2, there is no direct evidence that thermal xA sources enter the RL range. The external FIR comparison samples are differently selected and their xA members are mostly RD. This weakness is load-bearing because the main-sequence-dependent validity of Kellermann's criterion rests on it. The binary-BLR F-test evidence is suggestive but based on composite spectra and not decisive.
major comments (3)
- [§4.4, §5.3.2, Table 5, Fig. 9] The central claim that RI/RL sources in extreme Population A (xA, spectral types A3/A4) are thermal rather than jetted is not supported by the present sample. Table 5 lists only seven sources with FIR data, and none of them is an xA source; their spectral types are A2, A1, B1, B1+, or unclassified. The xA thermal inference therefore rests entirely on the external 73-source sample of Fig. 9, which was 'vetted to preferentially select Pop. A and especially xA' (Sect. 4.4) but is not FIRST-selected, and whose xA members are 'mainly classified as RD' (Sect. 4.4). The paper itself states in Sect. 5.3.2: 'in the samples used for Fig. 9 we have no indication of thermal xA sources entering into the RL radio-loudness range, and thus no direct evidence that the condition logRK >= 1 does not select truly jetted sources.' This is an explicit, load-bearing limitation: if the RL/RI xA sources in Table 2 are actually jetted, the claim that RK>10 is insufficient for xA collapses. The authors should either obtain or identify FIR data for the RL/RI xA sources in their own sample, or explicitly reframe the conclusion as hypothesis-generating rather than established.
- [§5.3.1, Fig. 11] The flat trend of logP_nu versus logRK' for xA sources is used as evidence of a different radio emission mechanism, but the xA subsample spans a very narrow range in logRK': in Table 1, xA sources are predominantly RI (15 out of 25) with only 5 RL and 5 RD, and the RI class is limited to 1.0 <= logRK' < 1.8 by definition. A regression slope that is not significantly different from zero over such a compressed dynamic range (slope 0.136 +/- 0.168) provides almost no discriminating power between a thermal and a jetted origin. The contrast with the well-constrained Population B slope is expected even if all sources share the same mechanism but have different luminosity/radio-loudness covariance. This point should be acknowledged and the evidential weight of Fig. 11 reduced accordingly.
- [§5.5, Table 6] The F-test comparison between the BC+VBC and BC+BC models is performed on composite (median) spectra, not on individual spectra, so the quoted probabilities (e.g., P = 8.3e-10 for RD CD B1+) quantify the improvement of fit to the composite profile, not the frequency of binary-BLR signatures among the individual sources. The authors themselves note alternative explanations (unresolved outflows, accretion disk instabilities, changing-look variability) and state that it is 'obviously not possible to demonstrate' a sub-pc binary from these data. Given that the candidate list is presented as a main result, the p-values should be interpreted as model-selection diagnostics for the composite, and the candidate list should be presented as a sample for follow-up rather than a statistically significant detection of binaries.
minor comments (4)
- [Fig. 11 caption] The word 'exagons' appears to be a typo for 'hexagons'; please correct it.
- [Table 4 footnote] The units for MBH are listed as 'M⊙/yr' but should be 'M⊙'; the table footnote should be corrected.
- [Abstract and §2.2] The abstract defines RD as RK' < 10 while the text in §2.2 uses log RK < 1.0, which corresponds to RK' < 10; the notation should be made consistent so that the reader does not confuse the threshold with the value of the physical ratio.
- [§4.1.2] In the description of Figure 5, the sentence 'This translates in a redshifted line' should read 'This translates into a redshifted line'.
Circularity Check
Partial circularity in the Pν–RK′ evidence and an acknowledged data gap weaken, but do not reduce, the central jetted/thermal classification.
-
other
[Sect. 5.3.1, Eq. (7) and Fig. 11]
"The behavior of the Pν vs. RK′ for the various STs (Fig. 11) adds further evidence in favor of an intrinsic difference between the two populations: Pop. B sources of the three radio loudness classes are significantly correlated, with a unweighted least square fit yielding logPν≈ (0.952±0.041)RK′ + (23.245±0.097)."
By Eq. (7), log P1.4GHz = 20.08 + 2 log dL + log f1.4GHz, while log RK′ is defined (Sect. 2.2) from the same f1.4GHz divided by the g-band flux. Thus log Pν = log RK′ + log f_g + 2 log dL + const: the abscissa and ordinate of Fig. 11 share the same radio flux density by construction. A slope near unity for Pop. B is therefore partly guaranteed whenever f_g and dL have small leverage, and the flat xA slope can arise from distance/luminosity scatter rather than from a different emission mechanism. The paper presents this shared-variable correlation as independent evidence of an intrinsic difference, which is a partial reduction of the argument to its own input.
full rationale
The paper's primary classification (radio-loudness from FIRST/SDSS fluxes) and its FIR-radio comparison use independently measured quantities, and the FRII/Pop. B jetted conclusion does not reduce to a fit. The xA 'thermal' interpretation is the central claim, yet the paper itself concedes (Sect. 5.3.2) that 'in the samples used for Fig. 9 we have no indication of thermal xA sources entering into the RL radio-loudness range, and thus no direct evidence that the condition logRK >= 1 does not select truly jetted sources.' Table 5 contains no xA source with FIR data, so the thermal inference is imported from external samples that were 'vetted to preferentially select Pop. A and especially xA' (Sect. 4.4) and whose xA members are mostly RD or borderline RI. That is an evidence/representativeness gap, not a self-definitional reduction, so it does not by itself raise the circularity score. However, the supporting Fig. 11 regression is partially built from the same 1.4 GHz flux in both axes, as detailed in the step. Self-citations (Negrete et al. 2018, Zamfir et al. 2008, Sulentic/Marziani MS papers) supply the MS/xA framework and the RI/RL thresholds, but the thresholds are empirical and the optical classification is independent of radio power; these citations are not the mechanism forcing the result. Overall, one evidentiary correlation is partially circular by construction, while the central claim retains independent observational content, giving a moderate score.
Assumptions & free parameters
free parameters (4)
- Radio-loudness thresholds (RK'=10 and RK'=70) =
10, 70 (logRK' 1.0, 1.8)
- FIR dust temperature T =
60 K
- Emissivity index beta =
1.82
- Spectral type bin boundaries =
Delta RFeII = 0.5; Delta FWHM = 4000 km/s
assumptions (5)
- domain assumption FWHM(Hbeta) traces virial motion in a flattened BLR
- domain assumption SDSS DR14 spectra allow reliable RFeII and FWHM(Hbeta) measurement after screening
- domain assumption FIR-radio correlation of Bonzini et al. (2015) applies to these quasars
- domain assumption The FIRST 1.4 GHz flux is complete for unresolved CD sources after accounting for ~30% underestimation
- domain assumption Radio morphology classification (CD vs FRII) is reliable using the de Vries et al. (2006) opening-angle criterion
Cite this review
Pith. "Pith review of Radio-loudness along the quasar main sequence." pith.science (2026). https://pith.science/paper/5USJCSDM
@misc{pith2026190807308,
  author       = {Pith},
  title        = {Pith review of: Radio-loudness along the quasar main sequence},
  year         = {2026},
  howpublished = {\url{https://pith.science/paper/5USJCSDM}},
  note         = {Machine review of arXiv:1908.07308}
}
read the original abstract
Following the established view of the AGNs inner workings, an AGN is radio-loud (RL) if associated with relativistic ejections emitting a radio synchrotron spectrum (i.e., a jetted AGN). If large samples of optically-selected quasars are considered, AGNs are identified as RL if their Kellermann's radio loudness ratio RK > 10. Our aims are to characterize the optical properties of different classes based on radio-loudness within the quasar main sequence (MS) and to test whether the condition RK > 10 is sufficient for the identification of RL AGNs. A sample of 355 quasars was selected by cross-correlating the FIRST survey with the SDSS DR14 quasar catalog. We classified the optical spectra according to their spectral types along the quasars MS. For each spectral type, we distinguished compact and extended morphology, and three classes of radio-loudness: detected (specific flux ratio in the g band and at 1.4GHz, RK' < 10, RD), intermediate (10 < RK' < 70, RI), and radio loud (RK' > 70). The analysis revealed systematic differences between RD, RI, and RL in each spectral type along the MS. We show that spectral bins that contain the extreme Population A sources have radio power compatible with emission by mechanisms ultimately due to star formation processes. RL sources of Population B are characteristically jetted. Their broad H-beta profiles can be interpreted as due to a binary broad-line region. We suggest that RL Population B sources should be preferential targets for the search of black hole binaries, and present a sample of binary black hole AGN candidates. The validity of the Kellermann's criterion may be dependent on the source location along the quasar MS. The consideration of the MS trends allowed to distinguish between sources whose radio emission mechanisms is jetted from the ones where the mechanism is likely to be fundamentally different.
Figures


Figures from the paper (11 more)


Reference graph
Works this paper leans on
-
[1]
, " * write output.state after.block = add.period write newline
ENTRY address archiveprefix author booktitle chapter edition editor howpublished institution eprint journal key month note number organization pages publisher school series title type volume year label extra.label sort.label short.list INTEGERS output.state before.all mid.sentence after.sentence after.block FUNCTION init.state.consts #0 'before.all := #1 ...
-
[2]
write newline
" write newline "" before.all 'output.state := FUNCTION n.dashify 't := "" t empty not t #1 #1 substring "-" = t #1 #2 substring "--" = not "--" * t #2 global.max substring 't := t #1 #1 substring "-" = "-" * t #2 global.max substring 't := while if t #1 #1 substring * t #2 global.max substring 't := if while FUNCTION word.in bbl.in " " * FUNCTION format....
-
[3]
2012, , 747, 104
Ackermann , M., Ajello , M., Allafort , A., et al. 2012, , 747, 104
2012
-
[4]
P., R \'o \.z a \'n ska , A., Czerny , B., Hryniewicz , K., & Ferland , G
Adhikari , T. P., R \'o \.z a \'n ska , A., Czerny , B., Hryniewicz , K., & Ferland , G. J. 2016, , 831, 68
2016
-
[5]
L., Yuan , W., Zhou , H
Ai , Y. L., Yuan , W., Zhou , H. Y., et al. 2010, , 716, L31
2010
-
[6]
J., Denney , K
Assef , R. J., Denney , K. D., Kochanek , C. S., et al. 2011, , 742, 93
2011
-
[7]
J., Cowie , L
Barger , A. J., Cowie , L. L., Chen , C. C., et al. 2014, , 784, 9
2014
-
[8]
H., White , R
Becker , R. H., White , R. L., & Helfand , D. J. 1995, , 450, 559
1995
Show all 147 references
-
[9]
C., Hatchett , S
Begelman , M. C., Hatchett , S. P., McKee , C. F., Sarazin , C. L., & Arons , J. 1980, , 238, 722
1980
-
[10]
2016, , 591, A88
Berton , M., Foschini , L., Ciroi , S., et al. 2016, , 591, A88
2016
-
[11]
2015, , 578, A28
Berton , M., Foschini , L., Ciroi , S., et al. 2015, , 578, A28
2015
-
[12]
2005, MNRAS, 364, 187
Bian , W., Yuan , Q., & Zhao , Y. 2005, MNRAS, 364, 187
2005
-
[13]
Blandford , R. D. & Rees , M. J. 1978, , 17, 265
1978
-
[14]
Blandford , R. D. & Znajek , R. L. 1977, , 179, 433
1977
-
[15]
N., & Fink , H
Boller , T., Brandt , W. N., & Fink , H. 1996, , 305, 53
1996
-
[16]
2012, , 759, 118
Bon , E., Jovanovi \'c , P., Marziani , P., et al. 2012, , 759, 118
2012
-
[17]
C ., Ili \'c , D., & Mediavilla , E
Bon , E., Popovi \'c , L. C ., Ili \'c , D., & Mediavilla , E. 2006, , 50, 716
2006
-
[18]
2015, , 360, 7
Bon , N., Bon , E., Marziani , P., & Jovanovi \'c , P. 2015, , 360, 7
2015
-
[19]
2015, , 453, 1079
Bonzini , M., Mainieri , V., Padovani , P., et al. 2015, , 453, 1079
2015
-
[20]
Boroson , T. A. & Green , R. F. 1992, ApJS, 80, 109
1992
-
[21]
S., Wills , B
Brotherton , M. S., Wills , B. J., Francis , P. J., & Steidel , C. C. 1994, , 430, 495
1994
-
[22]
2015, , 451, 1795
Caccianiga , A., Ant \'o n , S., Ballo , L., et al. 2015, , 451, 1795
2015
-
[23]
2013, Star Formation Rate Indicators (Cambridge, UK: Cambridge University Press), 419
Calzetti , D. 2013, Star Formation Rate Indicators (Cambridge, UK: Cambridge University Press), 419
2013
-
[24]
2003, , 341, 993
Cirasuolo , M., Magliocchetti , M., Celotti , A., & Danese , L. 2003, , 341, 993
2003
-
[25]
C., Banerji , M., et al
Coatman , L., Hewett , P. C., Banerji , M., et al. 2019, , 1122
2019
-
[26]
2013, , 559, A18
Comparat , J., Kneib , J.-P., Bacon , R., et al. 2013, , 559, A18
2013
-
[27]
Condon , J. J. 1989, , 338, 13
1989
-
[28]
Condon , J. J. 1992, , 30, 575
1992
-
[29]
J., Huang , Z
Condon , J. J., Huang , Z. P., Yin , Q. F., & Thuan , T. X. 1991, , 378, 65
1991
-
[30]
Corbin , M. R. & Boroson , T. A. 1996, , 107, 69
1996
-
[31]
2016, , 462, 1256
Cracco , V., Ciroi , S., Berton , M., et al. 2016, , 462, 1256
2016
-
[32]
2014, , 445, 4316
Cutini , S., Ciprini , S., Orienti , M., et al. 2014, , 445, 4316
2014
-
[33]
2018, Space Science Reviews, 214, \#32
Czerny , B., Beaton , R., Bejger , M., et al. 2018, Space Science Reviews, 214, \#32
2018
-
[34]
S., Schlegel , D
Dawson , K. S., Schlegel , D. J., Ahn , C. P., et al. 2013, , 145, 10
2013
-
[35]
H., Becker , R
de Vries , W. H., Becker , R. H., & White , R. L. 2006, , 131, 666
2006
-
[36]
De Young , D. S. 1984, , 111, 373
1984
-
[37]
de Young , D. S. 2002, The physics of extragalactic radio sources (The University of Chicago Press)
2002
-
[38]
C., et al
Dong , X.-B., Wang , J.-G., Ho , L. C., et al. 2011, , 736, 86
2011
-
[39]
2016 a , , 820, 27
Du , P., Lu , K.-X., Hu , C., et al. 2016 a , , 820, 27
2016
-
[40]
2016 b , , 818, L14
Du , P., Wang , J.-M., Hu , C., et al. 2016 b , , 818, L14
2016
-
[41]
& Giacani , E
Dubner , G. & Giacani , E. 2015, Astronomy and Astrophysics Review, 23, 3
2015
-
[42]
2017, , 604, A67
Duras , F., Bongiorno , A., Piconcelli , E., et al. 2017, , 604, A67
2017
-
[43]
Falcke , H., Sherwood , W., & Patnaik , A. R. 1996, , 471, 106
1996
-
[44]
2014, , 212, 19
Fernini , I. 2014, , 212, 19
2014
-
[45]
2015, A&A, 575, A13
Foschini , L., Berton , M., Caccianiga , A., et al. 2015, A&A, 575, A13
2015
-
[46]
2017, Frontiers in Astronomy and Space Sciences, 4, 1
Fraix-Burnet, D., Marziani, P., D'Onofrio, M., & Dultzin, D. 2017, Frontiers in Astronomy and Space Sciences, 4, 1
2017
-
[47]
F., Axon , D
Gallimore , J. F., Axon , D. J., O'Dea , C. P., Baum , S. A., & Pedlar , A. 2006, , 132, 546
2006
-
[48]
Gaskell , C. M. 1985, , 315, 386
1985
-
[49]
P., Marecki , A., Kunert-Bajraszewska , M., & Kus , A
Gawro \'n ski , M. P., Marecki , A., Kunert-Bajraszewska , M., & Kus , A. J. 2006, , 447, 63
2006
-
[50]
J., Clowes , R
Graham , M. J., Clowes , R. G., & Campusano , L. E. 1996, , 279, 1349
1996
-
[51]
1999, , 350, 805
Grupe , D., Beuermann , K., Mannheim , K., & Thomas , H.-C. 1999, , 350, 805
1999
-
[52]
Gupta , M., Sikora , M., Rusinek , K., & Madejski , G. M. 2018, , 480, 2861
2018
-
[53]
J., Jarvis , M
G \"u rkan , G., Hardcastle , M. J., Jarvis , M. J., et al. 2015, , 452, 3776
2015
-
[54]
Haas , M., Klaas , U., M \"u ller , S. A. H., et al. 2003, , 402, 87
2003
-
[55]
F., Hernquist , L., Cox , T
Hopkins , P. F., Hernquist , L., Cox , T. J., et al. 2006, , 163, 1
2006
-
[56]
C., et al
Hu , C., Wang , J.-M., Ho , L. C., et al. 2008, ApJL, 683, L115
2008
-
[57]
2006, Journal of Physics: Conference Series, 31, 201
Ito, H., Kino, M., Kawakatu, N., Isobe, N., & Yamada, S. 2006, Journal of Physics: Conference Series, 31, 201
2006
-
[58]
R., et al
Ivezi \'c , Z ., Menou , K., Knapp , G. R., et al. 2002, , 124, 2364
2002
-
[59]
I., Sramek , R., Schmidt , M., Shaffer , D
Kellermann , K. I., Sramek , R., Schmidt , M., Shaffer , D. B., & Green , R. 1989, , 98, 1195
1989
-
[60]
Z., Haiman , Z., Sesana , A., & Hernquist , L
Kelley , L. Z., Haiman , Z., Sesana , A., & Hernquist , L. 2018, arXiv e-prints [ [arXiv] 1809.02138 ]
2018 arXiv
-
[61]
E., Ivezi \'c , Z ., Wiita , P
Kimball , A. E., Ivezi \'c , Z ., Wiita , P. J., & Schneider , D. P. 2011, , 141, 182
2011
-
[62]
& Pounds , K
King , A. & Pounds , K. 2015, , 53, 115
2015
-
[63]
2006, , 132, 531
Komossa , S., Voges , W., Xu , D., et al. 2006, , 132, 531
2006
-
[64]
2008, , 680, 926
Komossa , S., Xu , D., Zhou , H., Storchi-Bergmann , T., & Binette , L. 2008, , 680, 926
2008
-
[65]
W., & Wagner , A
Komossa , S., Xu , D. W., & Wagner , A. Y. 2018 a , , 477, 5115
2018
-
[66]
W., & Wagner , A
Komossa , S., Xu , D. W., & Wagner , A. Y. 2018 b , , 477, 5115
2018
-
[67]
1994, Astronomical Data Analysis Software and Systems III, A.S.P
Kriss , G. 1994, Astronomical Data Analysis Software and Systems III, A.S.P. Conference Series, 61, 437
1994
-
[68]
J., Schmidt , G., et al
Kuraszkiewicz , J., Wilkes , B. J., Schmidt , G., et al. 2009, , 692, 1180
2009
-
[69]
2010, , 718, 368
La Franca , F., Melini , G., & Fiore , F. 2010, , 718, 368
2010
-
[70]
C., et al
Li , Y., Calzetti , D., Kennicutt , R. C., et al. 2010, , 725, 677
2010
-
[71]
C., et al
Li , Y.-R., Wang , J.-M., Ho , L. C., et al. 2016, , 822, 4
2016
-
[72]
2015, , 812, 99
Li , Z., Zhou , H., Hao , L., et al. 2015, , 812, 99
2015
-
[73]
1993, , 406, 451
Lipari , S., Terlevich , R., & Macchetto , F. 1993, , 406, 451
1993
-
[74]
1998, , 115, 2285
Magorrian , J., Tremaine , S., Richstone , D., et al. 1998, , 115, 2285
1998
-
[75]
2014, , 782, L25
Malizia , A., Molina , M., Bassani , L., et al. 2014, , 782, L25
2014
-
[76]
J., Maiolino , R., et al
Marconi , A., Axon , D. J., Maiolino , R., et al. 2009, , 698, L103
2009
-
[77]
& Antonucci , R
Marin , F. & Antonucci , R. 2016, , 830, 82
2016
-
[78]
L., Del Olmo, A., Marziani, P., et al
Mart \' nez-Aldama, M. L., Del Olmo, A., Marziani, P., et al. 2018, Frontiers in Astronomy and Space Sciences, 4, 65
2018
-
[79]
A., Sulentic , J
Marziani , P., Mart \' nez Carballo , M. A., Sulentic , J. W., et al. 2016 a , , 361, 29
2016
-
[80]
& Sulentic , J
Marziani , P. & Sulentic , J. W. 2014, , 442, 1211
2014
-
[81]
W., Plauchu-Frayn , I., & del Olmo , A
Marziani , P., Sulentic , J. W., Plauchu-Frayn , I., & del Olmo , A. 2013, AAp, 555, 89, 16pp
2013
-
[82]
W., Stirpe , G
Marziani , P., Sulentic , J. W., Stirpe , G. M., et al. 2016 b , , 361, 3
2016
-
[83]
W., Zamanov , R., et al
Marziani , P., Sulentic , J. W., Zamanov , R., et al. 2003, ApJS, 145, 199
2003
-
[84]
2000, , 314, L17
Mathur , S. 2000, , 314, L17
2000
-
[85]
E., Lira , P., Netzer , H., Trakhtenbrot , B., & Capellupo , D
Mej \' a-Restrepo , J. E., Lira , P., Netzer , H., Trakhtenbrot , B., & Capellupo , D. M. 2018, Nature Astronomy, 2, 63
2018
-
[86]
& Ekers , R
Merritt , D. & Ekers , R. D. 2002, Science, 297, 1310
2002
-
[87]
L., Nagar , N
Middelberg , E., Roy , A. L., Nagar , N. M., et al. 2004, , 417, 925
2004
-
[88]
A., Falco , E
Mu \ n oz , J. A., Falco , E. E., Kochanek , C. S., Leh \'a r , J., & Mediavilla , E. 2003, , 594, 684
2003
-
[89]
A., Dultzin , D., Marziani , P., & et al
Negrete , C. A., Dultzin , D., Marziani , P., & et al. 2018, in preparation
2018
-
[90]
2013, The Physics and Evolution of Active Galactic Nuclei (Cambridge University Press)
Netzer , H. 2013, The Physics and Evolution of Active Galactic Nuclei (Cambridge University Press)
2013
-
[91]
C., et al
Nguyen , K., Bogdanovic , T., Runnoe , J. C., et al. 2019, arXiv e-prints, arXiv:1908.01799
2019 arXiv
-
[92]
& Done , C
Noda , H. & Done , C. 2018, , 480, 3898
2018
-
[93]
O'Dea , C. P. 1998, , 110, 493
1998
-
[94]
Orr , M. J. L. & Browne , I. W. A. 1982, , 200, 1067
1982
-
[95]
2016, AApR, 24, 13
Padovani , P. 2016, AApR, 24, 13
2016
-
[96]
2017, Frontiers in Astronomy and Space Sciences, 4, 35
Padovani , P. 2017, Frontiers in Astronomy and Space Sciences, 4, 35
2017
-
[97]
P., et al
Panda, S., Czerny, B., Adhikari, T. P., et al. 2018, The Astrophysical Journal, 866, 115
2018
-
[98]
2019, arXiv e-prints, arXiv:1905.01729
Panda , S., Marziani , P., & Czerny , B. 2019, arXiv e-prints, arXiv:1905.01729
2019 arXiv
-
[99]
D., Laor , A., et al
Panessa , F., Baldi , R. D., Laor , A., et al. 2019, Nature Astronomy, 3, 387
2019
-
[100]
P., et al
P \^a ris , I., Petitjean , P., Ross , N. P., et al. 2017, , 597, A79
2017
-
[101]
2010, , 713, 232
Punsly , B. 2010, , 713, 232
2010
-
[102]
P., & Hurley-Walker , N
Reynolds , C., Punsly , B., Miniutti , G., O'Dea , C. P., & Hurley-Walker , N. 2017, , 836, 155
2017
-
[103]
T., Kruczek , N
Richards , G. T., Kruczek , N. E., Gallagher , S. C., et al. 2011, , 141, 167
2011
-
[104]
J., Rowan-Robinson , M., & Church , S
Rigopoulou , D., Lawrence , A., White , G. J., Rowan-Robinson , M., & Church , S. E. 1996, , 305, 747
1996
-
[105]
1965, , 141, 1560
Sandage , A. 1965, , 141, 1560
1965
-
[106]
B., Kartaltepe , J
Sanders , D. B., Kartaltepe , J. S., Kewley , L. J., et al. 2009, in Astronomical Society of the Pacific Conference Series, Vol. 408, The Starburst-AGN Connection, ed. W. Wang , Z. Yang , Z. Luo , & Z. Chen , 3
2009
-
[107]
Sanders , D. B. & Mirabel , I. F. 1996, , 34, 749
1996
-
[108]
B., Soifer , B
Sanders , D. B., Soifer , B. T., Elias , J. H., et al. 1988, , 325, 74
1988
-
[109]
2010, MNRAS, 403, 1246
Sani , E., Lutz , D., Risaliti , G., et al. 2010, MNRAS, 403, 1246
2010
-
[110]
2013, Bulletin of the Astronomical Society of India, 41, 61
Shen , Y. 2013, Bulletin of the Astronomical Society of India, 41, 61
2013
-
[111]
& Ho , L
Shen , Y. & Ho , L. C. 2014, , 513, 210
2014
-
[112]
& Liu , X
Shen , Y. & Liu , X. 2012, , 753, 125
2012
-
[113]
2007, , 658, 815
Sikora , M., Stawarz , ., & Lasota , J.-P. 2007, , 658, 815
2007
-
[114]
Smith , D. J. B., Jarvis , M. J., Hardcastle , M. J., et al. 2014, , 445, 2232
2014
-
[115]
Snedden , S. A. & Gaskell , C. M. 2007, ApJ, 669, 126
2007
-
[116]
S., Peterson , B
Storchi-Bergmann , T., Schimoia , J. S., Peterson , B. M., et al. 2017, , 835, 236
2017
-
[117]
& Marziani , P
Sulentic , J. & Marziani , P. 2015, Frontiers in Astronomy and Space Sciences, 2, 6
2015
-
[118]
2011, Baltic Astronomy, 20, 427
Sulentic , J., Marziani , P., & Zamfir , S. 2011, Baltic Astronomy, 20, 427
2011
-
[119]
W., Calvani , M., & Marziani , P
Sulentic , J. W., Calvani , M., & Marziani , P. 2001 a , The Messenger, 104, 25
2001
-
[120]
W., del Olmo , A., Marziani , P., et al
Sulentic , J. W., del Olmo , A., Marziani , P., et al. 2017, , 608, A122
2017
-
[121]
W., Dultzin-Hacyan , D., Marziani , P., et al
Sulentic , J. W., Dultzin-Hacyan , D., Marziani , P., et al. 2006, Revista Mexicana de Astronomia y Astrofisica, 42, 23
2006
-
[122]
W., Mart \' nez-Carballo , M
Sulentic , J. W., Mart \' nez-Carballo , M. A., Marziani , P., et al. 2015, , 450, 1916
2015
-
[123]
W., Marziani , P., & Calvani , M
Sulentic , J. W., Marziani , P., & Calvani , M. 2001 b , in AIP CP, Vol. 599, X-ray Astronomy: Stellar Endpoints, AGN, and the Diffuse X-ray Background, 963--966
2001
-
[124]
W., Marziani , P., & Dultzin-Hacyan , D
Sulentic , J. W., Marziani , P., & Dultzin-Hacyan , D. 2000 a , ARA&A, 38, 521
2000
-
[125]
W., Marziani , P., Zamanov , R., et al
Sulentic , J. W., Marziani , P., Zamanov , R., et al. 2002, ApJL, 566, L71
2002
-
[126]
W., Zamfir , S., Marziani , P., & Dultzin , D
Sulentic , J. W., Zamfir , S., Marziani , P., & Dultzin , D. 2008, in Revista Mexicana de Astronomia y Astrofisica Conference Series, Vol. 32, 51--58
2008
-
[127]
W., Zwitter , T., Marziani , P., & Dultzin-Hacyan , D
Sulentic , J. W., Zwitter , T., Marziani , P., & Dultzin-Hacyan , D. 2000 b , ApJL, 536, L5
2000
-
[128]
& Shen , Y
Sun , J. & Shen , Y. 2015, , 804, L15
2015
-
[129]
S., Antonucci , R
Ulvestad , J. S., Antonucci , R. R. J., & Barvainis , R. 2005, , 621, 123
2005
-
[130]
Urry , C. M. & Padovani , P. 1995, PASP, 107, 803
1995
-
[131]
M., Hamann , F., & Rupke , D
Veilleux , S., Mel \'e ndez , M., Tripp , T. M., Hamann , F., & Rupke , D. S. N. 2016, , 825, 42
2016
-
[132]
V \'e ron-Cetty , M.-P., V \'e ron , P., & Gon c alves , A. C. 2001, AAp, 372, 730
2001
-
[133]
2009, VizieR Online Data Catalog, VIII/85A
Vollmer , B. 2009, VizieR Online Data Catalog, VIII/85A
2009
-
[134]
& Li , Y
Wang , J. & Li , Y. 2011, , 742, L12
2011
-
[135]
S., et al
Wang , J.-M., Du , P., Brotherton , M. S., et al. 2017, Nature Astronomy, 1, 775
2017
-
[136]
2014, , 792, L13
Wang , J.-M., Du , P., Li , Y.-R., et al. 2014, , 792, L13
2014
-
[137]
Wills , B. J. & Browne , I. W. A. 1986, , 302, 56
1986
-
[138]
Wilson , A. S. & Colbert , E. J. M. 1995, , 438, 62
1995
-
[139]
& Urry , C
Woo , J.-H. & Urry , C. M. 2002, , 581, L5
2002
-
[140]
2009, , 398, 1905
Wu , Q. 2009, , 398, 1905
2009
-
[141]
S., Reddy , N
Yun , M. S., Reddy , N. A., & Condon , J. J. 2001, , 554, 803
2001
-
[142]
L., Hamann , F., P \^a ris , I., et al
Zakamska , N. L., Hamann , F., P \^a ris , I., et al. 2016, , 459, 3144
2016
-
[143]
W., et al
Zamanov , R., Marziani , P., Sulentic , J. W., et al. 2002, ApJL, 576, L9
2002
-
[144]
W., & Marziani , P
Zamfir , S., Sulentic , J. W., & Marziani , P. 2008, MNRAS, 387, 856
2008
-
[145]
W., Marziani , P., & Dultzin , D
Zamfir , S., Sulentic , J. W., Marziani , P., & Dultzin , D. 2010, , 403, 1759
2010
-
[146]
Zhang , K., Dong , X.-B., Wang , T.-G., & Gaskell , C. M. 2011, , 737, 71
2011
-
[147]
J., Engels , D., Hagen , H
Zickgraf , F. J., Engels , D., Hagen , H. J., Reimers , D., & Voges , W. 2003, , 406, 535
2003
Reviewed August 14, 2026 · model on record in the stance chip above.
Discussion (0). Continue with ORCID to comment.