REVIEW 3 major objections 4 minor 85 references
Constraining the properties of gaseous halos via cross-correlations of upcoming galaxy surveys and thermal Sunyaev-Zel'dovich maps
T0 review · 3 major / 4 minor · reviewed 2026-08-14 · deepseek-v4-flash
Pith's one-line read Cross-correlating galaxies with CMB maps can rule out feedback models.
desk verdict Solid, clearly-written forecast that makes a real subfield contribution; the low-mass halo constraints lean on a cluster-calibrated miscentering prior that the paper itself flags, but the galaxy-based path is independent and the central claim holds. read the letter →
The pith
A machine-rendered reading of the paper's core claim, the machinery that carries it, and where it could break.
The reading
What carries the argument
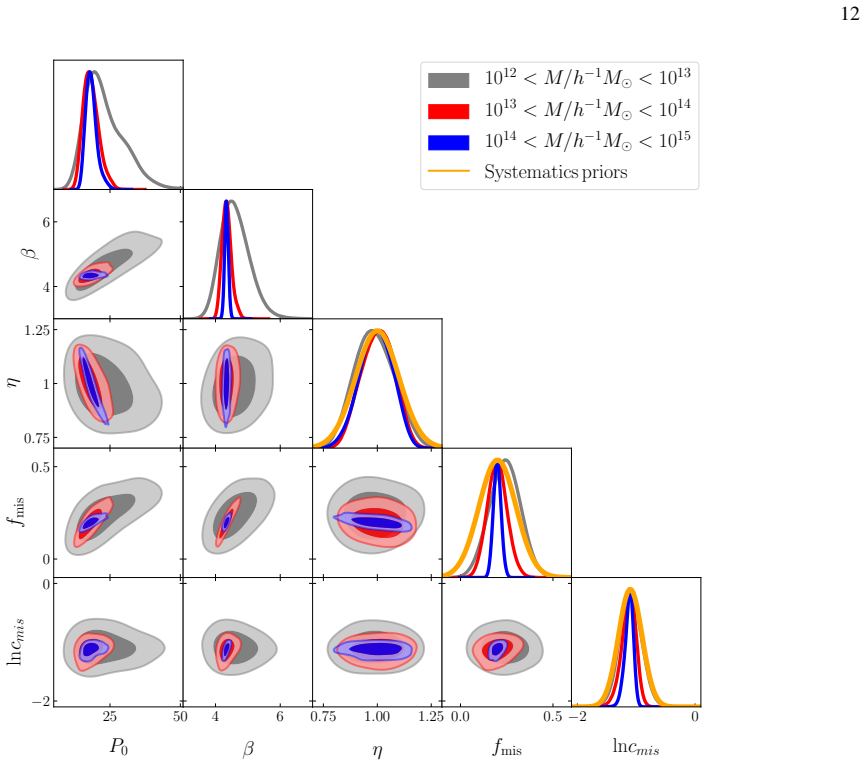
The load-bearing object is the parameterized halo pressure profile $P_e(x|M,z)$, written as a generalized Navarro-Frenk-White form with amplitude $P_0$, shape $\beta$, and a set of mass-scaling indices, with additional low-mass freedom added for the galaxy-based forecasts. Fourier-transformed into multipole-space profiles and combined with the halo model's one- and two-halo terms, this profile predicts the halo-y and galaxy-y cross-spectra. The other essential pieces are the miscentering model (a Rayleigh-distributed offset convolved into the real-space profile) and a lognormal mass-bias distribution with a 10 percent prior, which capture the systematics that otherwise bias the inferred pressure profiles.
What would settle it
Measure the stacked tSZ profile around DESI-identified groups with measured masses near $10^{12}$–$10^{13}$ solar masses using a CMB-S4-like y map, and compare the recovered amplitude and shape of the pressure profile with the forecast 2-$\sigma$ bands; the claim would be falsified if the actual error bars are much larger, or if the small-scale profile is suppressed far more than the assumed 22 percent miscentered fraction predicts.
Extended reading notes
Core claim
On its own terms, the paper claims that upcoming measurements of the two-point cross-correlation between dark matter halos (or galaxies) and Compton-y maps will turn the tSZ effect into a precision probe of baryon physics in group-scale halos. Treating the pressure profile as a generalized NFW form with free amplitude P0 and shape beta, and marginalizing over miscentering and mass-bias systematics, the forecasts show 2-sigma uncertainty bands on the 3D pressure profiles that are narrow enough to separate the feedback models realized in current hydrodynamical simulations. The projected constraints on the integrated Y-M relation from halo-y correlations and galaxy-y correlations are far tighter than those from the y auto-spectrum at low halo mass, enabling a direct test of whether AGN and supernova feedback prescriptions capture the thermodynamic state of the gas.
Load-bearing premise
The load-bearing assumption is that the miscentering parameters measured for massive optically selected clusters (a typical offset scale and a 22 percent miscentered fraction) apply unchanged to halos as light as $10^{12}$ solar masses.
Editorial extensions
If this is right
- DESI-like halo samples correlated with CMB-S4-like y maps should detect the one-halo tSZ signal at roughly 40, 210, and 510 sigma in the mass bins $10^{12}$–$10^{13}$, $10^{13}$–$10^{14}$, and $10^{14}$–$10^{15}$ solar masses per $h$, at $z$ between 0.2 and 0.3.
- Pressure-profile constraints from halo-y correlations are good enough to distinguish the feedback models in current hydrodynamical simulations, including on the integrated $\tilde{Y}$-$M$ relation.
- The Compton-y auto-spectrum alone gives much weaker constraints on low-mass halos, so galaxy and halo cross-correlations are necessary to probe group-scale gas.
- At high halo mass, the halo-y data can self-calibrate the miscentering parameters, while at low mass the assumed miscentering prior matters more than mass calibration.
- Halo-y pressure constraints are only weakly degenerate with $\sigma_8$, unlike the y auto-spectrum, so they remain informative even when cosmology is left free.
Reading between the lines
- A natural extension is to split the galaxy sample by color or star-formation activity at fixed halo mass; the same measurement would then test whether red galaxies show more extended or hotter gas, as feedback quenching scenarios predict.
- Combining these tSZ cross-correlations with kinematic SZ measurements around the same halos could separate thermal from non-thermal pressure support, a quantity feedback models predict but current tSZ data alone cannot measure.
- If the miscentering extrapolation to low-mass halos is wrong, the forecast degradation suggests that investing in better group centering (e.g., from deep imaging or weak-lensing peak positions) may be as valuable as deeper CMB maps for the low-mass science case.
- The same HOD-based pipeline applied to photometric samples like LSST should work without the need for a group catalog, since the modeling marginalizes over the galaxy-halo connection.
Signed reviews
Editorial analysis
A structured set of objections, weighed in public.
Referee Report
Summary. This paper forecasts how well future galaxy and halo samples (DESI-like and LSST-like) cross-correlated with Simons Observatory and CMB-S4 Compton-y maps will constrain the pressure profiles of dark matter halos. The authors use the halo model with one- and two-halo terms, a generalized NFW pressure profile based on Battaglia et al. (2012) with additional low-mass freedom, Gaussian plus non-Gaussian covariance, and parameterized systematics for halo miscentering and mass bias. They report projected signal-to-noise of roughly 40, 210, and 510 sigma for halo mass bins 10^12-10^13, 10^13-10^14, and 10^14-10^15 Msun/h, forecast tight 3D pressure profile constraints, and argue that the resulting Y-M relation constraints can distinguish feedback prescriptions such as AGN8/AGN8.5 from the shock-heating model.
Significance. If the forecasts hold, this work makes a strong case that small-beam CMB surveys combined with DESI/LSST galaxy samples will transform tSZ cross-correlations from detections into precision measurements of group-scale baryon physics, with direct consequences for feedback modeling and for the control of baryonic systematics in weak lensing. The analysis is careful in several respects: the parameterized treatment of miscentering and mass bias, the realistic SO/CMB-S4 noise curves including atmospheric noise and ILC residuals, and the comparison against independent hydrodynamical feedback predictions. The main caveats are that the forecasts are self-consistency forecasts in which mock data are generated with the fiducial model and fit with the same model, and that several simplifying assumptions with potentially large impact are not quantified.
major comments (3)
- [§II.D.1, §III.B, Fig. 5] The low-mass pressure-profile constraints that underpin the central claim are purchased with a cluster-calibrated miscentering prior that is explicitly extrapolated to group-scale halos: the text states that the Rykoff et al. (2016) constraints 'effectively extrapolate' to low halo masses. Since §III.B notes that for low-mass halos the miscentering-fraction prior matters more than mass calibration, and Fig. 5 shows prior-dominated fmis constraints in the low-mass bins, the tightness of the blue bands in Fig. 3 and the feedback-discrimination power in Fig. 6 depend on this unvalidated assumption. I request sensitivity tests with e.g. fmis ~ 0.5 and/or a wider ln cmis prior, and that the low-mass claims be restated as conditional on the assumed group-scale miscentering distribution.
- [§II.C, Eq. (22)] The non-Gaussian covariance is set exactly to zero for all halo-involving spectra on the grounds that 'the one-halo term should not contribute to the trispectrum of correlations involving halos.' This is asserted rather than demonstrated, and a naive halo-model treatment of discrete halos would seem to produce a Poisson-type contribution (e.g. proportional to the integral of dn/dM times the squared y-profile for the halo-y covariance) that is not included in the Gaussian term. Because the headline signal-to-noise values and the parameter-error forecasts in Figs. 3-6 are computed with this covariance, the impact of the omitted term should be quantified, or a derivation/citation should be supplied if the term is genuinely absent.
- [§II.E.2] The halo-based forecasts assume unity completeness for the halo catalog. For the lowest mass bin, 10^12-10^13 Msun/h, this is optimistic relative to existing group catalogs, and the paper itself notes that Yang et al. (2007) achieved only about 85% completeness above 10^12 Msun/h. Mass-dependent incompleteness would both enlarge the errors and bias the recovered pressure profiles. A sensitivity test at plausible completeness levels, or a discussion of how incompleteness would propagate into the Fig. 3 constraints, would strengthen the forecasts.
minor comments (4)
- [§II.B] 'Viral mass' should read 'virial mass' in the sentence describing the relation between r_s and r_vir.
- [§II.D.3, Fig. 3] The assumption that CIB contamination can be controlled below statistical errors is an important caveat for the high-redshift bin (0.9 < z < 1.2) in Fig. 3, where the authors acknowledge CIB is more problematic; a quantitative estimate of the residual CIB bias would help the reader assess the high-redshift constraints.
- [References] The reference labeled 'Planck Collaboration et al., 2016a' appears malformed (it contains '] 10.1051 /0004-6361/201629022' in place of a complete citation) and should be corrected.
- [Figs. 6 and 9] The y-axis labels use the ratio ilde Y500/(M500/10^15 h^-1 Msun)^5/3; defining ilde Y once in the caption or text, as is done in Eq. (33), would make the figures easier to interpret without cross-referencing.
Circularity Check
No significant circularity: the forecast uses standard halo-model signal and covariance inputs, with pressure-profile, feedback, miscentering, and mass-calibration inputs drawn from independent external work.
full rationale
The paper's derivation chain is a standard forecast: it computes halo-y and galaxy-y power spectra from a halo-model formalism (Tinker mass function and bias, Battaglia et al. 2012 pressure profile), assigns covariance from Gaussian and one-halo trispectrum terms plus external survey noise curves (SO, CMB-S4), and then fits the same model to mock data vectors generated from the fiducial model. This is a self-consistency forecast, not a circular derivation: the tightness of the projected constraints is controlled by the covariance and by parameter degeneracies, not by construction, and the paper does not claim an external measurement. The feedback-model discrimination in Figs. 6 and 9 uses predictions from Le Brun et al. (2015) hydrodynamical simulations, which are independent external benchmarks and are not self-citations. The miscentering priors come from Rykoff et al. (2016) and the mass-bias prior from external weak-lensing calibration estimates; the paper explicitly flags the low-mass miscentering extrapolation as an assumption. That is a limitation or correctness risk, not circularity. Self-citations to prior work (Hill et al. 2018, Pandey et al. 2019) are contextual and not load-bearing. No quoted equation or parameter is defined in terms of the target result, and no fitted quantity is renamed as a prediction.
Assumptions & free parameters
free parameters (14)
- P0 =
18.1
- beta =
4.35
- alpha_p,high =
0.154
- alpha_p,mid =
0.0
- alpha_p,low =
0.0
- log M0 =
12.23
- log M1 =
12.75
- alpha_g =
0.99
- ln cmis =
-1.1
- fmis =
0.2
- eta =
1.0
- Mhigh =
3e14 Msun/h
- Mlow =
3e13 Msun/h
- sigma_lnM =
0.5
assumptions (10)
- domain assumption The Battaglia et al. (2012) AGN-200c generalized NFW pressure profile is an adequate template for halo gas pressure across 1e12-1e15 Msun/h, with only amplitude and outer slope free.
- standard math Tinker et al. (2008, 2010) fitting functions for the halo mass function and linear bias are accurate.
- domain assumption Electron pressure relates to total pressure via the primordial helium mass fraction Y according to Eq. 4.
- domain assumption Covariance can be modeled as Gaussian plus one-halo trispectrum, with the non-Gaussian term set to zero for correlations involving halos.
- domain assumption Galaxy and halo catalogs are complete within the chosen mass and redshift bins.
- domain assumption CIB contamination of the y maps can be controlled below statistical errors.
- ad hoc to paper Rykoff et al. (2016) miscentering constraints for galaxy clusters apply to all halo masses down to 1e12 Msun/h.
- domain assumption Halo masses can be calibrated to 10% precision via weak lensing or other methods.
- domain assumption HOD parameters from the SDSS volume-limited sample (Zehavi et al. 2011) describe the DESI BGS sample.
- standard math Flat LCDM with Planck 2018 best-fit parameters is the underlying cosmology.
Cite this review
Pith. "Pith review of Constraining the properties of gaseous halos via cross-correlations of upcoming galaxy surveys and thermal Sunyaev-Zel'dovich maps." pith.science (2026). https://pith.science/paper/Y5EB7DCA
@misc{pith2026190900405,
  author       = {Pith},
  title        = {Pith review of: Constraining the properties of gaseous halos via cross-correlations of upcoming galaxy surveys and thermal Sunyaev-Zel'dovich maps},
  year         = {2026},
  howpublished = {\url{https://pith.science/paper/Y5EB7DCA}},
  note         = {Machine review of arXiv:1909.00405}
}
abstract
The thermal Sunyaev-Zel'dovich (tSZ) effect induces a Compton-$y$ distortion in cosmic microwave background (CMB) temperature maps that is sensitive to a line of sight integral of the ionized gas pressure. By correlating the positions of galaxies with maps of the Compton-$y$ distortion, one can probe baryonic feedback processes and study the thermodynamic properties of a significant fraction of the gas in the Universe. Using a model fitting approach, we forecast how well future galaxy and CMB surveys will be able to measure these correlations, and show that powerful constraints on halo pressure profiles can be obtained. Our forecasts are focused on correlations between galaxies and halos identified by the upcoming Dark Energy Spectroscopic Instrument survey and tSZ maps from the Simons Observatory and CMB-S4 experiments, but have general applicability to other surveys, such as the Large Synoptic Survey Telescope. We include prescriptions for observational systematics, such as halo miscentering and halo mass bias, demonstrating several important degeneracies with pressure profile parameters. Assuming modest priors on these systematics, we find that measurements of halo-$y$ and galaxy-$y$ correlations with future surveys will yield tight constraints on the pressure profiles of group-scale dark matter halos, and enable current feedback models to either be confirmed or ruled out.
Figures


Figures from the paper (8 more)



Reference graph
Works this paper leans on
-
[1]
In this process, some assumptions must be made about the centers of these halos [e.g
Miscentering Our halo-based forecasts assume that the galaxy distribu- tion has been used to identify the locations of halos. In this process, some assumptions must be made about the centers of these halos [e.g. 72]. Frequently, the halo center is chosen to be at the location of the brightest galaxy in the identified halo. However, this prescription may no...
-
[2]
Mass bias For the halo-based forecasts, we assume that the halo popu- lation can be divided into bins based on halo mass. Of course, inferring halo masses is challenging, and may be subject to systematic errors; we refer to any difference between the true halo mass and the assumed halo mass as mass bias. Perhaps the most powerful way to infer halo masses i...
-
[3]
Of these, the CIB is potentially the most problematic, as shown in e.g
Biases in the y maps Another potential source of systematic error for the halo- y correlation measurements is contamination of the Compton- y maps by other sources of mm-wave emission, such as the cosmic infrared background (CIB) and radio point sources [56]. Of these, the CIB is potentially the most problematic, as shown in e.g. Pandey et al. [51], since...
-
[4]
Battaglia N., Bond J. R., Pfrommer C., Sievers J. L., Sijacki D., 2010, ApJ, 725, 91
work page 2010
-
[5]
wide-field survey
CMB surveys We focus on the future CMB-S4 survey [2] and also present some results for the imminent Simons Observatory (SO) sur- vey [3] in this work, although ongoing ground-based CMB surveys (e.g., Advanced ACT [31] and SPT-3G [12]) should also produce high-precision tSZ cross-correlation measure- ments in the near term. The specifications of the SO and ...
2022
-
[6]
Galaxy survey: halos For the galaxy survey, we consider two types of forecasts. The first assumes that the galaxy survey is used to identify an underlying population of dark matter halos. The second type 1 https://simonsobservatory.org/assets/supplements/ 20180822_SO_Noise_Public.tgz 8 assumes that the galaxy-y correlation is measured directly, and a HOD i...
-
[7]
We adopt the HOD model described in §II B
Galaxy survey: galaxies Our galaxy-based forecast is designed to represent the BGS sample of DESI [21]. We adopt the HOD model described in §II B. We choose the fiducial values of the HOD parame- ters to be equal to the best fit values for sub-sample of SDSS redshift survey galaxies having absolute magnitude less than -19.5 [73] since BGS galaxies are expec...
-
[8]
Battaglia N., et al., 2019, in Bulletin of the American Astro- nomical Society. p. 297 (arXiv:1903.04647)
arXiv 2019
Show all 85 references
-
[9]
N., et al., 2016, preprint, ( arXiv:1610.02743)
Abazajian K. N., et al., 2016, preprint, ( arXiv:1610.02743)
2016 arXiv
- [10]
-
[11]
Ade P., et al., 2019, JCAP, 2019, 056
2019
-
[12]
A., et al., 2014, in Millimeter, Submillimeter, and Far-Infrared Detectors and Instrumentation for Astronomy VII
Benson B. A., et al., 2014, in Millimeter, Submillimeter, and Far-Infrared Detectors and Instrumentation for Astronomy VII. p. 91531P (arXiv:1407.2973), doi:10.1117/12.2057305
2014 arXiv
-
[13]
R., Pfrommer C., Sievers J
Battaglia N., Bond J. R., Pfrommer C., Sievers J. L., 2012, ApJ, 758, 75
2012
-
[14]
C., Murray N., 2015, ApJ, 812, 154
Battaglia N., Hill J. C., Murray N., 2015, ApJ, 812, 154
2015
-
[15]
N., 2017, Journal of Cosmology and Astro-Particle Physics, 2017, 040
Battaglia N., Ferraro S., Schaan E., Spergel D. N., 2017, Journal of Cosmology and Astro-Particle Physics, 2017, 040
2017
-
[16]
will extend the reach of these measurements to lower halo 17 0.95 1.00 αg 4 5β □1 0 αp,high 0 1αp,mid □2.5 0 2.5 αp,low 12.2 12.3 log M0 12.7 12.75 log M1 10 20 30 P0 0.95 1 αg 4 5 β □1 0 αp,high 0 1 αp,mid □2.5 0.0 2.5 αp,low 12.2 12.3 log M0 12.70 12.75 log M1 FIG. 10. Const...
-
[17]
J., Rozo E., Jain B., Rykoff E., Wechsler R
Baxter E. J., Rozo E., Jain B., Rykoff E., Wechsler R. H., 2016, MNRAS, 463, 205
2016
-
[18]
J., 2010, Physics Reports, 495, 33
Benson A. J., 2010, Physics Reports, 495, 33
2010
-
[19]
J., Bower R
Benson A. J., Bower R. G., Frenk C. S., Lacey C. G., Baugh C. M., Cole S., 2003, The Astrophysical Journal, 599, 38
2003
-
[20]
Crichton D., et al., 2016, Monthly Notices of the Royal Astro- nomical Society, 458, 1478
2016
-
[21]
Bolliet B., Brinckmann T., Chluba J., Lesgourgues J., 2019, arXiv e-prints,
2019
-
[22]
L., Norman M
Bryan G. L., Norman M. L., 1998, ApJ, 495, 80
1998
-
[23]
E., Holder G
Carlstrom J. E., Holder G. P., Reese E. D., 2002, Annual Re- view of Astronomy and Astrophysics, 40, 643
2002
-
[24]
E., et al., 2011, Publications of the Astronomical Society of the Pacific, 123, 568
Carlstrom J. E., et al., 2011, Publications of the Astronomical Society of the Pacific, 123, 568
2011
-
[25]
E., et al., 2019, The Open Journal of Astrophysics, 2, 4
Chisari N. E., et al., 2019, The Open Journal of Astrophysics, 2, 4
2019
-
[26]
Cooray A., 2001, Phys. Rev. D, 64, 063514
2001
-
[27]
Rep., 372, 1
Cooray A., Sheth R., 2002, Phys. Rep., 372, 1
2002
-
[28]
M., Burkert A., Ntormousi E., Fierlinger P., Schartmann M., Ballone A., Krause M
Fierlinger K. M., Burkert A., Ntormousi E., Fierlinger P., Schartmann M., Ballone A., Krause M. G. H., Diehl R., 2016, Monthly Notices of the Royal Astronomical Society, 456, 710
2016
-
[29]
DESI Collaboration et al., 2016, arXiv e-prints,
2016
- [30]
-
[31]
Efstathiou G., 2000, MNRAS, 317, 697
2000
-
[32]
R., Hearin A
Eifler T., Krause E., Dodelson S., Zentner A. R., Hearin A. P., Gnedin N. Y ., 2015, MNRAS, 454, 2451
2015
-
[33]
K., Banday A
Eriksen H. K., Banday A. J., Górski K. M., Lilje P. B., 2004, ApJ, 612, 633
2004
-
[34]
E., Rozo E., Rykoff E
Farahi A., Evrard A. E., Rozo E., Rykoff E. S., Wechsler R. H., 2016, MNRAS, 460, 3900
2016
-
[35]
P., Bridges M., 2009, MNRAS, 398, 1601
Feroz F., Hobson M. P., Bridges M., 2009, MNRAS, 398, 1601
2009
-
[36]
Hojjati A., et al., 2017, MNRAS, 471, 1565
2017
-
[37]
P., Hill J
Greco J. P., Hill J. C., Spergel D. N., Battaglia N., 2015, ApJ, 808, 151
2015
-
[38]
R., et al., 2019, arXiv e-prints, p
Hall K. R., et al., 2019, arXiv e-prints, p. arXiv:1907.11731
2019 arXiv
-
[39]
W., et al., 2016, Journal of Low Temperature Physics, 184, 772
Henderson S. W., et al., 2016, Journal of Low Temperature Physics, 184, 772
2016
-
[40]
C., Pajer E., 2013, Phys
Hill J. C., Pajer E., 2013, Phys. Rev. D, 88, 063526
2013
-
[41]
C., Spergel D
Hill J. C., Spergel D. N., 2014, JCAP, 2014, 030
2014
-
[42]
C., Baxter E
Hill J. C., Baxter E. J., Lidz A., Greco J. P., Jain B., 2018, Phys. Rev. D, 97, 083501
2018
-
[43]
G., Harnois-Deraps J., Ma Y .-Z., Van Waerbeke L., Hinshaw G., Le Brun A
Hojjati A., McCarthy I. G., Harnois-Deraps J., Ma Y .-Z., Van Waerbeke L., Hinshaw G., Le Brun A. M. C., 2015, JCAP, 2015, 047
2015
-
[44]
Le Brun A. M. C., McCarthy I. G., Melin J.-B., 2015, Monthly Notices of the Royal Astronomical Society, 451, 3868
2015
-
[45]
Horowitz B., Seljak U., 2017, MNRAS, 469, 394
2017
-
[46]
Hu W., Jain B., 2004, Phys. Rev. D, 70, 043009
2004
-
[47]
Huang H.-J., Eifler T., Mandelbaum R., Dodelson S., 2019, Monthly Notices of the Royal Astronomical Society, 488, 1652
2019
-
[48]
Komatsu E., Kitayama T., 1999, ApJ, 526, L1
1999
-
[49]
Komatsu E., Seljak U., 2002, MNRAS, 336, 1256
2002
-
[50]
arXiv:0912.0201
LSST Science Collaboration et al., 2009, arXiv e-prints, p. arXiv:0912.0201
2009 arXiv
-
[51]
Le Brun A. M. C., McCarthy I. G., Schaye J., Ponman T. J., 2014, MNRAS, 441, 1270
2014
-
[52]
C., et al., 2018, in Proc
Parshley S. C., et al., 2018, in Proc. SPIE. p. 107005X (arXiv:1807.06675), doi:10.1117/12.2314046
2018 arXiv
-
[53]
Lin Y .-T., Mandelbaum R., Huang Y .-H., Huang H.-J., Dalal N., Diemer B., Jian H.-Y ., Kravtsov A., 2016, The Astrophysical Journal, 819, 119
2016
-
[54]
S., et al., 2019, arXiv e-prints, p
Madhavacheril M. S., et al., 2019, arXiv e-prints, p. arXiv:1911.05717
2019 arXiv
-
[55]
Makiya R., Ando S., Komatsu E., 2018, MNRAS, 480, 3928
2018
-
[56]
G., Le Brun A
McCarthy I. G., Le Brun A. M. C., Schaye J., Holder G. P., 2014, MNRAS, 440, 3645
2014
-
[57]
McClintock T., et al., 2019, MNRAS, 482, 1352
2019
-
[58]
F., Frenk C
Navarro J. F., Frenk C. S., White S. D. M., 1996, ApJ, 462, 563
1996
- [59]
-
[60]
S., et al., 2014, ApJ, 785, 104
Ryko ff E. S., et al., 2014, ApJ, 785, 104
2014
-
[61]
Planck Collaboration et al., 2013a, A&A, 557, A52
-
[62]
Planck Collaboration et al., 2013b, A&A, 557, A52
-
[63]
Planck Collaboration et al., 2016a, ] 10.1051 /0004- 6361/201629022
-
[64]
Planck Collaboration et al., 2016b, A&A, 594, A22
- [65]
- [66]
-
[67]
F., 2011, Monthly Notices of the Royal Astronomical Society, 410, 2481
Remazeilles M., Delabrouille J., Cardoso J. F., 2011, Monthly Notices of the Royal Astronomical Society, 410, 2481
2011
-
[68]
L., Robertson B
Tinker J. L., Robertson B. E., Kravtsov A. V ., Klypin A., War- ren M. S., Yepes G., Gottlöber S., 2010, ApJ, 724, 878
2010
-
[69]
S., et al., 2016, ApJS, 224, 1
Ryko ff E. S., et al., 2016, ApJS, 224, 1
2016
-
[70]
Seljak U., 2000, MNRAS, 318, 203
2000
-
[71]
Soergel B., Giannantonio T., Efstathiou G., Puchwein E., Si- jacki D., 2017, MNRAS, 468, 577
2017
-
[72]
Spacek A., Scannapieco E., Cohen S., Joshi B., Mauskopf P., 2017, ApJ, 834, 102
2017
-
[73]
The parameter M0 denotes the minimum mass a halo should have to host a satellite galaxy, M1 is the pivot mass of power law scaling relation and αg is the power law index
for the volume limited galaxy sample having absolute magnitude less than -19.5, the forecasted maximum absolute magnitude of the DESI Bright Galaxy Survey (BGS) sample. The parameter M0 denotes the minimum mass a halo should have to host a satellite galaxy, M1 is the pivot mas...
-
[74]
A., Zeldovich Y
Sunyaev R. A., Zeldovich Y . B., 1972, Comments on Astro- physics and Space Physics, 4, 173
1972
-
[75]
S., et al., 2011, ApJS, 194, 41
Swetz D. S., et al., 2011, ApJS, 194, 41
2011
-
[76]
V ., Klypin A., Abazajian K., Warren M., Yepes G., Gottlöber S., Holz D
Tinker J., Kravtsov A. V ., Klypin A., Abazajian K., Warren M., Yepes G., Gottlöber S., Holz D. E., 2008, ApJ, 688, 709
2008
-
[77]
Van Waerbeke L., Hinshaw G., Murray N., 2014, Phys. Rev. D, 89, 023508
2014
-
[78]
G., Magneville C., Palanque- Delabrouille N., Yèche C., 2016, A&A, 588, A61
Verdier L., Melin J.-B., Bartlett J. G., Magneville C., Palanque- Delabrouille N., Yèche C., 2016, A&A, 588, A61
2016
-
[79]
Vikram V ., Lidz A., Jain B., 2017, MNRAS, 467, 2315
2017
-
[80]
J., van den Bosch F
Yang X., Mo H. J., van den Bosch F. C., Pasquali A., Li C., Barden M., 2007, ApJ, 671, 153
2007
-
[81]
Zehavi I., et al., 2011, ApJ, 736, 59
2011
-
[82]
Zheng Z., et al., 2005, ApJ, 633, 791
2005
-
[83]
Zuntz J., et al., 2015, Astronomy and Computing, 12, 45
2015
-
[84]
P., Schaye J., Booth C
van Daalen M. P., Schaye J., Booth C. M., Dalla Vecchia C., 2011, MNRAS, 415, 3649 19
2011
-
[85]
F., Faucher-Giguère C.-A., Feldmann R., Kereš D., Chan T
van de V oort F., Quataert E., Hopkins P. F., Faucher-Giguère C.-A., Feldmann R., Kereš D., Chan T. K., Hafen Z., 2016, Monthly Notices of the Royal Astronomical Society, 463, 4533
2016
Reviewed August 14, 2026 · model on record in the stance chip above.
Discussion (0). Continue with ORCID to comment.