REVIEW 4 major objections 5 minor 87 references
ALMA Lensing Cluster Survey: Dust mass measurements as a function of redshift, stellar-mass and star formation rate, from z=1 to z=5
T0 review · 4 major / 5 minor · reviewed 2026-08-12 · deepseek-v4-flash
Pith's one-line read By stacking 4,103 lensed galaxies, this analysis shows a steady decline in average dust mass with redshift from z=1 to z=5, a rise with stellar mass and star formation rate, and lower high-redshift dust masses than current models predict.
desk verdict Solid, transparent stacking analysis reaching new low-mass/low-SFR regimes; the low-z scaling relations are likely robust, but the high-z decline is conditional on an unquantified catalog-incompleteness bias. read the letter →
The pith
A machine-rendered reading of the paper's core claim, the machinery that carries it, and where it could break.
The reading
What carries the argument
The engine of the analysis is image-domain continuum stacking with the LineStacker tool: uv-tapered ALMA band-6 maps of 33 clusters are cut into 9.76-arcsecond stamps at catalog positions, averaged, and the central flux is integrated in a 2-arcsecond aperture, reaching stacked noise levels near $4\times10^{-3}$ mJy per beam. That flux is converted to dust mass with a single optically thin modified blackbody, $M_{\rm dust}=5.03\times10^{-31}(S_{\nu_{\rm obs}}/f_{\rm CMB})D_L^2 / [(1+z)^4 B_{\nu_{\rm obs}}(T_{\rm obs})\kappa_{\nu_0}(\nu_0/\nu_{\rm rest})^\beta]$, using $T_{\rm rest}=25$ K, $\beta=1.8$, and $\kappa_{\nu_0}=0.0431$ m$^2$ kg$^{-1}$ at 352.6 GHz, with lensing-magnification and CMB corrections. Uncertainties combine empty-stack RMS, bootstrap resampling, redshift scatter, and a 20% magnification error; non-detections are reported as $3\sigma$ upper limits.
What would settle it
Stack the same lensed sources in a second ALMA band, for example 3 mm, so that the same rest-frame Rayleigh-Jeans wavelength is probed at all redshifts; if the decline in derived dust mass persists, the central claim survives, while if the decline flattens or vanishes, the fixed-temperature SED conversion was responsible for part of it.
Extended reading notes
Core claim
On the paper's own terms, the discovery is that average galaxy dust mass declines steadily from $z=1$ to $z=5$ while rising with both stellar mass and star formation rate at fixed redshift. The authors fit scaling relations of the form $M_{\rm dust}(x)=a x^b$, finding for example $M_{\rm dust}\propto {\rm SFR}^{0.78\pm0.07}$ at $1\le z<2$ and $M_{\rm dust}\propto z^{-1.0\pm0.3}$ at fixed stellar mass $10^{10}$–$10^{11}\,M_\odot$. Stacked detections span roughly $3\times10^6$ to $2.6\times10^8\,M_\odot$, while the highest-redshift bins are mostly $3\sigma$ upper limits. Comparison with galaxy-formation models shows broad agreement at $z\sim1$–3 but predicted dust masses that are higher than observed at $z>3$.
Load-bearing premise
The load-bearing premise, discussed but not corrected in Section 5, is that the 1.2 mm continuum traces dust mass through a single optically thin 25 K blackbody at every redshift, so if the true mass-weighted dust temperature or emissivity evolves, part of the apparent redshift decline would be an artifact of that assumption.
Editorial extensions
If this is right
- Average dust mass drops by roughly an order of magnitude from $z\sim1$ to $z\sim5$, so dust accumulation in typical galaxies is a gradual process tied to cosmic time.
- At fixed redshift, dust mass increases with both stellar mass and star formation rate, with the SFR relation closer to linear, making star formation rate a useful dust-mass tracer.
- At $z>3$ the measured dust masses fall below the predictions of current galaxy-formation models, implying those models overproduce dust in early galaxies if the measurements hold.
- Excluding quiescent galaxies raises the average dust masses in stellar-mass-selected stacks, so quiescent galaxies carry less dust for their stellar mass and lower the population averages.
Reading between the lines
- I infer that the strongest systematic to test is the rest-wavelength shift: since the fixed 1.2 mm band probes about 0.5 mm at $z=1$ and about 0.2 mm at $z=5$, a true evolution of the mass-weighted dust temperature would change the high-redshift masses by roughly 50% and could flatten the reported decline.
- I infer that a multi-band stacking test, for example with ALMA band 3 near 3 mm, would sample the same rest-frame Rayleigh-Jeans tail at all redshifts and cleanly separate a real dust-mass decline from an SED assumption.
- I infer that if JWST-based source catalogs recover the dusty galaxies missed by the HST-IRAC selection, the high-redshift average dust masses are likely to move upward, shrinking the gap with model predictions.
Editorial analysis
A structured set of objections, weighed in public.
Referee Report
Summary. The paper uses ALMA Band 6 continuum imaging from the ALCS survey to stack approximately 4100 lensed galaxies from the Kokorev et al. (2022) HST/IRAC catalog, binning them in redshift, stellar mass, and star-formation rate. From the stacked 1.2 mm fluxes it derives average dust masses using Eq. (1), which assumes a single optically thin modified blackbody with a fixed 25 K mass-weighted dust temperature, and it reports a decline of average dust mass with redshift, positive scaling relations with stellar mass and SFR, and broad agreement with models at z ~ 1-3 but lower-than-predicted dust masses at higher redshift. The analysis includes mean and median stacking, bootstrap and RMS uncertainties, magnification corrections, and a comparison to semi-analytic models using both model dust masses and model-predicted band-6 fluxes.
Significance. If the reported trends are robust, this paper provides a valuable statistical census of dust in typical (not just individually bright) galaxies from z = 1 to z = 5, extending stacking measurements to lower stellar masses and SFRs than most previous work. The study's strengths include the use of a large, homogeneously observed lensed sample; explicit median-stack and bootstrap consistency checks, which support the qualitative trends; CMB correction following da Cunha et al. (2013); and a careful model comparison that distinguishes direct model dust masses from masses derived from predicted band-6 fluxes. The qualitative relations — dust increasing with stellar mass and SFR and decreasing with redshift — are plausible and likely to hold. However, the quantitative redshift decline and the claimed tension with models at high redshift rest on selection and SED assumptions that the paper acknowledges but does not correct, so the result is best regarded as conditional until those biases are bounded.
major comments (4)
- [Section 5 and Section 2.2] The sample is drawn from an HST/IRAC catalog that misses 35 of the 180 ALCS sources detected at SNR > 4, as the authors acknowledge in Section 5. Because the missing sources are preferentially the most dusty, and because the effect is expected to be strongest at high redshift, the stacked fluxes in several high-redshift bins (Tables 3 and 4, many of which are 3-sigma upper limits) are biased downward in exactly the direction of the headline result — the decline in average dust mass with redshift and the low values compared to models. The paper does not quantify or correct this incompleteness. The authors should attempt to bound this bias, for example by adding the 35 missing sources using their ALMA positions in the stacks, by reweighting the sample with a completeness model, or by presenting the maximum plausible correction; without this, the redshift trend and model comparison remain conditional.
- [Section 3.3, Eq. (1)] The dust mass conversion assumes a single optically thin modified blackbody with T_rest = 25 K and beta = 1.8 at all redshifts. Since the observed band is fixed, the rest-frame wavelength shifts from about 0.5 mm at z = 1 to about 0.2 mm at z = 5, so Eq. (1) progressively moves off the Rayleigh-Jeans tail and becomes sensitive to the assumed temperature and SED shape. The authors note the ~T^-1 dependence and quote a ~50% change at T = 40 K, but this does not bound the effect of a plausible mass-weighted temperature evolution: a change of ~10 K across the probed redshift range can alter high-z masses by factors comparable to the claimed decline, and the adopted temperature also sets the absolute values used for the model comparison. The paper should present the redshift trend under at least two plausible T(z) prescriptions (e.g., constant 25 K and a mild increase with redshift) to demonstrate that the qualitative decline is robust.
- [Section 4.1 and Table 5] The scaling relations are fitted using detections only, ignoring the 3-sigma upper limits, as stated in Section 4.1. At high redshift most points are upper limits, so the fitted slopes for Mdust(z) (e.g., b = -1.8 +/- 0.7 and -1.0 +/- 0.3 in Table 5) are likely biased by the detection threshold, which preferentially selects bright sources. A censored likelihood or survival analysis should be used, or the fits should be repeated with upper limits included to bound the effect. In addition, the fitted normalization for the Mdust-M* relation at z = 1-2 (a = 5.2 +/- 13.0 x 10^3 in Table 5) is effectively unconstrained, so the paper's claim of having derived a scaling relation with stellar mass is not supported by this fit; this should be stated explicitly.
- [Section 5 and Figure 3] The sample's stellar mass function shows an overdensity at z > 4 and an under-density at 2 < z < 3 relative to COSMOS2020 (Figure 3), which the authors attribute to photometric redshift misclassification of lower-redshift sources. As they note, this would overestimate dust content at z > 3, working in the opposite direction of the missing dusty galaxies. The net redshift trend therefore depends on two unquantified and competing biases. The authors should attempt to quantify the photo-z contamination, for example by propagating the redshift uncertainties into the stacked fluxes or by re-fitting with the z > 3 bins adjusted to the COSMOS2020 stellar mass function.
minor comments (5)
- [Section 6] The summary states that the sources were binned in 'five different redshift bins,' but Section 2.3 defines only four redshift bins (1<z<2, 2<z<3, 3<z<4, 4<z<5).
- [Section 1] The cosmology is quoted as 'H0 = 70 km s-1 Mpc-3'; the units should be km s-1 Mpc-1.
- [Section 2.2] In the selection criteria, 'not tagged with bad photometry (bad_phot , 1)' is ambiguous; it should read 'bad_phot = 0' or 'bad_phot != 1'.
- [Section 1] The introduction promises that the paper will 'integrate the contribution from all galaxies in each redshift bin to assess the evolution of the cosmic dust density,' but no cosmic dust density measurement or figure is presented in the results or summary; this promise should either be fulfilled or removed.
- [Section 3.4] The footnote that the stack RMS and bootstrap uncertainties are correlated and added quadratically (overestimating the error) is useful, but the overestimate should be stated in the main text or the method should be changed to use only one of the two terms.
Circularity Check
No significant circularity: dust masses are measured from stacked 1.2 mm fluxes through a fixed, externally calibrated SED conversion, and the scaling relations and high-redshift model tension are empirical outputs rather than inputs restated by construction.
full rationale
The derivation chain is self-contained at the level required to avoid circularity. Dust masses are computed from measured stacked 1.2 mm fluxes via Eq. 1, a single optically thin modified blackbody with literature-adopted parameters (T_rest = 25 K, beta = 1.8, kappa_nu0 = 0.0431 m2/kg from Li & Draine 2001, Magnelli et al. 2020, Planck Collaboration 2011), corrected for CMB following da Cunha et al. (2013) and for the average lensing magnification. None of these inputs contains the target result: the scaling relations in Table 5 are fits to the resulting dust masses ("By fitting quadratic functions to the data ... we derive scaling relations"), not quantities used to generate the masses, so the empirical claim (dust mass declining with redshift, rising with stellar mass and SFR) is independent. Bins with four detections across z (e.g., the 10^10 < M* < 10^11 bin in Table 3) show the decline from measured fluxes, giving the headline trend non-tautological content. The self-cited items are tools, data, or companion works, not load-bearing premises: LineStacker (Jolly et al. 2020) is public code that performs aperture-mean stacking and bootstrapping; the Kokorev et al. (2022) HST-IRAC catalog supplies positions, photometric redshifts, SFRs, and stellar masses from optical-to-IRAC photometry independent of the ALMA 1.2 mm data, and is externally validated (spectroscopic redshifts for ~7000 galaxies; SMF comparison against COSMOS2020 in Figure 3); the Kohno et al. (2023) survey paper documents the ALMA data. The model comparison is an external benchmark, and the paper itself flags the SHARK dust-mass methodology difference (footnote 2: dust masses estimated from an empirical z = 0 dust-to-gas-metallicity relation) and shows both SHARK's direct Mdust and its S6-derived Mdust. The acknowledged limitations asserted in the text (Section 5 and the appendix) are systematic or selection effects, not circular steps: the fixed 25 K mass-weighted temperature ("dust masses go as T^-1 ... could be off by factors of a few if the assumed dust temperature is not correct"), the rest-wavelength shift toward the dust SED peak at high z ("the higher the redshift observed the closer one gets to the peak of dust emission"), the incompleteness of the HST/IRAC selection (35 of 180 ALCS SNR>4 sources absent from the catalog, "This bias could be strongest in the high-redshift bins"), and photometric-redshift contamination at z > 3.
Assumptions & free parameters
free parameters (3)
- Dust temperature T_rest =
25 K (assumed constant)
- Dust emissivity index beta =
1.8
- Dust opacity kappa_nu0 =
0.0431 m2/kg at 352.6 GHz
assumptions (5)
- domain assumption Dust emission at 1.2 mm is optically thin and traces dust mass
- domain assumption A single modified blackbody with T=25 K describes the dust SED at all redshifts probed
- domain assumption Photometric redshifts and magnifications from Kokorev et al. 2022 are sufficiently accurate for binning
- domain assumption The 1.2 mm continuum flux is dominated by dust emission rather than other mechanisms
- domain assumption CMB heating and background corrections of da Cunha et al. 2013 apply
Cite this review
Pith. "Pith review of ALMA Lensing Cluster Survey: Dust mass measurements as a function of redshift, stellar-mass and star formation rate, from z=1 to z=5." pith.science (2026). https://pith.science/paper/GLKG6WDC
@misc{pith2026241111212,
  author       = {Pith},
  title        = {Pith review of: ALMA Lensing Cluster Survey: Dust mass measurements as a function of redshift, stellar-mass and star formation rate, from z=1 to z=5},
  year         = {2026},
  howpublished = {\url{https://pith.science/paper/GLKG6WDC}},
  note         = {Machine review of arXiv:2411.11212}
}
abstract
Understanding the dust content of galaxies, its evolution with redshift and its relationship to stars and star formation is fundamental for our understanding of galaxy evolution. Using the ALMA Lensing Cluster Survey (ALCS) wide-area band-6 continuum dataset ($\sim\,$110 arcmin$^2$ across 33 lensing clusters), we aimed at constraining the dust mass evolution with redshift, stellar mass and star formation rate (SFR). After binning sources according to redshift, SFR and stellar mass -- extracted from an HST-IRAC catalog -- we performed a set of continuum stacking analyses in the image domain using \textsc{LineStacker} on sources between $z=1$ and $z=5$, further improving the depth of our data. The large field of view provided by the ALCS allows us to reach a final sample of $\sim4000$ galaxies with known coordinates and SED-derived physical parameters. We stack sources with SFR between $10^{-3}$ and $10^{3}$ M$_\odot$ per year, and stellar mass between $10^{8}$ and $10^{12}$ M$_\odot$, splitting them in different stellar mass and SFR bins. Through stacking we retrieve the continuum 1.2\,mm flux, a known dust mass tracer, allowing us to derive the dust mass evolution with redshift and its relation with SFR and stellar mass. We observe clear continuum detections in the majority of the subsamples. From the non detections we derive 3-$\sigma$ upper limits. We observe a steady decline in the average dust mass with redshift. Moreover, sources with higher stellar mass or SFR have higher dust mass on average, allowing us to derive scaling relations. Our results are mostly in good agreement with models at $z\sim1$-3, but indicate typically lower dust-mass than predicted at higher redshift.
Figures

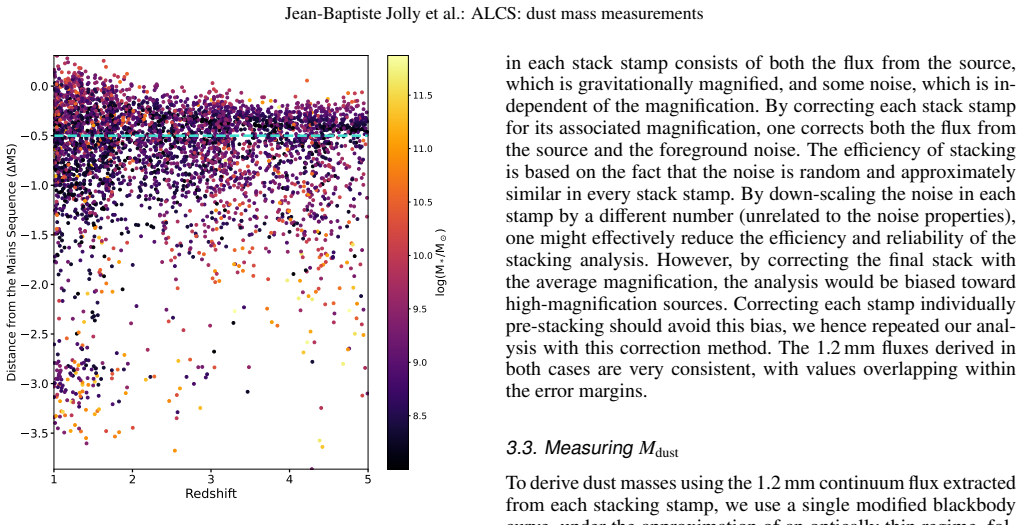

Figures from the paper (7 more)


Reference graph
Works this paper leans on
-
[1]
, " * write output.state after.block = add.period write newline
ENTRY address archiveprefix author booktitle chapter edition editor howpublished institution eprint journal key month note number organization pages publisher school series title type volume year label extra.label sort.label short.list INTEGERS output.state before.all mid.sentence after.sentence after.block FUNCTION init.state.consts #0 'before.all := #1 ...
-
[2]
write newline
" write newline "" before.all 'output.state := FUNCTION n.dashify 't := "" t empty not t #1 #1 substring "-" = t #1 #2 substring "--" = not "--" * t #2 global.max substring 't := t #1 #1 substring "-" = "-" * t #2 global.max substring 't := while if t #1 #1 substring * t #2 global.max substring 't := if while FUNCTION word.in bbl.in " " * FUNCTION format....
-
[3]
2020, , 901, 79
Aravena , M., Boogaard , L., G \'o nzalez-L \'o pez , J., et al. 2020, , 901, 79
2020
-
[4]
L., Cox , P., et al
Bertoldi , F., Carilli , C. L., Cox , P., et al. 2003, , 406, L55
2003
-
[5]
2015, , 573, A113
B \'e thermin , M., Daddi , E., Magdis , G., et al. 2015, , 573, A113
2015
-
[6]
2020, , 643, A2
B \'e thermin , M., Fudamoto , Y., Ginolfi , M., et al. 2020, , 643, A2
2020
-
[7]
E., Weiss , A., Wardlow , J
Birkin , J. E., Weiss , A., Wardlow , J. L., et al. 2021, , 501, 3926
2021
-
[8]
Bouwens , R., Gonz \'a lez-L \'o pez , J., Aravena , M., et al. 2020, , 902, 112
work page 2020
Show all 87 references
-
[9]
Casey , C. M. 2012, , 425, 3094
2012
-
[10]
M., Narayanan, D., & Cooray, A
Casey, C. M., Narayanan, D., & Cooray, A. 2014, Physics Reports, 541, 45–161
2014
-
[11]
L., Pope , A., Scott , D., et al
Chapin , E. L., Pope , A., Scott , D., et al. 2009, , 398, 1793
2009
-
[12]
2019, , 884, 85
Coe , D., Salmon , B., Brada c , M., et al. 2019, , 884, 85
2019
-
[13]
2018, , 26, 5
Combes , F. 2018, , 26, 5
2018
-
[14]
2010, , 403, 1894
da Cunha , E., Eminian , C., Charlot , S., & Blaizot , J. 2010, , 403, 1894
2010
-
[15]
2013, , 766, 13
da Cunha , E., Groves , B., Walter , F., et al. 2013, , 766, 13
2013
-
[16]
R., et al
da Cunha , E., Walter , F., Smail , I. R., et al. 2015, , 806, 110
2015
-
[17]
Draine , B. T. 2011, Physics of the Interstellar and Intergalactic Medium
2011
-
[18]
T., Dale , D
Draine , B. T., Dale , D. A., Bendo , G., et al. 2007, , 663, 866
2007
-
[19]
P., Andrews , S
Driver , S. P., Andrews , S. K., da Cunha , E., et al. 2018, , 475, 2891
2018
-
[20]
e , U., Smail , I., Swinbank , A
Dudzevi c i \= u t \. e , U., Smail , I., Swinbank , A. M., et al. 2021, , 500, 942
2021
-
[21]
e , U., Smail , I., Swinbank , A
Dudzevi c i \= u t \. e , U., Smail , I., Swinbank , A. M., et al. 2020, , 494, 3828
2020
-
[22]
W., Rieke , G
Engelbracht , C. W., Rieke , G. H., Gordon , K. D., et al. 2008, , 678, 804
2008
-
[23]
L., Fudamoto , Y., Oesch , P
Faisst , A. L., Fudamoto , Y., Oesch , P. A., et al. 2020, , 498, 4192
2020
-
[24]
2017, , 471, 5018
Ferrara , A., Hirashita , H., Ouchi , M., & Fujimoto , S. 2017, , 471, 5018
2017
-
[25]
2023, arXiv e-prints, arXiv:2303.01658
Fujimoto , S., Kohno , K., Ouchi , M., et al. 2023, arXiv e-prints, arXiv:2303.01658
2023 arXiv
-
[26]
C., Galliano , F., et al
Galametz , M., Madden , S. C., Galliano , F., et al. 2011, , 532, A56
2011
-
[27]
Galliano, F., Galametz, M., & Jones, A. P. 2018, Annual Review of Astronomy and Astrophysics, 56, 673
2018
-
[28]
E., Romero-Ca \ n izales , C., et al
Gonz \'a lez-L \'o pez , J., Bauer , F. E., Romero-Ca \ n izales , C., et al. 2017, , 597, A41
2017
-
[29]
2020, , 897, 91
Gonz \'a lez-L \'o pez , J., Novak , M., Decarli , R., et al. 2020, , 897, 91
2020
-
[30]
2023, , 526, 2423
Guerrero , A., Nagar , N., Kohno , K., et al. 2023, , 526, 2423
2023
-
[31]
Hodge , J. A. & da Cunha , E. 2020, Royal Society Open Science, 7, 200556
2020
-
[32]
2005, , 434, 849
Hunt , L., Bianchi , S., & Maiolino , R. 2005, , 434, 849
2005
-
[33]
K., & Stanley , F
Jolly , J.-B., Knudsen , K. K., & Stanley , F. 2020, , 499, 3992
2020
-
[34]
2017, , 843, 71
Kirkpatrick , A., Pope , A., Sajina , A., et al. 2017, , 843, 71
2017
-
[35]
K., Richard , J., Kneib , J.-P., et al
Knudsen , K. K., Richard , J., Kneib , J.-P., et al. 2016, , 462, L6
2016
-
[36]
2023, arXiv e-prints, arXiv:2305.15126
Kohno , K., Fujimoto , S., Tsujita , A., et al. 2023, arXiv e-prints, arXiv:2305.15126
2023 arXiv
-
[37]
2022, arXiv e-prints, arXiv:2207.07125
Kokorev , V., Brammer , G., Fujimoto , S., et al. 2022, arXiv e-prints, arXiv:2207.07125
2022 arXiv
-
[38]
2010, , 717, 29
Kov \'a cs , A., Omont , A., Beelen , A., et al. 2010, , 717, 29
2010
-
[39]
Köhler, M., Ysard, N., & Jones, A. P. 2015, Astronomy and Astrophysics, 579, A15
2015
-
[40]
Lagos , C. d. P., Robotham , A. S. G., Trayford , J. W., et al. 2019, , 489, 4196
2019
-
[41]
S., Boone , F., et al
Laporte , N., Ellis , R. S., Boone , F., et al. 2017, , 837, L21
2017
-
[42]
& Draine , B
Li , A. & Draine , B. T. 2001, , 554, 778
2001
-
[43]
2019, , 490, 1425
Li , Q., Narayanan , D., & Dav \'e , R. 2019, , 490, 1425
2019
-
[44]
2019, , 489, 1397
Liang , L., Feldmann , R., Kere s , D., et al. 2019, , 489, 1397
2019
-
[45]
M., Koekemoer , A., Coe , D., et al
Lotz , J. M., Koekemoer , A., Coe , D., et al. 2017, , 837, 97
2017
-
[46]
C., Casey , C
Ma , X., Hayward , C. C., Casey , C. M., et al. 2019, , 487, 1844
2019
-
[47]
E., Daddi , E., B \'e thermin , M., et al
Magdis , G. E., Daddi , E., B \'e thermin , M., et al. 2012, , 760, 6
2012
-
[48]
2020, , 892, 66
Magnelli , B., Boogaard , L., Decarli , R., et al. 2020, , 892, 66
2020
-
[49]
2014, , 561, A86
Magnelli , B., Lutz , D., Saintonge , A., et al. 2014, , 561, A86
2014
-
[50]
2012, , 539, A155
Magnelli , B., Lutz , D., Santini , P., et al. 2012, , 539, A155
2012
-
[51]
2011, , 535, A13
Magrini , L., Bianchi , S., Corbelli , E., et al. 2011, , 535, A13
2011
-
[52]
P., Waters , B., Schiebel , D., Young , W., & Golap , K
McMullin , J. P., Waters , B., Schiebel , D., Young , W., & Golap , K. 2007, in Astronomical Society of the Pacific Conference Series, Vol. 376, Astronomical Data Analysis Software and Systems XVI, ed. R. A. Shaw , F. Hill , & D. J. Bell , 127
2007
-
[53]
D., et al
Narayanan , D., Dav \'e , R., Johnson , B. D., et al. 2018, , 474, 1718
2018
-
[54]
M., Elbaz , D., et al
Orellana , G., Nagar , N. M., Elbaz , D., et al. 2017, , 602, A68
2017
-
[55]
Planck Collaboration , Abergel , A., Ade , P. A. R., et al. 2011, , 536, A21
2011
-
[56]
& P \'e roux , C
Popping , G. & P \'e roux , C. 2022, , 513, 1531
2022
-
[57]
L., et al
Popping , G., Shivaei , I., Sanders , R. L., et al. 2023, , 670, A138
2023
-
[58]
S., & Galametz , M
Popping , G., Somerville , R. S., & Galametz , M. 2017, , 471, 3152
2017
-
[59]
2012, , 199, 25
Postman , M., Coe , D., Ben \' tez , N., et al. 2012, , 199, 25
2012
-
[60]
2021, arXiv e-prints, arXiv:2105.14789
Pozzi , F., Calura , F., Fudamoto , Y., et al. 2021, arXiv e-prints, arXiv:2105.14789
2021
-
[61]
2020, , 491, 5073
Pozzi , F., Calura , F., Zamorani , G., et al. 2020, , 491, 5073
2020
-
[62]
C., Galliano , F., et al
R \'e my-Ruyer , A., Madden , S. C., Galliano , F., et al. 2014, , 563, A31
2014
-
[63]
2013, , 778, 2
Saintonge , A., Lutz , D., Genzel , R., et al. 2013, , 778, 2
2013
-
[64]
2014, , 562, A30
Santini , P., Maiolino , R., Magnelli , B., et al. 2014, , 562, A30
2014
-
[65]
2018, , 618, A85
Schreiber , C., Glazebrook , K., Nanayakkara , T., et al. 2018, , 618, A85
2018
-
[66]
2014, , 783, 84
Scoville , N., Aussel , H., Sheth , K., et al. 2014, , 783, 84
2014
-
[67]
2017, , 837, 150
Scoville , N., Lee , N., Vanden Bout , P., et al. 2017, , 837, 150
2017
-
[68]
2016, , 820, 83
Scoville , N., Sheth , K., Aussel , H., et al. 2016, , 820, 83
2016
-
[69]
Scoville , N. Z. 2013, Evolution of star formation and gas , ed. J. Falc \'o n-Barroso & J. H. Knapen , 491
2013
-
[70]
E., Cullen , F., Dunlop , J
Shapley , A. E., Cullen , F., Dunlop , J. S., et al. 2020, , 903, L16
2020
-
[71]
2022, , 928, 68
Shivaei , I., Popping , G., Rieke , G., et al. 2022, , 928, 68
2022
-
[72]
2020, , 497, 956
Sommovigo , L., Ferrara , A., Pallottini , A., et al. 2020, , 497, 956
2020
-
[73]
S., Steinhardt , C
Speagle , J. S., Steinhardt , C. L., Capak , P. L., & Silverman , J. D. 2014, , 214, 15
2014
-
[74]
2022, , 932, 77
Sun , F., Egami , E., Fujimoto , S., et al. 2022, , 932, 77
2022
-
[75]
J., Genzel , R., & Sternberg , A
Tacconi , L. J., Genzel , R., & Sternberg , A. 2020, , 58, 157
2020
-
[76]
Bakx , T
Tamura , Y., C. Bakx , T. J. L., Inoue , A. K., et al. 2023, , 952, 9
2023
-
[77]
2019, , 874, 27
Tamura , Y., Mawatari , K., Hashimoto , T., et al. 2019, , 874, 27
2019
-
[78]
P., Sinha , M., Croton , D
Triani , D. P., Sinha , M., Croton , D. J., Pacifici , C., & Dwek , E. 2020, , 493, 2490
2020
-
[79]
Valiante , R., Schneider , R., Bianchi , S., & Andersen , A. C. 2009, , 397, 1661
2009
-
[80]
P., McMahon , R
Venemans , B. P., McMahon , R. G., Walter , F., et al. 2012, , 751, L25
2012
-
[81]
P., Clay , S
Vijayan , A. P., Clay , S. J., Thomas , P. A., et al. 2019, , 489, 4072
2019
-
[82]
2017, Molecular Astrophysics, 9, 1
Wakelam , V., Bron , E., Cazaux , S., et al. 2017, Molecular Astrophysics, 9, 1
2017
-
[83]
2016, , 833, 67
Walter , F., Decarli , R., Aravena , M., et al. 2016, , 833, 67
2016
-
[84]
K., et al
Watson , D., Christensen , L., Knudsen , K. K., et al. 2015, , 519, 327
2015
-
[85]
R., Davidzon , I., Toft , S., et al
Weaver , J. R., Davidzon , I., Toft , S., et al. 2022 a , arXiv e-prints, arXiv:2212.02512
2022 arXiv
-
[86]
R., Kauffmann , O
Weaver , J. R., Kauffmann , O. B., Ilbert , O., et al. 2022 b , , 258, 11
2022
-
[87]
A., Casey , C
Zavala , J. A., Casey , C. M., Manning , S. M., et al. 2021, , 909, 165
2021
Reviewed August 12, 2026 · model on record in the stance chip above.
Discussion (0). Continue with ORCID to comment.