REVIEW 3 major objections 4 minor 113 references
ZTF SN Ia DR2: An environmental study of Type Ia supernovae using host galaxy image decomposition
T0 review · 3 major / 4 minor · reviewed 2026-08-12 · deepseek-v4-flash
Pith's one-line read 16.8-sigma link ties supernova stretch to host galaxy colour
desk verdict A real step forward in SN Ia environmental tracers, with headline significances that are probably inflated until the heavy sample selection is accounted for. read the letter →
The pith
A machine-rendered reading of the paper's core claim, the machinery that carries it, and where it could break.
The reading
What carries the argument
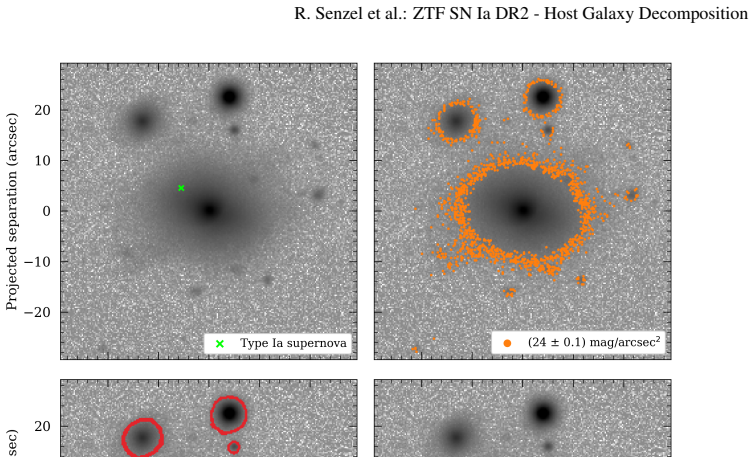
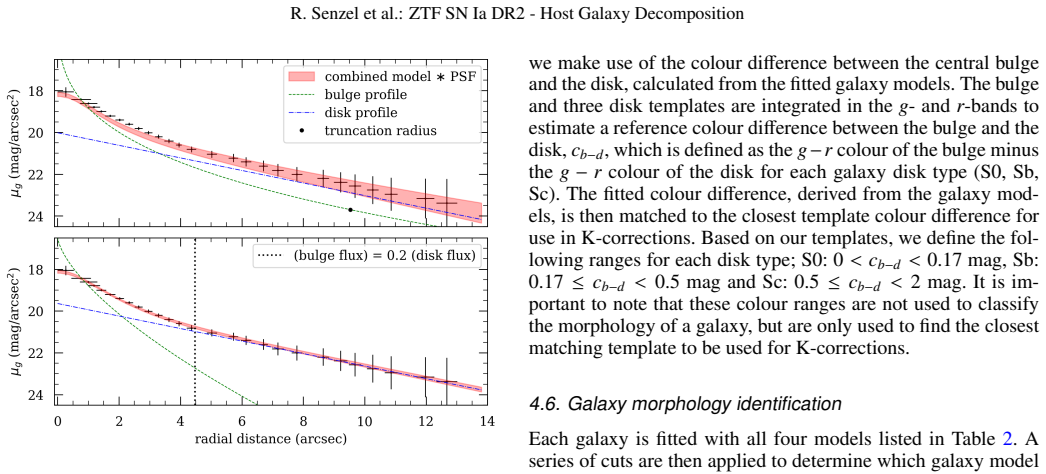
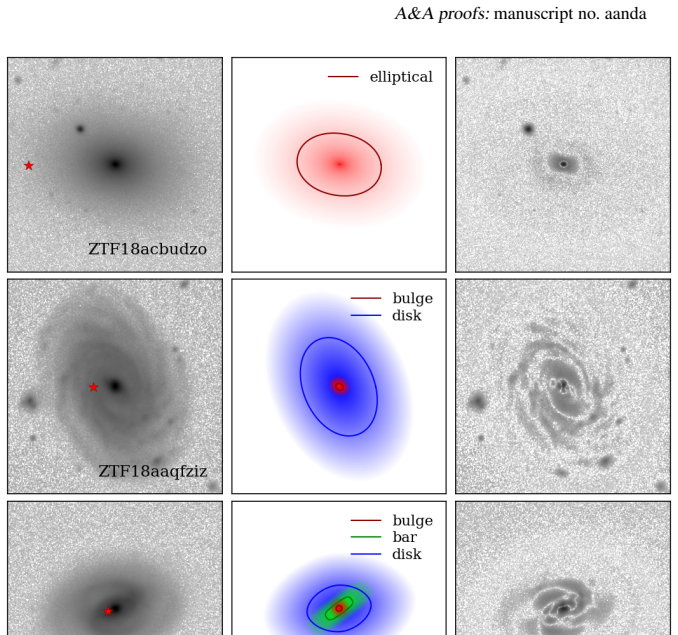
The load-bearing object is the 'SN-component-colour': the intrinsic $g-r$ colour of the galaxy model component (elliptical, bulge/bar, or disk) that hosts the supernova, obtained from a custom fully automated two-dimensional decomposition of DESI-LS $g$- and $r$-band images. The code fits S\'ersic profiles for ellipticals, bulges, and bars plus an exponential disk, with PSF convolution, superellipse isophotes, K-corrections, and morphological selection assisted by external deep-learning morphology classifications, then assigns each SN to a component by the flux ratio at its position. Because the galaxy shape is common to both bands, each component has a single colour; this average component colour is argued to track the birth environment of the progenitor better than the local pixel colour or host stellar mass. The machinery's key output is that this colour, and in disks the local $r$-band surface brightness, predicts SALT2 $x_1$ at high significance, with host stellar mass as a weaker tracer.
What would settle it
Reconstruct the ZTF DR2 selection by simulating the full pipeline from host images to final galaxy model for SNe Ia injected with known $x_1$ values, and check whether the recovered $x_1$-colour slopes in ellipticals and disks survive; a cheaper version is to re-weight the 728-event sample using the $x_1$-dependent entry rate in Fig. 8 together with the redshift and mass success rates in Fig. 7, and see whether the $16.8\sigma$ and $5.1\sigma$ slopes remain.
Extended reading notes
Core claim
The central discovery is that SN Ia light-curve stretch correlates separately, and significantly, with the intrinsic colour of the specific galaxy component that hosts the explosion. For normal SNe Ia in ellipticals the relation between SN-component-colour and SALT2 stretch has a significance of $16.8\sigma$ (Pearson $r=-0.61$, $R^2=0.37$); for SNe Ia in disks the relation is $5.1\sigma$ ($r=-0.39$, $R^2=0.15$), with a steeper slope that is driven mainly by red 'Green Valley' disks. The authors interpret redder components as older and/or more metal-rich stellar populations, so lower stretch is an age and metallicity effect. They also report a $6.1\sigma$ correlation between $x_1$ and local $r$-band surface brightness in disk hosts, a possible $3.3\sigma$ dust-related trend between SN colour $c$ and surface brightness for $c>0.035$, and a $3.5\sigma$ offset whereby 91bg-like SNe Ia live in redder ellipticals than normal SNe Ia at fixed host mass. The intersection of the elliptical and disk stretch relations gives a low/high-stretch crossover of $x_1=-0.39\pm0.06$, consistent with companion ZTF papers.
Load-bearing premise
The analysis assumes that the heavy selection from 3628 SNe Ia down to 728 modelled hosts does not bias the relative $x_1$-environment correlations; no simulation, weighting, or selection correction is presented, and Fig. 8 shows an $x_1$-dependent retention with an excess of low-stretch events.
Editorial extensions
If this is right
- If stretch is set by progenitor age and metallicity, environmental corrections for SN Ia cosmology should use component-level galaxy colour or local surface brightness rather than global host mass alone.
- The elliptical-only $16.8\sigma$ relation suggests that, under a double-degenerate progenitor picture, normal SNe Ia in ellipticals may come from a single progenitor channel whose properties are set by stellar age.
- Bulge and bar SNe Ia share the low-stretch, red-colour behaviour of ellipticals, so mixing them with disk SNe Ia dilutes environmental correlations.
- The $x_1=-0.39\pm0.06$ crossover between the elliptical and disk trends co-locates with the broken-\alpha stretch split seen in companion ZTF analyses, supporting two distinct stretch regimes.
- Intrinsic SN colour $c$ is mostly environment-independent, with red $c>0.035$ SNe Ia in disk hosts plausibly tracing dust toward galaxy centres.
Reading between the lines
- The heavy selection from 3628 to 728 hosts could amplify the reported slopes; a weighting or simulation built from the paper's own x1-dependent entry rate would test whether the $16.8\sigma$ and $5.1\sigma$ significances survive.
- The SN-component-colour definition invites a direct follow-up: compare the same 728 hosts against integral-field-unit spectroscopic age and metallicity maps to separate the age and metallicity contributions that the paper cannot disentangle.
- The same automated pipeline, applied to larger samples from next-generation wide-field surveys, could turn $x_1$ into a cheap environmental age indicator for SNe Ia, provided the selection function is modelled forward.
- The dust interpretation for $c>0.035$ could be tested by matching reddened disk SNe Ia to spatially resolved extinction maps and checking that their line of sight through the disk is longer than that of blue SNe Ia at the same surface brightness.
Editorial analysis
A structured set of objections, weighed in public.
Referee Report
Summary. The paper uses 2D image decomposition of DESI-LS images to model 728 host galaxies of SNe Ia from ZTF DR2, separating elliptical, disk, bulge/bar, and halo environments. The central results are linear correlations between SALT2 stretch x1 and the model-derived galaxy component colour: a 16.8σ relation for SNe Ia in ellipticals and a 5.1σ relation for SNe Ia in disks, with lower-stretch SNe Ia in redder environments, plus a 6.1σ trend between x1 and local r-band surface brightness in disk hosts. The authors interpret these as age/metallicity effects and argue that the slopes differ fundamentally between old and young stellar environments. They also report a 3.3σ possible dust effect in SALT2 c versus local surface brightness for disk SNe, based on a c>0.035 split, and confirm that 91bg-like SNe reside in the reddest old environments.
Significance. If the correlations are genuine, this is an important step in connecting SN Ia light-curve stretch to progenitor stellar populations, with implications for SN Ia standardisation and progenitor models. The paper benefits from a large homogeneous sample, an automated decomposition pipeline with public code, and a 90–92% morphological agreement with Galaxy Zoo classifications for a subset. The environmental variables are derived from independent galaxy image models rather than from the SN light curves, so the headline correlations are not circular by construction. The main significance risk is the heavy, x1-dependent selection into the final 728-galaxy sample, which is acknowledged but not corrected or bounded; this threatens the quantitative claims (16.8σ, 5.1σ) and the comparison between elliptical and disk slopes.
major comments (3)
- [§5.1, Fig. 8] The final sample retains only 728 of 3628 SNe Ia (20%), and Fig. 8 demonstrates that selection into the final sample is x1-dependent: negative-x1 SNe are over-represented and positive-x1 SNe are under-represented. Fig. 7 further shows that fit success varies with redshift and host stellar mass. Because redder, more massive ellipticals and brighter disks are easier to fit, the selection probability is likely correlated jointly with x1 and the environmental tracer used in the headline regressions. The statement in §5.1 that trends can still be investigated because they do not depend on absolute or relative rates is not sufficient: a regression slope within a subpopulation is biased when selection depends on both x1 and the tracer. Please provide a selection simulation, inverse-probability weighting, or a bounded-bias estimate demonstrating that the 16.8σ and 5.1σ slopes and their significances survive.
- [§5.2, Table 5] The final morphological mix is heavily biased, with 51% ellipticals versus the expected ~37% based on Li et al. (2011) and Kelvin et al. (2014). The abstract and §5.1 state that the results are 'robust,' but no quantitative sensitivity test is given for how this over-representation affects the elliptical versus disk comparison. A reweighting of the sample to the expected morphological mix, or a repeat of the regressions on the Galaxy Zoo-confirmed subset (92%/90% agreement, §4.7), would strengthen the claim that the observed differences are physical rather than an artefact of which galaxies are fit successfully.
- [§5.3, Fig. 10] The paper claims in the abstract and §6.2 that the elliptical and disk colour–x1 relations 'correlate fundamentally differently,' and §5.3 describes the disk slope as 'much steeper' than the elliptical one, but no formal test of slope difference is reported. Because the two slopes are estimated on different subpopulations with different selection functions and systematics, a quantitative comparison (e.g., a bootstrap or a likelihood-ratio test on a combined fit) is needed before the 'fundamentally different' conclusion can be assessed.
minor comments (4)
- [§5.2] The removal of nine host galaxies after manual inspection (reducing the sample from 728 to 719) is described without a quantitative outlier criterion; please state the threshold or procedure used and show the main regressions with and without these objects.
- [§5.4, Fig. 12] The 3.3σ dust trend is based on splitting the sample at c=0.035, a choice the text itself calls arbitrary, and the trend is identified after a visual separation of the innermost SNe. This is a post-hoc analysis; please present it with an explicit multiple-testing caveat or a sensitivity scan over the split value.
- [§4.6] The text says 'Using Sterling's approximation' in §4.1; this should be 'Stirling's approximation.' There are also several typographical spacing issues (e.g., 'di fferent') throughout the manuscript.
- [§5.2] The statement 'No apparent bias is seen in the SALT2 c distribution' is qualitative; a two-sample test (e.g., KS or Anderson-Darling) between the full sample and the final sample would be a more robust way to support that claim.
Circularity Check
No significant circularity: host-environment colours and SALT2 x1 come from independent data streams, and the selection-function concern is a potential bias, not a circular reduction.
full rationale
The central correlations are between SALT2 x1 (from ZTF light-curve fits) and model-derived host-galaxy colours and surface brightness (from DESI-LS images fitted with Sérsic models). These come from independent data streams: the SALT2 fit supplies x1 and c; the galaxy decomposition supplies colour and surface brightness. Nothing in the galaxy-fitting procedure uses x1 or c, and nothing in the SALT2 fit uses the galaxy model parameters. The 16.8σ, 5.1σ, and 6.1σ trends are empirical regressions, not fitted parameters renamed as predictions. The K-correction template choice in Section 4.5 uses the fitted bulge-disk colour difference to pick an S0/Sb/Sc template, so there is a mild self-referential coupling between the pre-correction and final colours, but this does not reduce the x1-colour correlation to an input: x1 is external to the galaxy model, and the template choice is a correction step, not an identity. Component assignment in Section 4.8 uses a 20% flux threshold and could misclassify some SNe, but membership is not determined by x1. The strongest concern in the paper is the selection function (Section 5.1, Fig. 8): only 728 of 3628 hosts are modelled, with an excess of low-x1 SNe Ia and no completeness correction presented. That is a genuine systematic risk to the reported significances, but it is not circularity: it is a possible bias, not an identity or a fitted parameter renamed as a prediction. The c = 0.035 split in Section 5.4 is explicitly arbitrary, which weakens the dust claim but does not make it circular. No load-bearing self-citation or imported uniqueness theorem is used; the Galaxy Zoo comparison provides an external morphological benchmark. Verdict: no significant circularity.
Assumptions & free parameters
free parameters (4)
- SALT2 c split for dust trend =
0.035 mag
- Morphological colour cuts =
0.5 (elliptical lower), 0.6 (disk upper), 0-2 overall
- Bulge/bar flux threshold =
20 percent of disk flux
- Outlier removal threshold for SN-component-colour =
not quantified
assumptions (4)
- domain assumption Galaxy surface brightness can be described by the four Sersic and exponential models with superellipse isophotes
- domain assumption Galaxy geometry, meaning shape and Sersic index, is identical in g and r bands; only brightness varies
- domain assumption The atmospheric PSF is a circular Moffat profile with beta=4.765
- domain assumption K-correction templates (Superfit elliptical, S0, Sb, Sc, and Kinney bulge) are representative of the host populations
Cite this review
Pith. "Pith review of ZTF SN Ia DR2: An environmental study of Type Ia supernovae using host galaxy image decomposition." pith.science (2026). https://pith.science/paper/VH2L5ILG
@misc{pith2026241111986,
  author       = {Pith},
  title        = {Pith review of: ZTF SN Ia DR2: An environmental study of Type Ia supernovae using host galaxy image decomposition},
  year         = {2026},
  howpublished = {\url{https://pith.science/paper/VH2L5ILG}},
  note         = {Machine review of arXiv:2411.11986}
}
abstract
The second data release of Type Ia supernovae (SNe Ia) observed by the Zwicky Transient Facility has provided a homogeneous sample of 3628 SNe Ia with photometric and spectral information. This unprecedented sample size enables us to better explore our currently tentative understanding of the dependence of host environment on SN Ia properties. In this paper, we make use of two-dimensional image decomposition to model the host galaxies of SNe Ia. We model elliptical galaxies as well as disk/spiral galaxies with or without central bulges and bars. This allows for the categorisation of SN Ia based on their morphological host environment, as well as the extraction of intrinsic galaxy properties corrected for both cosmological and atmospheric effects. We find that although this image decomposition technique leads to a significant bias towards elliptical galaxies in our final sample of galaxies, the overall results are robust. By successfully modelling 728 host galaxies, we find that the photometric properties of SNe Ia found in disks and in elliptical galaxies, correlate fundamentally differently with their host environment. We identified strong linear relations between light-curve stretch and our model-derived galaxy colour for both the elliptical (16.8$\sigma$) and disk (5.1$\sigma$) subpopulations of SNe Ia. Lower stretch SNe Ia are found in redder environments, which we identify as an age/metallicity effect. Within the subpopulation of SNe Ia found in disk containing galaxies, we find a significant linear trend (6.1$\sigma$) between light-curve stretch and model-derived local $r$-band surface brightness, which we link to the age/metallicity gradients found in disk galaxies. SN Ia colour shows little correlation with host environment as seen in the literature. We identify a possible dust effect in our model-derived surface brightness (3.3$\sigma$), for SNe Ia in disk galaxies.
Figures


Figures from the paper (9 more)



Reference graph
Works this paper leans on
-
[1]
Abbott, T. M. C., Acevedo, M., Aguena, M., et al. 2024, ApJ, 973, L14
2024
-
[2]
2020, A&A, 641, A6
Aghanim, N., Akrami, Y ., Ashdown, M., et al. 2020, A&A, 641, A6
2020
-
[3]
D., Driver, S
Allen, P. D., Driver, S. P., Graham, A. W., et al. 2006, MNRAS, 371, 2 Astropy Collaboration, Price-Whelan, A. M., Lim, P. L., et al. 2022, ApJ, 935, 167
2006
-
[4]
1990, MNRAS, 245, 130
Athanassoula, E., Morin, S., Wozniak, H., et al. 1990, MNRAS, 245, 130
1990
-
[5]
2019, MNRAS, 490, 718
Barkhudaryan, L., Hakobyan, A., Karapetyan, A., et al. 2019, MNRAS, 490, 718
2019
-
[6]
Barkhudaryan, L. V . 2023, MNRAS, 520, L21
2023
-
[7]
C., Kulkarni, S
Bellm, E. C., Kulkarni, S. R., Barlow, T., et al. 2019, PASP, 131, 068003
2019
-
[8]
Benson, A. J. 2010, Phys. Rep., 495, 33
2010
Show all 113 references
-
[9]
2014, A&A, 568, A22
Betoule, M., Kessler, R., Guy, J., et al. 2014, A&A, 568, A22
2014
-
[10]
& Tonry, J
Blondin, S. & Tonry, J. L. 2007, ApJ, 666, 1024
2007
-
[11]
Boggs, P. T. & Rogers, J. E. 1990, Contemporary mathematics, 112, 183
1990
-
[12]
2022, A&A, 657, A22
Briday, M., Rigault, M., Graziani, R., et al. 2022, A&A, 657, A22
2022
-
[13]
& Scolnic, D
Brout, D. & Scolnic, D. 2021, ApJ, 909, 26
2021
-
[14]
2019, ApJ, 874, 150
Brout, D., Scolnic, D., Kessler, R., et al. 2019, ApJ, 874, 150
2019
-
[15]
2022, ApJ, 938, 110
Brout, D., Scolnic, D., Popovic, B., et al. 2022, ApJ, 938, 110
2022
-
[16]
2024, arXiv e-prints (ZTF SI), arXiv:2407.06828
Burgaz, U., Maguire, K., Dimitriadis, G., et al. 2024, arXiv e-prints (ZTF SI), arXiv:2407.06828
2024 arXiv
-
[17]
R., Parent, E., Phillips, M., et al
Burns, C. R., Parent, E., Phillips, M., et al. 2018, ApJ, 869, 56
2018
-
[18]
P., Graham, A
Cameron, E., Driver, S. P., Graham, A. W., & Liske, J. 2009, ApJ, 699, 105
2009
-
[19]
M., et al
Cappellari, M., Bertola, F., Buson, L. M., et al. 2000, in Astronomical Society of the Pacific Conference Series, V ol. 197, Dynamics of Galaxies: from the Early Universe to the Present, ed. F. Combes, G. A. Mamon, & V . Charmandaris, 245
2000
-
[20]
1935, MNRAS, 95, 207
Chandrasekhar, S. 1935, MNRAS, 95, 207
1935
-
[21]
2006, MNRAS, 366, 717
Chang, R., Gallazzi, A., Kauffmann, G., et al. 2006, MNRAS, 366, 717
2006
-
[22]
Conselice, C. J. 2014, ARA&A, 52, 291
2014
-
[23]
2024, arXiv e-prints (ZTF SI), arXiv:2406.19460
Deckers, M., Maguire, K., Shingles, L., et al. 2024, arXiv e-prints (ZTF SI), arXiv:2406.19460
2024 arXiv
-
[24]
M., Riddle, R., et al
Dekany, R., Smith, R. M., Riddle, R., et al. 2020, PASP, 132, 038001
2020
-
[25]
G., García-Benito, R., Pérez, E., et al
Delgado, R. G., García-Benito, R., Pérez, E., et al. 2015, A&A, 581, A103
2015
-
[26]
J., Lang, D., et al
Dey, A., Schlegel, D. J., Lang, D., et al. 2019, AJ, 157, 168
2019
-
[27]
2022, MNRAS, 510, 2228 Di Valentino, E., Mena, O., Pan, S., et al
Dhawan, S., Goobar, A., Smith, M., et al. 2022, MNRAS, 510, 2228 Di Valentino, E., Mena, O., Pan, S., et al. 2021, Classical and Quantum Gravity, 38, 153001
2022
-
[28]
A., Baes, M., Bourne, N., et al
Eales, S. A., Baes, M., Bourne, N., et al. 2018, MNRAS, 481, 1183
2018
-
[29]
K., Hillebrandt, W., et al
Fink, M., Röpke, F. K., Hillebrandt, W., et al. 2010, A&A, 514, A53
2010
-
[30]
& Massa, D
Fitzpatrick, E. & Massa, D. 2007, ApJ, 663, 320
2007
-
[31]
Freedman, W. L. 2021, ApJ, 919, 16
2021
-
[32]
S., Garnavich, P
Gallagher, J. S., Garnavich, P. M., Caldwell, N., et al. 2008, ApJ, 685, 752
2008
-
[33]
M., Milne, P., et al
Garnavich, P., Wood, C. M., Milne, P., et al. 2023, ApJ, 953, 35
2023
-
[34]
M., Jha, S., Challis, P., et al
Garnavich, P. M., Jha, S., Challis, P., et al. 1998, ApJ, 509, 74
1998
-
[35]
2024, arXiv e-prints (ZTF SI), arXiv:2405.20965
Ginolin, M., Rigault, M., Smith, M., et al. 2024, arXiv e-prints (ZTF SI), arXiv:2405.20965
2024 arXiv
-
[36]
2022, Transient Name Server As- troNote, 191, 1
Goldwasser, S., Yaron, O., Sass, A., et al. 2022, Transient Name Server As- troNote, 191, 1
2022
-
[37]
Graham, A. W. & Driver, S. P. 2005, PASA, 22, 118
2005
-
[38]
Graham, A. W. & Worley, C. C. 2008, MNRAS, 388, 1708
2008
-
[39]
J., Kulkarni, S
Graham, M. J., Kulkarni, S. R., Bellm, E. C., et al. 2019, PASP, 131, 078001
2019
-
[40]
2005, A&A, 441, 1055
Greggio, L. 2005, A&A, 441, 1055
2005
-
[41]
2007, A&A, 466, 11
Guy, J., Astier, P., Baumont, S., et al. 2007, A&A, 466, 11
2007
-
[42]
2005, A&A, 443, 781
Guy, J., Astier, P., Nobili, S., Regnault, N., & Pain, R. 2005, A&A, 443, 781
2005
-
[43]
2020, MNRAS, 499, 1424
Hakobyan, A., Barkhudaryan, L., Karapetyan, A., et al. 2020, MNRAS, 499, 1424
2020
-
[44]
A., et al
Hamuy, M., Phillips, M., Schommer, R. A., et al. 1996, arXiv preprint astro- ph/9609059
1996
-
[45]
M., Maza, J., et al
Hamuy, M., Phillips, M. M., Maza, J., et al. 1995, AJ, 109, 1
1995
-
[46]
T., Gupta, R
Hayden, B. T., Gupta, R. R., Garnavich, P. M., et al. 2013, ApJ, 764, 191
2013
-
[47]
& Fowler, W
Hoyle, F. & Fowler, W. A. 1960, ApJ, 132, 565
1960
-
[48]
& Tutukov, A
Iben, I., J. & Tutukov, A. V . 1984, ApJS, 54, 335
1984
-
[49]
1996, MNRAS, 281, 487
Kauffmann, G. 1996, MNRAS, 281, 487
1996
-
[50]
M., White, S
Kauffmann, G., Heckman, T. M., White, S. D. M., et al. 2003, MNRAS, 341, 54
2003
-
[51]
L., Hicken, M., Burke, D
Kelly, P. L., Hicken, M., Burke, D. L., Mandel, K. S., & Kirshner, R. P. 2010, ApJ, 715, 743
2010
-
[52]
2021, MNRAS, 501, 4861
Kelsey, L., Sullivan, M., Smith, M., et al. 2021, MNRAS, 501, 4861
2021
-
[53]
2023, MNRAS, 519, 3046
Kelsey, L., Sullivan, M., Wiseman, P., et al. 2023, MNRAS, 519, 3046
2023
-
[54]
S., Driver, S
Kelvin, L. S., Driver, S. P., Robotham, A. S., et al. 2014, MNRAS, 444, 1647
2014
-
[55]
2024, MNRAS, 529, 3806
Kim, Y .-L., Galbany, L., Hook, I., & Kang, Y . 2024, MNRAS, 529, 3806
2024
-
[56]
2019, Journal of Korean Astronomical Soci- ety, 52, 181
Kim, Y .-L., Kang, Y ., & Lee, Y .-W. 2019, Journal of Korean Astronomical Soci- ety, 52, 181
2019
-
[57]
L., Calzetti, D., Bohlin, R
Kinney, A. L., Calzetti, D., Bohlin, R. C., et al. 1996, ApJ, 467, 38
1996
-
[58]
C., et al
Lampeitl, H., Smith, M., Nichol, R. C., et al. 2010, ApJ, 722, 566
2010
-
[59]
P., Robotham, A
Lange, R., Driver, S. P., Robotham, A. S., et al. 2015, MNRAS, 447, 2603 Le Borgne, D. & Rocca-V olmerange, B. 2002, A&A, 386, 446
2015
-
[60]
2011, MNRAS, 412, 1473
Li, W., Chornock, R., Leaman, J., et al. 2011, MNRAS, 412, 1473
2011
-
[61]
J., Schawinski, K., Slosar, A., et al
Lintott, C. J., Schawinski, K., Slosar, A., et al. 2008, MNRAS, 389, 1179
2008
-
[62]
K., & Han, Z
Liu, Z., Roepke, F. K., & Han, Z. 2023, Research in Astronomy and Astrophysics
2023
-
[63]
H., Gunn, J
Lupton, R. H., Gunn, J. E., & Szalay, A. S. 1999, AJ, 118, 1406
1999
-
[64]
A., Courteau, S., Bell, E., & Holtzman, J
MacArthur, L. A., Courteau, S., Bell, E., & Holtzman, J. A. 2004, ApJS, 152, 175
2004
-
[65]
& Mannucci, F
Maiolino, R. & Mannucci, F. 2019, A&A Rev., 27, 3
2019
-
[66]
2006, MNRAS, 370, 773
Mannucci, F., Della Valle, M., & Panagia, N. 2006, MNRAS, 370, 773
2006
-
[67]
2014, ARA&A, 52, 107
Maoz, D., Mannucci, F., & Nelemans, G. 2014, ARA&A, 52, 107
2014
-
[68]
J., Laher, R
Masci, F. J., Laher, R. R., Rusholme, B., et al. 2018, PASP, 131, 018003 Müller-Bravo, T. E. & Galbany, L. 2022, arXiv preprint arXiv:2208.08117 Muñoz-Mateos, J., De Paz, A. G., Boissier, S., et al. 2009, ApJ, 701, 1965
2018 arXiv
-
[69]
2021, A&A, 649, A74
Nicolas, N., Rigault, M., Copin, Y ., et al. 2021, A&A, 649, A74
2021
-
[70]
1982, ApJ, 253, 798
Nomoto, K. 1982, ApJ, 253, 798
1982
-
[71]
H., Seitenzahl, I
Panther, F. H., Seitenzahl, I. R., Ruiter, A. J., et al. 2019, PASA, 36, e031
2019
-
[72]
A., Popescu, C
Pastrav, B. A., Popescu, C. C., Tu ffs, R. J., & Sansom, A. E. 2013, A&A, 553, A80
2013
-
[73]
2011, Journal of Machine Learning Research, 12, 2825
Pedregosa, F., Varoquaux, G., Gramfort, A., et al. 2011, Journal of Machine Learning Research, 12, 2825
2011
-
[74]
Y ., Ho, L
Peng, C. Y ., Ho, L. C., Impey, C. D., & Rix, H.-W. 2010, AJ, 139, 2097
2010
-
[75]
1999, ApJ, 517, 565
Perlmutter, S., Aldering, G., Goldhaber, G., et al. 1999, ApJ, 517, 565
1999
-
[76]
S., & White, M
Perlmutter, S., Turner, M. S., & White, M. 1999, Phys. Rev. Lett., 83, 670
1999
-
[77]
R., et al
Phillips, M., Ashall, C., Burns, C. R., et al. 2022, ApJ, 938, 47
2022
-
[78]
Phillips, M. M. 1993, ApJ, 413, L105
1993
-
[79]
2020, MNRAS, 499, 5121
Pruzhinskaya, M., Novinskaya, A., Pauna, N., & Rosnet, P. 2020, MNRAS, 499, 5121
2020
-
[80]
V ., Novinskaya, A
Pruzhinskaya, M. V ., Novinskaya, A. K., Pauna, N., & Rosnet, P. 2020, MNRAS, 499, 5121
2020
-
[81]
G., Filippenko, A
Riess, A. G., Filippenko, A. V ., Challis, P., et al. 1998, AJ, 116, 1009
1998
-
[82]
G., Press, W
Riess, A. G., Press, W. H., & Kirshner, R. P. 1996, ApJ, 473, 88
1996
-
[83]
G., Yuan, W., Macri, L
Riess, A. G., Yuan, W., Macri, L. M., et al. 2022, ApJ, 934, L7
2022
-
[84]
2020, A&A, 644, A176
Rigault, M., Brinnel, V ., Aldering, G., et al. 2020, A&A, 644, A176
2020
-
[85]
2013, A&A, 560, A66
Rigault, M., Copin, Y ., Aldering, G., et al. 2013, A&A, 560, A66
2013
-
[86]
2024, arXiv e-prints (ZTF SI), arXiv:2409.04346
Rigault, M., Smith, M., Goobar, A., et al. 2024, arXiv e-prints (ZTF SI), arXiv:2409.04346
2024 arXiv
-
[87]
2018, A&A, 615, A68 Sánchez, S., Rosales-Ortega, F., Iglesias-Páramo, J., et al
Roman, M., Hardin, D., Betoule, M., et al. 2018, A&A, 615, A68 Sánchez, S., Rosales-Ortega, F., Iglesias-Páramo, J., et al. 2014, A&A, 563, A49
2018
-
[88]
2009, MNRAS, 396, 818
Schawinski, K., Lintott, C., Thomas, D., et al. 2009, MNRAS, 396, 818
2009
-
[89]
M., Jones, D., Rest, A., et al
Scolnic, D. M., Jones, D., Rest, A., et al. 2018, ApJ, 859, 101
2018
-
[90]
J., Kasen, D., Miles, B
Shen, K. J., Kasen, D., Miles, B. J., & Townsley, D. M. 2018, ApJ, 854, 52
2018
-
[91]
J., Toonen, S., & Graur, O
Shen, K. J., Toonen, S., & Graur, O. 2017, ApJ, 851, L50
2017
-
[92]
Simard, L., Willmer, C. N. A., V ogt, N. P., et al. 2002, ApJS, 142, 1
2002
-
[93]
2015, MNRAS, 450, 435
Smethurst, R., Lintott, C., Simmons, B., et al. 2015, MNRAS, 450, 435
2015
-
[94]
2020, MNRAS, 494, 4426 Article number, page 22 of 23 R
Smith, M., Sullivan, M., Wiseman, P., et al. 2020, MNRAS, 494, 4426 Article number, page 22 of 23 R. Senzel et al.: ZTF SN Ia DR2 - Host Galaxy Decomposition
2020
-
[95]
T., Nugent, P., Knop, R
Soumagnac, M. T., Nugent, P., Knop, R. A., et al. 2024, arXiv preprint arXiv:2405.03857
2024 arXiv
-
[96]
H., Bernardi, M., et al
Stoughton, C., Lupton, R. H., Bernardi, M., et al. 2002, AJ, 123, 485
2002
-
[97]
2010, MNRAS, 406, 782
Sullivan, M., Conley, A., Howell, D., et al. 2010, MNRAS, 406, 782
2010
-
[98]
2003, MNRAS, 340, 1057
Sullivan, M., Ellis, R., Aldering, G., et al. 2003, MNRAS, 340, 1057
2003
-
[99]
2021, MNRAS, 504, 4111
Taylor, G., Lidman, C., Tucker, B., et al. 2021, MNRAS, 504, 4111
2021
-
[100]
2010, MNRAS, 404, 1775
Thomas, D., Maraston, C., Schawinski, K., Sarzi, M., & Silk, J. 2010, MNRAS, 404, 1775
2010
-
[101]
Tolman, R. C. 1930, Proceedings of the National Academy of Science, 16, 511
1930
-
[102]
Tolman, R. C. 1934, Proceedings of the National Academy of Sciences, 20, 169
1934
-
[103]
A., Heckman, T
Tremonti, C. A., Heckman, T. M., Kauffmann, G., et al. 2004, ApJ, 613, 898
2004
-
[104]
2001, MNRAS, 328, 977
Trujillo, I., Aguerri, J., Cepa, J., & Gutiérrez, C. 2001, MNRAS, 328, 977
2001
-
[105]
A., Mould, J., Lidman, C., Ruhlmann-Kleider, V ., & Zhang, B
Uddin, S. A., Mould, J., Lidman, C., Ruhlmann-Kleider, V ., & Zhang, B. R. 2017, ApJ, 848, 56 van der Walt, S., Schönberger, J. L., Nunez-Iglesias, J., et al. 2014, PeerJ, 2, e453
2017
-
[106]
E., et al
Virtanen, P., Gommers, R., Oliphant, T. E., et al. 2020, Nature Methods, 17, 261
2020
-
[107]
J., Yates, R
Walcher, C. J., Yates, R. M., Minchev, I., et al. 2016, A&A, 594, A61
2016
-
[108]
2023, MNRAS, 526, 4768
Walmsley, M., Géron, T., Kruk, S., et al. 2023, MNRAS, 526, 4768
2023
-
[109]
& Iben Jr, I
Whelan, J. & Iben Jr, I. 1973, ApJ, 186, 1007
1973
-
[110]
2023, MNRAS, 520, 6214
Wiseman, P., Sullivan, M., Smith, M., & Popovic, B. 2023, MNRAS, 520, 6214
2023
-
[111]
2022, MNRAS, 515, 4587
Wiseman, P., Vincenzi, M., Sullivan, M., et al. 2022, MNRAS, 515, 4587
2022
-
[112]
& Kasen, D
Woosley, S. & Kasen, D. 2011, ApJ, 734, 38
2011
-
[113]
2022, ApJ, 938, 83 Article number, page 23 of 23
Yang, J., Wang, L., Suntzeff, N., et al. 2022, ApJ, 938, 83 Article number, page 23 of 23
2022
Reviewed August 12, 2026 · model on record in the stance chip above.
Discussion (0). Continue with ORCID to comment.